Carolina Beach Airbnb Market Analysis 2026: Short Term Rental Data & Vacation Rental Statistics in North Carolina, United States
Is Airbnb profitable in Carolina Beach in 2026? Explore comprehensive Airbnb analytics for Carolina Beach, North Carolina, United States to uncover income potential. This 2026 STR market report for Carolina Beach, based on AirROI data from February 2025 to January 2026, reveals key trends in the bustling market of 1,660 active listings.
Whether you're considering an Airbnb investment in Carolina Beach, optimizing your existing vacation rental, or exploring rental arbitrage opportunities, understanding the Carolina Beach Airbnb data is crucial. Leveraging the low regulation environment is key to maximizing your short term rental income potential. Let's dive into the specifics.
Key Carolina Beach Airbnb Performance Metrics Overview
Monthly Airbnb Revenue Variations & Income Potential in Carolina Beach (2026)
Understanding the monthly revenue variations for Airbnb listings in Carolina Beach is key to maximizing your short term rental income potential. Seasonality significantly impacts earnings. Our analysis, based on data from the past 12 months, shows that the peak revenue month for STRs in Carolina Beach is typically July, while February often presents the lowest earnings, highlighting opportunities for strategic pricing adjustments during shoulder and low seasons. Explore the typical Airbnb income in Carolina Beach across different performance tiers:
- Best-in-class properties (Top 10%) achieve $7,908+ monthly, often utilizing dynamic pricing and superior guest experiences.
- Strong performing properties (Top 25%) earn $5,398 or more, indicating effective management and desirable locations/amenities.
- Typical properties (Median) generate around $3,418 per month, representing the average market performance.
- Entry-level properties (Bottom 25%) see earnings around $1,941, often with potential for optimization.
Average Monthly Airbnb Earnings Trend in Carolina Beach
Carolina Beach Airbnb Occupancy Rate Trends (2026)
Maximize your bookings by understanding the Carolina Beach STR occupancy trends. Seasonal demand shifts significantly influence how often properties are booked. Typically, Julysees the highest demand (peak season occupancy), while January experiences the lowest (low season). Effective strategies, like adjusting minimum stays or offering promotions, can boost occupancy during slower periods. Here's how different property tiers perform in Carolina Beach:
- Best-in-class properties (Top 10%) achieve 75%+ occupancy, indicating high desirability and potentially optimized availability.
- Strong performing properties (Top 25%) maintain 58% or higher occupancy, suggesting good market fit and guest satisfaction.
- Typical properties (Median) have an occupancy rate around 40%.
- Entry-level properties (Bottom 25%) average 22% occupancy, potentially facing higher vacancy.
Average Monthly Occupancy Rate Trend in Carolina Beach
Average Daily Rate (ADR) Airbnb Trends in Carolina Beach (2026)
Effective short term rental pricing strategy in Carolina Beach involves understanding monthly ADR fluctuations. The Average Daily Rate (ADR) for Airbnb in Carolina Beach typically peaks in July and dips lowest during February. Leveraging Airbnb dynamic pricing tools or strategies based on this seasonality can significantly boost revenue. Here's a look at the typical nightly rates achieved:
- Best-in-class properties (Top 10%) command rates of $536+ per night, often due to premium features or locations.
- Strong performing properties (Top 25%) achieve nightly rates of $397 or more.
- Typical properties (Median) charge around $287 per night.
- Entry-level properties (Bottom 25%) earn around $212 per night.
Average Daily Rate (ADR) Trend by Month in Carolina Beach
Get Live Carolina Beach Market Intelligence 👇

Explore Real-time Analytics
Airbnb Seasonality Analysis & Trends in Carolina Beach (2026)
Peak Season (July, June, August)
- Revenue averages $7,550 per month
- Occupancy rates average 62.5%
- Daily rates average $379
Shoulder Season
- Revenue averages $3,484 per month
- Occupancy maintains around 38.3%
- Daily rates hold near $322
Low Season (January, February, December)
- Revenue drops to average $2,121 per month
- Occupancy decreases to average 26.0%
- Daily rates adjust to average $306
Seasonality Insights for Carolina Beach
- The Airbnb seasonality in Carolina Beach shows highly seasonal trends requiring careful strategy. While the sections above show seasonal averages, it's also insightful to look at the extremes:
- During the high season, the absolute peak month showcases Carolina Beach's highest earning potential, with monthly revenues capable of climbing to $8,654, occupancy reaching a high of 68.4%, and ADRs peaking at $388.
- Conversely, the slowest single month of the year, typically falling within the low season, marks the market's lowest point. In this month, revenue might dip to $1,743, occupancy could drop to 21.4%, and ADRs may adjust down to $270.
- Understanding both the seasonal averages and these monthly peaks and troughs in revenue, occupancy, and ADR is crucial for maximizing your Airbnb profit potential in Carolina Beach.
Seasonal Strategies for Maximizing Profit
- Peak Season: Maximize revenue through premium pricing and potentially longer minimum stays. Ensure high availability.
- Low Season: Offer competitive pricing, special promotions (e.g., extended stay discounts), and flexible cancellation policies. Target off-season travelers like remote workers or budget-conscious guests.
- Shoulder Seasons: Implement dynamic pricing that balances peak and low rates. Target weekend travelers or specific events. Offer slightly more flexible terms than peak season.
- Regularly analyze your own performance against these Carolina Beach seasonality benchmarks and adjust your pricing and availability strategy accordingly.
Best Areas for Airbnb Investment in Carolina Beach (2026)
Exploring the top neighborhoods for short-term rentals in Carolina Beach? This section highlights key areas, outlining why they are attractive for hosts and guests, along with notable local attractions. Consider these locations based on your target guest profile and investment strategy.
| Neighborhood / Area | Why Host Here? (Target Guests & Appeal) | Key Attractions & Landmarks |
|---|---|---|
| South Beach | Beautiful beachfront area known for its lively atmosphere and family-friendly attractions. Ideal for visitors looking for proximity to the ocean and local activities. | Carolina Beach Boardwalk, Carolina Beach State Park, Freeman Park, Ocean Trails Park, Carolina Beach Fishing Pier, Historic Carolina Beach |
| Kure Beach | Quieter and more serene than Carolina Beach, Kure Beach is perfect for families and couples seeking a relaxing escape. Close to the historic Fort Fisher and nature trails. | Fort Fisher State Recreation Area, Kure Beach Pier, North Carolina Aquarium at Fort Fisher, Cameron Art Museum, Zeke's Island Reserve |
| Wilmington | Just a short drive from Carolina Beach, Wilmington boasts a historic downtown with a rich history, riverfront parks, and vibrant nightlife. Popular for those seeking culture and dining. | Riverwalk, Historic District, Battleship North Carolina, Bellamy Mansion Museum, Cameron Art Museum |
| Fort Fisher | A peaceful area known for its natural beauty and historical significance. Perfect for nature lovers and those interested in history and marine life. | Fort Fisher Historic Site, Carolina Beach State Park, Kure Beach, North Carolina Aquarium |
| Brunswick County | Offers a range of rural and coastal properties, ideal for those seeking a more laid-back lifestyle and proximity to beautiful beaches. | Sunset Beach, Ocean Isle Beach, Calabash, Holden Beach, Brunswick Islands Museum |
| Lockwood Folly | A lesser-known gem with waterfront properties and a close-knit community feel. Great for those looking for a retreat away from the busier tourist spots. | Lockwood Folly Country Club, River Hills Golf and Country Club, Lockwood Folly River |
| Shell Island | A secluded island paradise with stunning beaches and wildlife. Perfect for eco-tourism and outdoor activities like fishing and kayaking. | Shell Island Banks, Wildlife at Shell Island, Camping on the Beach, Fort Fisher |
| Oak Island | A family-friendly beach community known for its warm atmosphere and beautiful scenery. Suitable for families and groups looking for a fun beach getaway. | Oak Island Lighthouse, Long Beach, Oak Island Nature Center, Fishing from the pier, Kayaking |
Understanding Airbnb License Requirements & STR Laws in Carolina Beach (2026)
While Carolina Beach, North Carolina, United States currently shows low STR regulations, specific Airbnb license requirements might still exist or change. Always verify the latest short term rental regulations and Airbnb license requirements directly with local government authorities for Carolina Beach to ensure full compliance before hosting.
(Source: AirROI data, 2026, finding no licensed listings among those analyzed)
Top Performing Airbnb Properties in Carolina Beach (2026)
Benchmark your potential! Explore examples of top-performing Airbnb properties in Carolina Beachbased on Trailing Twelve Month (TTM) revenue. Analyze their characteristics, revenue, occupancy rate, and ADR to understand what drives success in this market.
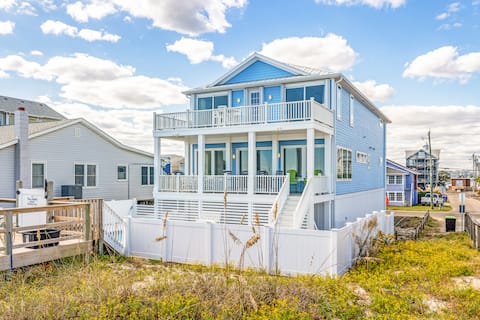
A View to Sea - Pool - Hot Tub - Dogs Welcome
Entire Place • 7 bedrooms
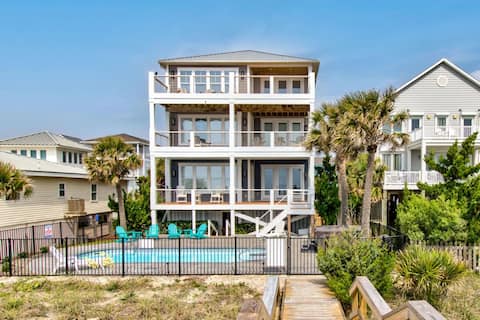
One Step Away - Sleeps 28
Entire Place • 9 bedrooms

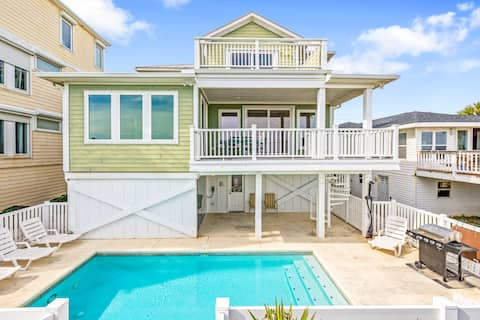
Oceanfront, private pool, 10 bedrooms
Entire Place • 10 bedrooms
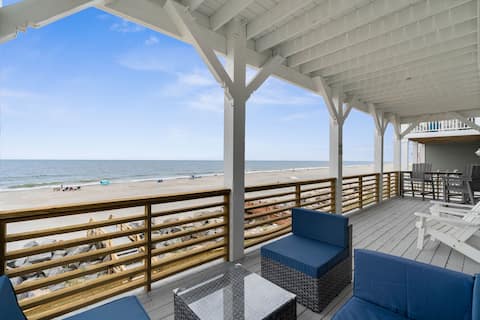
Sage Seahorse - oceanfront/pool/hot tub
Entire Place • 6 bedrooms
A Shore Thing 2-LARGE 6 bd PET Friendly Oceanfront
Entire Place • 6 bedrooms
The OdySea
Entire Place • 7 bedrooms
Note: Performance varies based on location, size, amenities, seasonality, and management quality. Data reflects the past 12 months.
Top Performing Airbnb Hosts in Carolina Beach (2026)
Learn from the best! This table showcases top-performing Airbnb hosts in Carolina Beach based on the number of properties managed and estimated total revenue over the past year. Analyze their scale and performance metrics.
| Host Name | Properties | Grossing Revenue | Stay Reviews | Avg Rating |
|---|---|---|---|---|
| Bryant Real | 85 | $3,046,455 | 755 | 4.50/5.0 |
| Carolina Beach Realty | 97 | $2,892,625 | 616 | 4.39/5.0 |
| Carolina Retreats Vacation Ren | 60 | $2,417,150 | 500 | 4.62/5.0 |
| Palm Air Realty | 47 | $2,192,057 | 1092 | 4.61/5.0 |
| Jim | 17 | $2,027,649 | 293 | 4.96/5.0 |
| Going Coastal | 51 | $2,009,718 | 1704 | 4.77/5.0 |
| Justin | 49 | $1,597,271 | 216 | 4.58/5.0 |
| Dale | 40 | $1,302,909 | 1549 | 4.66/5.0 |
| A1 Property Management | 16 | $1,123,105 | 44 | 4.74/5.0 |
| Evolve | 24 | $1,071,823 | 686 | 4.85/5.0 |
Analyzing the strategies of top hosts, such as their property selection, pricing, and guest communication, can offer valuable lessons for optimizing your own Airbnb operations in Carolina Beach.
Dive Deeper: Advanced Carolina Beach STR Market Data (2026)
Ready to unlock more insights? AirROI provides access to advanced metrics and comprehensive Airbnb data for Carolina Beach. Explore detailed analytics beyond this report to refine your investment strategy, optimize pricing, and maximize your vacation rental profits.
Explore Advanced MetricsCarolina Beach Short-Term Rental Market Composition (2026): Property & Room Types
Room Type Distribution
Property Type Distribution
Market Composition Insights for Carolina Beach
- The Carolina Beach Airbnb market composition is heavily skewed towards Entire Home/Apt listings, which make up 97.4% of the 1,660 active rentals. This indicates strong guest preference for privacy and space.
- Looking at the property type distribution in Carolina Beach, Apartment/Condo properties are the most common (50.1%), reflecting the local real estate landscape.
- Houses represent a significant 46.7% portion, catering likely to families or larger groups.
- Smaller segments like hotel/boutique, others, outdoor/unique (combined 3.3%) offer potential for unique stay experiences.
Carolina Beach Airbnb Room Capacity Analysis (2026): Bedroom Distribution
Distribution of Listings by Number of Bedrooms
Room Capacity Insights for Carolina Beach
- The dominant room capacity in Carolina Beach is 2 bedrooms listings, making up 29.6% of the market. This suggests a strong demand for properties suitable for couples or solo travelers.
- Together, 2 bedrooms and 3 bedrooms properties represent 54.2% of the active Airbnb listings in Carolina Beach, indicating a high concentration in these sizes.
- A significant 44.5% of listings offer 3+ bedrooms, catering to larger groups and families seeking more space in Carolina Beach.
Carolina Beach Vacation Rental Guest Capacity Trends (2026)
Distribution of Listings by Guest Capacity
Guest Capacity Insights for Carolina Beach
- The most common guest capacity trend in Carolina Beach vacation rentals is listings accommodating 8+ guests (34.2%). This suggests the primary traveler segment is likely larger groups.
- Properties designed for 8+ guests and 6 guests dominate the Carolina Beach STR market, accounting for 59.4% of listings.
- 64.5% of properties accommodate 6+ guests, serving the market segment for larger families or group travel in Carolina Beach.
- On average, properties in Carolina Beach are equipped to host 5.9 guests.
Carolina Beach Airbnb Booking Patterns (2026): Available vs. Booked Days
Available Days Distribution
Booked Days Distribution
Booking Pattern Insights for Carolina Beach
- The most common availability pattern in Carolina Beach falls within the 271-366 days range, representing 43.8% of listings. This suggests many properties have significant open periods on their calendars.
- Approximately 83.4% of listings show high availability (181+ days open annually), indicating potential for increased bookings or specific owner usage patterns.
- For booked days, the 91-180 days range is most frequent in Carolina Beach (40.2%), reflecting common guest stay durations or potential owner blocking patterns.
- A notable 17.5% of properties secure long booking periods (181+ days booked per year), highlighting successful long-term rental strategies or significant owner usage.
Carolina Beach Airbnb Minimum Stay Requirements Analysis
Distribution of Listings by Minimum Night Requirement
1 Night
132 listings
8% of total
2 Nights
241 listings
14.5% of total
3 Nights
168 listings
10.1% of total
4-6 Nights
90 listings
5.4% of total
7-29 Nights
27 listings
1.6% of total
30+ Nights
1001 listings
60.3% of total
Key Insights
- The most prevalent minimum stay requirement in Carolina Beach is 30+ Nights, adopted by 60.3% of listings. This highlights the market's preference for longer commitments.
- A significant segment (60.3%) caters to monthly stays (30+ nights) in Carolina Beach, pointing to opportunities in the extended-stay market.
Recommendations
- Align with the market by considering a 30+ Nights minimum stay, as 60.3% of Carolina Beach hosts use this setting.
- If feasible, allowing 1-night stays, especially midweek or during low season, could capture last-minute bookings, as only 8% currently do.
- Explore offering discounts for stays of 30+ nights to attract the 60.3% of the market seeking extended stays.
- Adjust minimum nights based on seasonality – potentially shorter during low season and longer during peak demand periods in Carolina Beach.
Carolina Beach Airbnb Cancellation Policy Trends Analysis (2026)
Super Strict 30 Days
46 listings
2.8% of total
Limited
10 listings
0.6% of total
Super Strict 60 Days
162 listings
9.8% of total
Flexible
75 listings
4.5% of total
Moderate
283 listings
17.1% of total
Firm
807 listings
48.7% of total
Strict
275 listings
16.6% of total
Cancellation Policy Insights for Carolina Beach
- The prevailing Airbnb cancellation policy trend in Carolina Beach is Firm, used by 48.7% of listings.
- A majority (65.3%) of hosts in Carolina Beach utilize Firm or Strict policies, indicating a market where hosts prioritize booking security.
Recommendations for Hosts
- Consider adopting a Firm policy to align with the 48.7% market standard in Carolina Beach.
- Regularly review your cancellation policy against competitors and market demand shifts in Carolina Beach.
Carolina Beach STR Booking Lead Time Analysis (2026)
Average Booking Lead Time by Month
Booking Lead Time Insights for Carolina Beach
- The overall average booking lead time for vacation rentals in Carolina Beach is 50 days.
- Guests book furthest in advance for stays during July (average 70 days), likely coinciding with peak travel demand or local events.
- The shortest booking windows occur for stays in February (average 26 days), indicating more last-minute travel plans during this time.
- Seasonally, Summer (64 days avg.) sees the longest lead times, while Winter (31 days avg.) has the shortest, reflecting typical travel planning cycles.
Recommendations for Hosts
- Use the overall average lead time (50 days) as a baseline for your pricing and availability strategy in Carolina Beach.
- For July stays, consider implementing length-of-stay discounts or slightly higher rates for bookings made less than 70 days out to capitalize on advance planning.
- Target marketing efforts for the Summer season well in advance (at least 64 days) to capture early planners.
- Monitor your own booking lead times against these Carolina Beach averages to identify opportunities for dynamic pricing adjustments.
Popular & Essential Airbnb Amenities in Carolina Beach (2026)
Amenity Prevalence
Amenity Insights for Carolina Beach
- Essential amenities in Carolina Beach that guests expect include: Air conditioning, Wifi, TV, Smoke alarm, Free parking on premises, Heating, Kitchen. Lacking these (any) could significantly impact bookings.
- Popular amenities like Coffee maker, Refrigerator, Microwave are common but not universal. Offering these can provide a competitive edge.
Recommendations for Hosts
- Ensure your listing includes all essential amenities for Carolina Beach: Air conditioning, Wifi, TV, Smoke alarm, Free parking on premises, Heating, Kitchen.
- Prioritize adding missing essentials: Air conditioning, Wifi, TV, Smoke alarm, Free parking on premises, Heating, Kitchen.
- Consider adding popular differentiators like Coffee maker or Refrigerator to increase appeal.
- Highlight unique or less common amenities you offer (e.g., hot tub, dedicated workspace, EV charger) in your listing description and photos.
- Regularly check competitor amenities in Carolina Beach to stay competitive.
Carolina Beach Airbnb Guest Demographics & Profile Analysis (2026)
Guest Profile Summary for Carolina Beach
- The typical guest profile for Airbnb in Carolina Beach consists of primarily domestic travelers (98%), often arriving from nearby Raleigh, typically belonging to the Post-2000s (Gen Z/Alpha) group (50%), primarily speaking English or Spanish.
- Domestic travelers account for 98.4% of guests.
- Key international markets include United States (98.4%) and DC (0.5%).
- Top languages spoken are English (77.3%) followed by Spanish (12.3%).
- A significant demographic segment is the Post-2000s (Gen Z/Alpha) group, representing 50% of guests.
Recommendations for Hosts
- Target domestic marketing efforts towards travelers from Raleigh and Charlotte.
- Tailor amenities and listing descriptions to appeal to the dominant Post-2000s (Gen Z/Alpha) demographic (e.g., highlight fast WiFi, smart home features, local guides).
- Highlight unique local experiences or amenities relevant to the primary guest profile.
- Consider seasonal promotions aligned with peak travel times for key origin markets.
Nearby Short-Term Rental Market Comparison
How does the Carolina Beach Airbnb market stack up against its neighbors? Compare key performance metrics like average monthly revenue, ADR, and occupancy rates in surrounding areas to understand the broader regional STR landscape.
| Market | Active Properties | Monthly Revenue | Daily Rate | Avg. Occupancy |
|---|---|---|---|---|
| Ocean Isle Beach | 508 | $5,018 | $610.93 | 38% |
| Wrightsville Beach | 497 | $4,620 | $531.11 | 39% |
| Bald Head Island | 207 | $4,127 | $601.50 | 33% |
| Kure Beach | 502 | $3,804 | $427.64 | 42% |
| Cedar Point | 30 | $3,725 | $310.88 | 49% |
| Emerald Isle | 510 | $3,693 | $392.93 | 42% |
| Surfside Beach | 474 | $3,680 | $391.70 | 42% |
| North Topsail Beach | 946 | $3,533 | $428.67 | 39% |
| Surf City | 737 | $3,518 | $389.38 | 39% |
| Caswell Beach | 50 | $3,498 | $430.69 | 41% |