Buxton Airbnb Market Analysis 2026: Short Term Rental Data & Vacation Rental Statistics in North Carolina, United States
Is Airbnb profitable in Buxton in 2026? Explore comprehensive Airbnb analytics for Buxton, North Carolina, United States to uncover income potential. This 2026 STR market report for Buxton, based on AirROI data from February 2025 to January 2026, reveals key trends in the niche market of 174 active listings.
Whether you're considering an Airbnb investment in Buxton, optimizing your existing vacation rental, or exploring rental arbitrage opportunities, understanding the Buxton Airbnb data is crucial. Leveraging the low regulation environment is key to maximizing your short term rental income potential. Let's dive into the specifics.
Key Buxton Airbnb Performance Metrics Overview
Monthly Airbnb Revenue Variations & Income Potential in Buxton (2026)
Understanding the monthly revenue variations for Airbnb listings in Buxton is key to maximizing your short term rental income potential. Seasonality significantly impacts earnings. Our analysis, based on data from the past 12 months, shows that the peak revenue month for STRs in Buxton is typically July, while January often presents the lowest earnings, highlighting opportunities for strategic pricing adjustments during shoulder and low seasons. Explore the typical Airbnb income in Buxton across different performance tiers:
- Best-in-class properties (Top 10%) achieve $4,468+ monthly, often utilizing dynamic pricing and superior guest experiences.
- Strong performing properties (Top 25%) earn $2,587 or more, indicating effective management and desirable locations/amenities.
- Typical properties (Median) generate around $1,543 per month, representing the average market performance.
- Entry-level properties (Bottom 25%) see earnings around $816, often with potential for optimization.
Average Monthly Airbnb Earnings Trend in Buxton
Buxton Airbnb Occupancy Rate Trends (2026)
Maximize your bookings by understanding the Buxton STR occupancy trends. Seasonal demand shifts significantly influence how often properties are booked. Typically, Julysees the highest demand (peak season occupancy), while January experiences the lowest (low season). Effective strategies, like adjusting minimum stays or offering promotions, can boost occupancy during slower periods. Here's how different property tiers perform in Buxton:
- Best-in-class properties (Top 10%) achieve 68%+ occupancy, indicating high desirability and potentially optimized availability.
- Strong performing properties (Top 25%) maintain 45% or higher occupancy, suggesting good market fit and guest satisfaction.
- Typical properties (Median) have an occupancy rate around 26%.
- Entry-level properties (Bottom 25%) average 14% occupancy, potentially facing higher vacancy.
Average Monthly Occupancy Rate Trend in Buxton
Average Daily Rate (ADR) Airbnb Trends in Buxton (2026)
Effective short term rental pricing strategy in Buxton involves understanding monthly ADR fluctuations. The Average Daily Rate (ADR) for Airbnb in Buxton typically peaks in July and dips lowest during February. Leveraging Airbnb dynamic pricing tools or strategies based on this seasonality can significantly boost revenue. Here's a look at the typical nightly rates achieved:
- Best-in-class properties (Top 10%) command rates of $360+ per night, often due to premium features or locations.
- Strong performing properties (Top 25%) achieve nightly rates of $254 or more.
- Typical properties (Median) charge around $187 per night.
- Entry-level properties (Bottom 25%) earn around $149 per night.
Average Daily Rate (ADR) Trend by Month in Buxton
Get Live Buxton Market Intelligence 👇

Explore Real-time Analytics
Airbnb Seasonality Analysis & Trends in Buxton (2026)
Peak Season (July, June, August)
- Revenue averages $4,317 per month
- Occupancy rates average 46.5%
- Daily rates average $304
Shoulder Season
- Revenue averages $1,951 per month
- Occupancy maintains around 30.2%
- Daily rates hold near $223
Low Season (January, November, December)
- Revenue drops to average $1,320 per month
- Occupancy decreases to average 21.1%
- Daily rates adjust to average $202
Seasonality Insights for Buxton
- The Airbnb seasonality in Buxton shows highly seasonal trends requiring careful strategy. While the sections above show seasonal averages, it's also insightful to look at the extremes:
- During the high season, the absolute peak month showcases Buxton's highest earning potential, with monthly revenues capable of climbing to $5,005, occupancy reaching a high of 52.5%, and ADRs peaking at $314.
- Conversely, the slowest single month of the year, typically falling within the low season, marks the market's lowest point. In this month, revenue might dip to $1,114, occupancy could drop to 18.1%, and ADRs may adjust down to $192.
- Understanding both the seasonal averages and these monthly peaks and troughs in revenue, occupancy, and ADR is crucial for maximizing your Airbnb profit potential in Buxton.
Seasonal Strategies for Maximizing Profit
- Peak Season: Maximize revenue through premium pricing and potentially longer minimum stays. Ensure high availability.
- Low Season: Offer competitive pricing, special promotions (e.g., extended stay discounts), and flexible cancellation policies. Target off-season travelers like remote workers or budget-conscious guests.
- Shoulder Seasons: Implement dynamic pricing that balances peak and low rates. Target weekend travelers or specific events. Offer slightly more flexible terms than peak season.
- Regularly analyze your own performance against these Buxton seasonality benchmarks and adjust your pricing and availability strategy accordingly.
Best Areas for Airbnb Investment in Buxton (2026)
Exploring the top neighborhoods for short-term rentals in Buxton? This section highlights key areas, outlining why they are attractive for hosts and guests, along with notable local attractions. Consider these locations based on your target guest profile and investment strategy.
| Neighborhood / Area | Why Host Here? (Target Guests & Appeal) | Key Attractions & Landmarks |
|---|---|---|
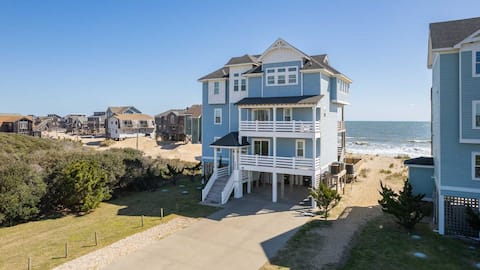
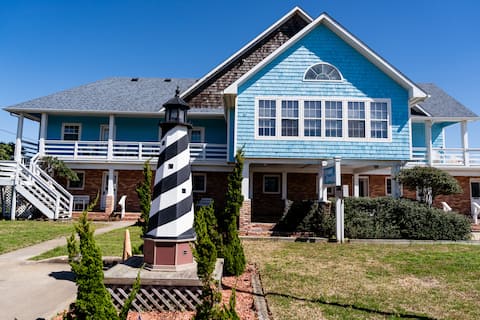
| Cape Hatteras | A famous destination for beach lovers and water sports enthusiasts, known for its iconic lighthouse and stunning views. An ideal spot for families and vacationers seeking relaxation and adventure. | Cape Hatteras Lighthouse, Hatteras Island, Frisco Beach, Buxton Woods Coastal Reserve, Ocracoke Island ferry |
| Tall Trees Recreation Area | Offers a serene and natural setting close to Buxton, perfect for those looking to escape the hustle and bustle. Nature lovers can enjoy hiking and camping. | Tall Trees, nature trails, wildlife observation, scenic views, star gazing |
| Ocracoke Island | Easily accessed from Buxton, this island is known for its charming village and beautiful beaches, attracting visitors looking for a quaint getaway. | Ocracoke Village, Ocracoke Lighthouse, Silver Lake, beaches, local shops and restaurants |
| Hatteras Village | A bustling area with shops, seafood restaurants, and proximity to some of the best fishing spots on the East Coast, making it attractive for anglers and families alike. | Hatteras Island, fishing charters, beach access, local seafood cuisine, the ferry |
| Buxton Beach | A prime location for vacationers seeking the beauty of the Outer Banks with easy beach access and water activities. Popular with families. | Buxton Beach, beachcombing, surfing, shell collecting, sunset views |
| Avon | Known for its beaches and close-knit community feel, Avon offers a great mix of relaxation and activity opportunities for visitors. | Avon Pier, local shops, beaches, water sports, kiteboarding |
| Rodanthe | Famous for its iconic 'Chicamacomico Dry House' and beautiful ocean vistas, Rodanthe is popular among visitors looking for tranquility and beautiful scenery. | Chicamacomico Life-Saving Station, Rodanthe Pier, beaches, kite surfing, scenic drives |
| Hatteras Island Scenic Byway | A picturesque route that offers visitors stunning views of the natural landscape and close proximity to various attractions along the Outer Banks, ideal for travelers who appreciate scenic drives. | Scenic views, wildlife, nature photography, beach access, historical sites |
Understanding Airbnb License Requirements & STR Laws in Buxton (2026)
While Buxton, North Carolina, United States currently shows low STR regulations, specific Airbnb license requirements might still exist or change. Always verify the latest short term rental regulations and Airbnb license requirements directly with local government authorities for Buxton to ensure full compliance before hosting.
(Source: AirROI data, 2026, finding no licensed listings among those analyzed)
Top Performing Airbnb Properties in Buxton (2026)
Benchmark your potential! Explore examples of top-performing Airbnb properties in Buxtonbased on Trailing Twelve Month (TTM) revenue. Analyze their characteristics, revenue, occupancy rate, and ADR to understand what drives success in this market.
Hatteras Retreat Oceanfront + Pets Stay Free
Entire Place • 7 bedrooms

3 br, oceanfront, ocean view, sunrise !
Entire Place • 3 bedrooms

SoundFRONTOBX - 5ensuite BRs VIEWS, sand ,elevator
Entire Place • 5 bedrooms

Lucky Stars: Oceanfront | Rec Room with Pool Table
Entire Place • 5 bedrooms
Anna - Offshore Beach Club
Entire Place • 3 bedrooms

Lightkeeper's Retreat
Entire Place • 3 bedrooms
Note: Performance varies based on location, size, amenities, seasonality, and management quality. Data reflects the past 12 months.
Top Performing Airbnb Hosts in Buxton (2026)
Learn from the best! This table showcases top-performing Airbnb hosts in Buxton based on the number of properties managed and estimated total revenue over the past year. Analyze their scale and performance metrics.
| Host Name | Properties | Grossing Revenue | Stay Reviews | Avg Rating |
|---|---|---|---|---|
| Kees Vacations | 3 | $339,829 | 37 | 4.27/5.0 |
| Billy | 27 | $322,302 | 462 | 4.62/5.0 |
| Seaside Vacations | 2 | $228,274 | 2 | Not Rated |
| Steve | 10 | $204,358 | 88 | 4.90/5.0 |
| Daniel | 9 | $193,164 | 207 | 4.66/5.0 |
| Olivia | 11 | $173,054 | 315 | 4.80/5.0 |
| Lauren | 1 | $151,484 | 80 | 4.96/5.0 |
| Vacasa North Carolina | 20 | $130,007 | 360 | 4.22/5.0 |
| Tim | 4 | $128,481 | 598 | 4.72/5.0 |
| Vacasa North Carolina | 16 | $111,723 | 176 | 4.32/5.0 |
Analyzing the strategies of top hosts, such as their property selection, pricing, and guest communication, can offer valuable lessons for optimizing your own Airbnb operations in Buxton.
Dive Deeper: Advanced Buxton STR Market Data (2026)
Ready to unlock more insights? AirROI provides access to advanced metrics and comprehensive Airbnb data for Buxton. Explore detailed analytics beyond this report to refine your investment strategy, optimize pricing, and maximize your vacation rental profits.
Explore Advanced MetricsBuxton Short-Term Rental Market Composition (2026): Property & Room Types
Room Type Distribution
Property Type Distribution
Market Composition Insights for Buxton
- The Buxton Airbnb market composition is heavily skewed towards Entire Home/Apt listings, which make up 71.3% of the 174 active rentals. This indicates strong guest preference for privacy and space.
- Looking at the property type distribution in Buxton, House properties are the most common (59.2%), reflecting the local real estate landscape.
- Houses represent a significant 59.2% portion, catering likely to families or larger groups.
- The presence of 24.1% Hotel/Boutique listings indicates integration with traditional hospitality.
- Smaller segments like others, outdoor/unique (combined 4.0%) offer potential for unique stay experiences.
Buxton Airbnb Room Capacity Analysis (2026): Bedroom Distribution
Distribution of Listings by Number of Bedrooms
Room Capacity Insights for Buxton
- The dominant room capacity in Buxton is 1 bedroom listings, making up 32.2% of the market. This suggests a strong demand for properties suitable for couples or solo travelers.
- Together, 1 bedroom and 3 bedrooms properties represent 54.6% of the active Airbnb listings in Buxton, indicating a high concentration in these sizes.
- A significant 39.6% of listings offer 3+ bedrooms, catering to larger groups and families seeking more space in Buxton.
Buxton Vacation Rental Guest Capacity Trends (2026)
Distribution of Listings by Guest Capacity
Guest Capacity Insights for Buxton
- The most common guest capacity trend in Buxton vacation rentals is listings accommodating 2 guests (23.6%). This suggests the primary traveler segment is likely couples or solo travelers.
- Properties designed for 2 guests and 4 guests dominate the Buxton STR market, accounting for 45.4% of listings.
- 40.8% of properties accommodate 6+ guests, serving the market segment for larger families or group travel in Buxton.
- On average, properties in Buxton are equipped to host 4.6 guests.
Buxton Airbnb Booking Patterns (2026): Available vs. Booked Days
Available Days Distribution
Booked Days Distribution
Booking Pattern Insights for Buxton
- The most common availability pattern in Buxton falls within the 271-366 days range, representing 71.8% of listings. This suggests many properties have significant open periods on their calendars.
- Approximately 96.5% of listings show high availability (181+ days open annually), indicating potential for increased bookings or specific owner usage patterns.
- For booked days, the 31-90 days range is most frequent in Buxton (37.4%), reflecting common guest stay durations or potential owner blocking patterns.
- A notable 4.0% of properties secure long booking periods (181+ days booked per year), highlighting successful long-term rental strategies or significant owner usage.
Buxton Airbnb Minimum Stay Requirements Analysis
Distribution of Listings by Minimum Night Requirement
1 Night
30 listings
17.2% of total
2 Nights
16 listings
9.2% of total
3 Nights
21 listings
12.1% of total
4-6 Nights
9 listings
5.2% of total
7-29 Nights
10 listings
5.7% of total
30+ Nights
88 listings
50.6% of total
Key Insights
- The most prevalent minimum stay requirement in Buxton is 30+ Nights, adopted by 50.6% of listings. This highlights the market's preference for longer commitments.
- A significant segment (50.6%) caters to monthly stays (30+ nights) in Buxton, pointing to opportunities in the extended-stay market.
Recommendations
- Align with the market by considering a 30+ Nights minimum stay, as 50.6% of Buxton hosts use this setting.
- If feasible, allowing 1-night stays, especially midweek or during low season, could capture last-minute bookings, as only 17.2% currently do.
- Explore offering discounts for stays of 30+ nights to attract the 50.6% of the market seeking extended stays.
- Adjust minimum nights based on seasonality – potentially shorter during low season and longer during peak demand periods in Buxton.
Buxton Airbnb Cancellation Policy Trends Analysis (2026)
Super Strict 30 Days
22 listings
12.7% of total
Super Strict 60 Days
40 listings
23.1% of total
Flexible
7 listings
4% of total
Moderate
30 listings
17.3% of total
Firm
43 listings
24.9% of total
Strict
31 listings
17.9% of total
Cancellation Policy Insights for Buxton
- The prevailing Airbnb cancellation policy trend in Buxton is Firm, used by 24.9% of listings.
- There's a relatively balanced mix between guest-friendly (21.3%) and stricter (42.8%) policies, offering choices for different guest needs.
Recommendations for Hosts
- Consider adopting a Firm policy to align with the 24.9% market standard in Buxton.
- Regularly review your cancellation policy against competitors and market demand shifts in Buxton.
Buxton STR Booking Lead Time Analysis (2026)
Average Booking Lead Time by Month
Booking Lead Time Insights for Buxton
- The overall average booking lead time for vacation rentals in Buxton is 78 days.
- Guests book furthest in advance for stays during October (average 90 days), likely coinciding with peak travel demand or local events.
- The shortest booking windows occur for stays in January (average 45 days), indicating more last-minute travel plans during this time.
- Seasonally, Fall (81 days avg.) sees the longest lead times, while Winter (64 days avg.) has the shortest, reflecting typical travel planning cycles.
Recommendations for Hosts
- Use the overall average lead time (78 days) as a baseline for your pricing and availability strategy in Buxton.
- For October stays, consider implementing length-of-stay discounts or slightly higher rates for bookings made less than 90 days out to capitalize on advance planning.
- Target marketing efforts for the Fall season well in advance (at least 81 days) to capture early planners.
- Monitor your own booking lead times against these Buxton averages to identify opportunities for dynamic pricing adjustments.
Popular & Essential Airbnb Amenities in Buxton (2026)
Amenity Prevalence
Amenity Insights for Buxton
- Essential amenities in Buxton that guests expect include: Air conditioning, Smoke alarm, Free parking on premises. Lacking these (any) could significantly impact bookings.
- Popular amenities like TV, Fire extinguisher, Wifi are common but not universal. Offering these can provide a competitive edge.
- Warning: Wifi is not universally provided but is considered essential globally. Ensure reliable Wifi is offered.
Recommendations for Hosts
- Ensure your listing includes all essential amenities for Buxton: Air conditioning, Smoke alarm, Free parking on premises.
- Prioritize adding missing essentials: Air conditioning, Smoke alarm, Free parking on premises.
- Consider adding popular differentiators like TV or Fire extinguisher to increase appeal.
- Highlight unique or less common amenities you offer (e.g., hot tub, dedicated workspace, EV charger) in your listing description and photos.
- Regularly check competitor amenities in Buxton to stay competitive.
Buxton Airbnb Guest Demographics & Profile Analysis (2026)
Guest Profile Summary for Buxton
- The typical guest profile for Airbnb in Buxton consists of primarily domestic travelers (96%), often arriving from nearby Raleigh, typically belonging to the Post-2000s (Gen Z/Alpha) group (50%), primarily speaking English or Spanish.
- Domestic travelers account for 95.5% of guests.
- Key international markets include United States (95.5%) and DC (1.7%).
- Top languages spoken are English (70%) followed by Spanish (11.4%).
- A significant demographic segment is the Post-2000s (Gen Z/Alpha) group, representing 50% of guests.
Recommendations for Hosts
- Target domestic marketing efforts towards travelers from Raleigh and Richmond.
- Tailor amenities and listing descriptions to appeal to the dominant Post-2000s (Gen Z/Alpha) demographic (e.g., highlight fast WiFi, smart home features, local guides).
- Highlight unique local experiences or amenities relevant to the primary guest profile.
- Consider seasonal promotions aligned with peak travel times for key origin markets.
Nearby Short-Term Rental Market Comparison
How does the Buxton Airbnb market stack up against its neighbors? Compare key performance metrics like average monthly revenue, ADR, and occupancy rates in surrounding areas to understand the broader regional STR landscape.
| Market | Active Properties | Monthly Revenue | Daily Rate | Avg. Occupancy |
|---|---|---|---|---|
| Corolla | 825 | $4,510 | $516.43 | 40% |
| Salvo | 86 | $4,421 | $483.32 | 41% |
| Duck | 272 | $4,416 | $452.93 | 43% |
| Southern Shores | 176 | $4,215 | $449.48 | 45% |
| Nags Head | 835 | $4,193 | $436.54 | 42% |
| Rodanthe | 150 | $4,053 | $422.32 | 39% |
| Kitty Hawk | 402 | $3,411 | $349.29 | 45% |
| Currituck County | 42 | $3,378 | $534.89 | 42% |
| Indian Beach | 21 | $3,313 | $409.16 | 33% |
| Salter Path | 19 | $3,285 | $317.09 | 46% |