Banner Elk Airbnb Market Analysis 2026: Short Term Rental Data & Vacation Rental Statistics in North Carolina, United States
Is Airbnb profitable in Banner Elk in 2026? Explore comprehensive Airbnb analytics for Banner Elk, North Carolina, United States to uncover income potential. This 2026 STR market report for Banner Elk, based on AirROI data from February 2025 to January 2026, reveals key trends in the market of 503 active listings.
Whether you're considering an Airbnb investment in Banner Elk, optimizing your existing vacation rental, or exploring rental arbitrage opportunities, understanding the Banner Elk Airbnb data is crucial. Leveraging the low regulation environment is key to maximizing your short term rental income potential. Let's dive into the specifics.
Key Banner Elk Airbnb Performance Metrics Overview
Monthly Airbnb Revenue Variations & Income Potential in Banner Elk (2026)
Understanding the monthly revenue variations for Airbnb listings in Banner Elk is key to maximizing your short term rental income potential. Seasonality significantly impacts earnings. Our analysis, based on data from the past 12 months, shows that the peak revenue month for STRs in Banner Elk is typically December, while April often presents the lowest earnings, highlighting opportunities for strategic pricing adjustments during shoulder and low seasons. Explore the typical Airbnb income in Banner Elk across different performance tiers:
- Best-in-class properties (Top 10%) achieve $8,407+ monthly, often utilizing dynamic pricing and superior guest experiences.
- Strong performing properties (Top 25%) earn $4,965 or more, indicating effective management and desirable locations/amenities.
- Typical properties (Median) generate around $2,853 per month, representing the average market performance.
- Entry-level properties (Bottom 25%) see earnings around $1,555, often with potential for optimization.
Average Monthly Airbnb Earnings Trend in Banner Elk
Banner Elk Airbnb Occupancy Rate Trends (2026)
Maximize your bookings by understanding the Banner Elk STR occupancy trends. Seasonal demand shifts significantly influence how often properties are booked. Typically, Julysees the highest demand (peak season occupancy), while April experiences the lowest (low season). Effective strategies, like adjusting minimum stays or offering promotions, can boost occupancy during slower periods. Here's how different property tiers perform in Banner Elk:
- Best-in-class properties (Top 10%) achieve 67%+ occupancy, indicating high desirability and potentially optimized availability.
- Strong performing properties (Top 25%) maintain 50% or higher occupancy, suggesting good market fit and guest satisfaction.
- Typical properties (Median) have an occupancy rate around 32%.
- Entry-level properties (Bottom 25%) average 17% occupancy, potentially facing higher vacancy.
Average Monthly Occupancy Rate Trend in Banner Elk
Average Daily Rate (ADR) Airbnb Trends in Banner Elk (2026)
Effective short term rental pricing strategy in Banner Elk involves understanding monthly ADR fluctuations. The Average Daily Rate (ADR) for Airbnb in Banner Elk typically peaks in December and dips lowest during April. Leveraging Airbnb dynamic pricing tools or strategies based on this seasonality can significantly boost revenue. Here's a look at the typical nightly rates achieved:
- Best-in-class properties (Top 10%) command rates of $681+ per night, often due to premium features or locations.
- Strong performing properties (Top 25%) achieve nightly rates of $469 or more.
- Typical properties (Median) charge around $303 per night.
- Entry-level properties (Bottom 25%) earn around $199 per night.
Average Daily Rate (ADR) Trend by Month in Banner Elk
Get Live Banner Elk Market Intelligence 👇

Explore Real-time Analytics
Airbnb Seasonality Analysis & Trends in Banner Elk (2026)
Peak Season (December, October, July)
- Revenue averages $5,337 per month
- Occupancy rates average 41.9%
- Daily rates average $418
Shoulder Season
- Revenue averages $3,883 per month
- Occupancy maintains around 34.9%
- Daily rates hold near $387
Low Season (March, April, May)
- Revenue drops to average $2,867 per month
- Occupancy decreases to average 29.3%
- Daily rates adjust to average $330
Seasonality Insights for Banner Elk
- The Airbnb seasonality in Banner Elk shows highly seasonal trends requiring careful strategy. While the sections above show seasonal averages, it's also insightful to look at the extremes:
- During the high season, the absolute peak month showcases Banner Elk's highest earning potential, with monthly revenues capable of climbing to $5,863, occupancy reaching a high of 43.6%, and ADRs peaking at $460.
- Conversely, the slowest single month of the year, typically falling within the low season, marks the market's lowest point. In this month, revenue might dip to $2,627, occupancy could drop to 28.6%, and ADRs may adjust down to $319.
- Understanding both the seasonal averages and these monthly peaks and troughs in revenue, occupancy, and ADR is crucial for maximizing your Airbnb profit potential in Banner Elk.
Seasonal Strategies for Maximizing Profit
- Peak Season: Maximize revenue through premium pricing and potentially longer minimum stays. Ensure high availability.
- Low Season: Offer competitive pricing, special promotions (e.g., extended stay discounts), and flexible cancellation policies. Target off-season travelers like remote workers or budget-conscious guests.
- Shoulder Seasons: Implement dynamic pricing that balances peak and low rates. Target weekend travelers or specific events. Offer slightly more flexible terms than peak season.
- Regularly analyze your own performance against these Banner Elk seasonality benchmarks and adjust your pricing and availability strategy accordingly.
Best Areas for Airbnb Investment in Banner Elk (2026)
Exploring the top neighborhoods for short-term rentals in Banner Elk? This section highlights key areas, outlining why they are attractive for hosts and guests, along with notable local attractions. Consider these locations based on your target guest profile and investment strategy.
| Neighborhood / Area | Why Host Here? (Target Guests & Appeal) | Key Attractions & Landmarks |
|---|---|---|
| Sugar Mountain | Attracts visitors year-round for skiing in winter and hiking in summer. The resort community offers stunning views and outdoor activities, making it ideal for vacation rentals. | Sugar Mountain Resort, Beech Mountain Resort, Linville Falls, Grandfather Mountain, Hiking Trails |
| Linville | A scenic area known for its natural beauty with access to Linville Gorge and Linville Falls. Appeals to nature lovers and those looking for a tranquil getaway. | Linville Gorge, Linville Falls, Grandfather Mountain, Blue Ridge Parkway, Hiking Trails |
| Banner Elk | The town itself features charming shops and restaurants and is centrally located for access to nearby ski resorts and outdoor activities. Great for family vacations. | Banner Elk Winery and Villa, Valle Crucis Park, Hiking Trails, Local Restaurants, Banner Elk Stables |
| Beech Mountain | Another top ski destination in the area, attracts both winter sports enthusiasts and summer travelers with its mountain views and outdoor activities. | Beech Mountain Resort, Skiing and Snowboarding, Hiking Trails, Beech Mountain Brewery, Summer Concerts |
| Vil as de la Costa | A unique destination known for beautiful landscapes and outdoor adventures. Peaceful atmosphere attracts those looking to escape the hustle and bustle. | Watauga Lake, Boone Fork Trail, Mountain Biking Trails, Fishing Expeditions, Scenic Drives |
| Boone | Nearby college town with vibrant culture, dining, and shopping. Attracts families and college visitors, especially during major university events. | Appalachian State University, Hickory Ridge Living History Museum, Howard Knob County Park, Local Shopping and Dining, Outdoor Festivals |
| Blowing Rock | Famous for its picturesque views and outdoor activities, a charming town that enhances the tourism appeal of the area. | Blowing Rock Attraction, Blue Ridge Parkway, Moses H. Cone Memorial Park, Shopping and Dining, Outdoor Sports |
| Grandfather Mountain | A popular tourist attraction known for its natural beauty, hiking trails, and wildlife habitat, ideal for nature-loving travelers. | Grandfather Mountain State Park, Mile High Swinging Bridge, Wildlife Habitats, Scenic Views, Hiking Trails |
Understanding Airbnb License Requirements & STR Laws in Banner Elk (2026)
While Banner Elk, North Carolina, United States currently shows low STR regulations, specific Airbnb license requirements might still exist or change. Always verify the latest short term rental regulations and Airbnb license requirements directly with local government authorities for Banner Elk to ensure full compliance before hosting.
(Source: AirROI data, 2026, finding no licensed listings among those analyzed)
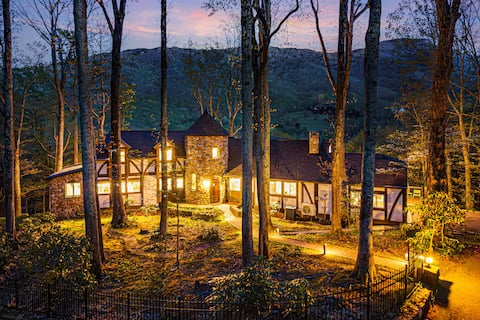
Top Performing Airbnb Properties in Banner Elk (2026)
Benchmark your potential! Explore examples of top-performing Airbnb properties in Banner Elkbased on Trailing Twelve Month (TTM) revenue. Analyze their characteristics, revenue, occupancy rate, and ADR to understand what drives success in this market.

Luxury Home for 26| 18 Acres| 2 Great Rms| Hot Tub
Entire Place • 7 bedrooms
Hidden Castle: Secret Rooms~Hot Tub~Sleeps 20
Entire Place • 7 bedrooms
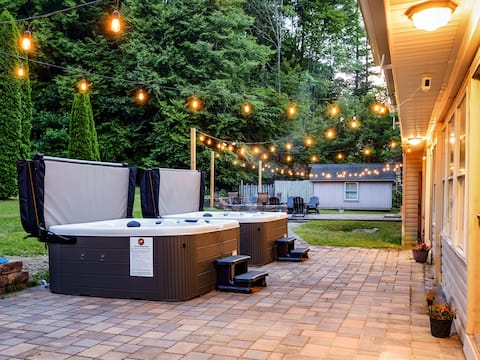
2 Hot Tubs, Pool, Fire Pit, 9 Bathrooms, Sleeps 25
Entire Place • 9 bedrooms
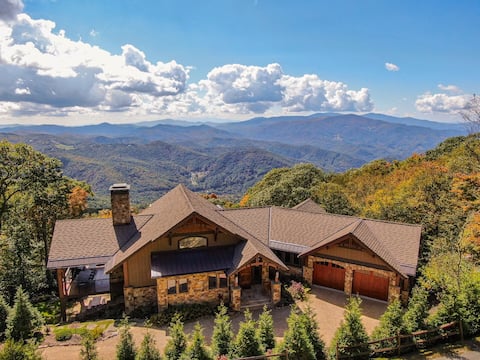
Heavenly Daze - Custom Home 180* 10 Mile Views
Entire Place • 6 bedrooms

Snow Time,KidsPlay,GlowRm,Pet,HotTub,Lux Amenities
Entire Place • 5 bedrooms

Stunning Cabin | Mtn Views | Fireplace | Game Room
Entire Place �• 6 bedrooms
Note: Performance varies based on location, size, amenities, seasonality, and management quality. Data reflects the past 12 months.
Top Performing Airbnb Hosts in Banner Elk (2026)
Learn from the best! This table showcases top-performing Airbnb hosts in Banner Elk based on the number of properties managed and estimated total revenue over the past year. Analyze their scale and performance metrics.
| Host Name | Properties | Grossing Revenue | Stay Reviews | Avg Rating |
|---|---|---|---|---|
| Blue Ridge Mountain Rentals | 123 | $4,471,287 | 1039 | 4.81/5.0 |
| Carolina Cabin Rentals | 63 | $2,019,626 | 787 | 4.67/5.0 |
| Kim | 2 | $452,202 | 120 | 4.99/5.0 |
| Evolve | 16 | $440,238 | 467 | 4.81/5.0 |
| Brian | 2 | $404,152 | 88 | 4.96/5.0 |
| Kapil | 2 | $314,665 | 102 | 5.00/5.0 |
| Todd | 4 | $281,114 | 252 | 4.91/5.0 |
| Bill | 2 | $270,174 | 171 | 4.92/5.0 |
| Dave | 2 | $224,025 | 172 | 4.99/5.0 |
| John | 3 | $217,697 | 351 | 4.89/5.0 |
Analyzing the strategies of top hosts, such as their property selection, pricing, and guest communication, can offer valuable lessons for optimizing your own Airbnb operations in Banner Elk.
Dive Deeper: Advanced Banner Elk STR Market Data (2026)
Ready to unlock more insights? AirROI provides access to advanced metrics and comprehensive Airbnb data for Banner Elk. Explore detailed analytics beyond this report to refine your investment strategy, optimize pricing, and maximize your vacation rental profits.
Explore Advanced MetricsBanner Elk Short-Term Rental Market Composition (2026): Property & Room Types
Room Type Distribution
Property Type Distribution
Market Composition Insights for Banner Elk
- The Banner Elk Airbnb market composition is heavily skewed towards Entire Home/Apt listings, which make up 98.4% of the 503 active rentals. This indicates strong guest preference for privacy and space.
- Looking at the property type distribution in Banner Elk, House properties are the most common (50.1%), reflecting the local real estate landscape.
- Houses represent a significant 50.1% portion, catering likely to families or larger groups.
- Smaller segments like others, unique stays, hotel/boutique (combined 2.2%) offer potential for unique stay experiences.
Banner Elk Airbnb Room Capacity Analysis (2026): Bedroom Distribution
Distribution of Listings by Number of Bedrooms
Room Capacity Insights for Banner Elk
- The dominant room capacity in Banner Elk is 3 bedrooms listings, making up 31% of the market. This suggests a strong demand for properties suitable for families or small groups.
- Together, 3 bedrooms and 2 bedrooms properties represent 55.3% of the active Airbnb listings in Banner Elk, indicating a high concentration in these sizes.
- A significant 60.8% of listings offer 3+ bedrooms, catering to larger groups and families seeking more space in Banner Elk.
Banner Elk Vacation Rental Guest Capacity Trends (2026)
Distribution of Listings by Guest Capacity
Guest Capacity Insights for Banner Elk
- The most common guest capacity trend in Banner Elk vacation rentals is listings accommodating 8+ guests (49.1%). This suggests the primary traveler segment is likely larger groups.
- Properties designed for 8+ guests and 6 guests dominate the Banner Elk STR market, accounting for 67.2% of listings.
- 71.4% of properties accommodate 6+ guests, serving the market segment for larger families or group travel in Banner Elk.
- On average, properties in Banner Elk are equipped to host 6.3 guests.
Banner Elk Airbnb Booking Patterns (2026): Available vs. Booked Days
Available Days Distribution
Booked Days Distribution
Booking Pattern Insights for Banner Elk
- The most common availability pattern in Banner Elk falls within the 271-366 days range, representing 57.5% of listings. This suggests many properties have significant open periods on their calendars.
- Approximately 89.3% of listings show high availability (181+ days open annually), indicating potential for increased bookings or specific owner usage patterns.
- For booked days, the 31-90 days range is most frequent in Banner Elk (39.6%), reflecting common guest stay durations or potential owner blocking patterns.
- A notable 11.5% of properties secure long booking periods (181+ days booked per year), highlighting successful long-term rental strategies or significant owner usage.
Banner Elk Airbnb Minimum Stay Requirements Analysis
Distribution of Listings by Minimum Night Requirement
1 Night
33 listings
6.6% of total
2 Nights
183 listings
36.4% of total
3 Nights
27 listings
5.4% of total
4-6 Nights
4 listings
0.8% of total
7-29 Nights
10 listings
2% of total
30+ Nights
246 listings
48.9% of total
Key Insights
- The most prevalent minimum stay requirement in Banner Elk is 30+ Nights, adopted by 48.9% of listings. This highlights the market's preference for longer commitments.
- A significant segment (48.9%) caters to monthly stays (30+ nights) in Banner Elk, pointing to opportunities in the extended-stay market.
Recommendations
- Align with the market by considering a 30+ Nights minimum stay, as 48.9% of Banner Elk hosts use this setting.
- If feasible, allowing 1-night stays, especially midweek or during low season, could capture last-minute bookings, as only 6.6% currently do.
- A 2-night minimum appears standard (36.4%). Consider this for weekends or peak periods.
- Explore offering discounts for stays of 30+ nights to attract the 48.9% of the market seeking extended stays.
- Adjust minimum nights based on seasonality – potentially shorter during low season and longer during peak demand periods in Banner Elk.
Banner Elk Airbnb Cancellation Policy Trends Analysis (2026)
Super Strict 60 Days
119 listings
23.7% of total
Super Strict 30 Days
33 listings
6.6% of total
Limited
7 listings
1.4% of total
Flexible
18 listings
3.6% of total
Moderate
76 listings
15.1% of total
Firm
206 listings
41% of total
Strict
43 listings
8.6% of total
Cancellation Policy Insights for Banner Elk
- The prevailing Airbnb cancellation policy trend in Banner Elk is Firm, used by 41% of listings.
- There's a relatively balanced mix between guest-friendly (18.7%) and stricter (49.6%) policies, offering choices for different guest needs.
- Strict cancellation policies are quite rare (8.6%), potentially making listings with this policy less competitive unless justified by high demand or property type.
Recommendations for Hosts
- Consider adopting a Firm policy to align with the 41% market standard in Banner Elk.
- Using a Strict policy might deter some guests, as only 8.6% of listings use it. Evaluate if potential revenue protection outweighs possible lower booking rates.
- Regularly review your cancellation policy against competitors and market demand shifts in Banner Elk.
Banner Elk STR Booking Lead Time Analysis (2026)
Average Booking Lead Time by Month
Booking Lead Time Insights for Banner Elk
- The overall average booking lead time for vacation rentals in Banner Elk is 58 days.
- Guests book furthest in advance for stays during October (average 83 days), likely coinciding with peak travel demand or local events.
- The shortest booking windows occur for stays in March (average 32 days), indicating more last-minute travel plans during this time.
- Seasonally, Fall (69 days avg.) sees the longest lead times, while Spring (49 days avg.) has the shortest, reflecting typical travel planning cycles.
Recommendations for Hosts
- Use the overall average lead time (58 days) as a baseline for your pricing and availability strategy in Banner Elk.
- For October stays, consider implementing length-of-stay discounts or slightly higher rates for bookings made less than 83 days out to capitalize on advance planning.
- Target marketing efforts for the Fall season well in advance (at least 69 days) to capture early planners.
- Monitor your own booking lead times against these Banner Elk averages to identify opportunities for dynamic pricing adjustments.
Popular & Essential Airbnb Amenities in Banner Elk (2026)
Amenity Prevalence
Amenity Insights for Banner Elk
- Essential amenities in Banner Elk that guests expect include: Wifi, TV, Heating, Microwave, Coffee maker, Dishes and silverware, Refrigerator, Free parking on premises, Kitchen, Smoke alarm. Lacking these (any) could significantly impact bookings.
Recommendations for Hosts
- Ensure your listing includes all essential amenities for Banner Elk: Wifi, TV, Heating, Microwave, Coffee maker, Dishes and silverware, Refrigerator, Free parking on premises, Kitchen, Smoke alarm.
- Prioritize adding missing essentials: Wifi, TV, Heating, Microwave, Coffee maker, Dishes and silverware, Refrigerator, Free parking on premises, Kitchen, Smoke alarm.
- Highlight unique or less common amenities you offer (e.g., hot tub, dedicated workspace, EV charger) in your listing description and photos.
- Regularly check competitor amenities in Banner Elk to stay competitive.
Banner Elk Airbnb Guest Demographics & Profile Analysis (2026)
Guest Profile Summary for Banner Elk
- The typical guest profile for Airbnb in Banner Elk consists of primarily domestic travelers (99%), often arriving from nearby Charlotte, typically belonging to the Post-2000s (Gen Z/Alpha) group (50%), primarily speaking English or Spanish.
- Domestic travelers account for 98.5% of guests.
- Key international markets include United States (98.5%) and DC (0.4%).
- Top languages spoken are English (76.6%) followed by Spanish (12.2%).
- A significant demographic segment is the Post-2000s (Gen Z/Alpha) group, representing 50% of guests.
Recommendations for Hosts
- Target domestic marketing efforts towards travelers from Charlotte and Raleigh.
- Tailor amenities and listing descriptions to appeal to the dominant Post-2000s (Gen Z/Alpha) demographic (e.g., highlight fast WiFi, smart home features, local guides).
- Highlight unique local experiences or amenities relevant to the primary guest profile.
- Consider seasonal promotions aligned with peak travel times for key origin markets.
Nearby Short-Term Rental Market Comparison
How does the Banner Elk Airbnb market stack up against its neighbors? Compare key performance metrics like average monthly revenue, ADR, and occupancy rates in surrounding areas to understand the broader regional STR landscape.
| Market | Active Properties | Monthly Revenue | Daily Rate | Avg. Occupancy |
|---|---|---|---|---|
| Denver | 109 | $6,309 | $590.96 | 45% |
| Catawba | 16 | $6,093 | $582.49 | 38% |
| Mooresville | 369 | $5,702 | $559.93 | 42% |
| Sherrills Ford | 107 | $5,615 | $547.26 | 41% |
| Troutman | 49 | $5,587 | $467.90 | 42% |
| Lake Norman of Catawba | 51 | $4,972 | $513.30 | 43% |
| Union Mills | 15 | $4,938 | $442.76 | 41% |
| Blacksburg | 297 | $4,116 | $509.14 | 40% |
| Fletcher | 113 | $3,859 | $333.95 | 46% |
| Buncombe County | 13 | $3,849 | $317.20 | 45% |