Bald Head Island Airbnb Market Analysis 2026: Short Term Rental Data & Vacation Rental Statistics in North Carolina, United States
Is Airbnb profitable in Bald Head Island in 2026? Explore comprehensive Airbnb analytics for Bald Head Island, North Carolina, United States to uncover income potential. This 2026 STR market report for Bald Head Island, based on AirROI data from February 2025 to January 2026, reveals key trends in the market of 207 active listings.
Whether you're considering an Airbnb investment in Bald Head Island, optimizing your existing vacation rental, or exploring rental arbitrage opportunities, understanding the Bald Head Island Airbnb data is crucial. Leveraging the low regulation environment is key to maximizing your short term rental income potential. Let's dive into the specifics.
Key Bald Head Island Airbnb Performance Metrics Overview
Monthly Airbnb Revenue Variations & Income Potential in Bald Head Island (2026)
Understanding the monthly revenue variations for Airbnb listings in Bald Head Island is key to maximizing your short term rental income potential. Seasonality significantly impacts earnings. Our analysis, based on data from the past 12 months, shows that the peak revenue month for STRs in Bald Head Island is typically July, while February often presents the lowest earnings, highlighting opportunities for strategic pricing adjustments during shoulder and low seasons. Explore the typical Airbnb income in Bald Head Island across different performance tiers:
- Best-in-class properties (Top 10%) achieve $12,318+ monthly, often utilizing dynamic pricing and superior guest experiences.
- Strong performing properties (Top 25%) earn $8,774 or more, indicating effective management and desirable locations/amenities.
- Typical properties (Median) generate around $5,367 per month, representing the average market performance.
- Entry-level properties (Bottom 25%) see earnings around $2,750, often with potential for optimization.
Average Monthly Airbnb Earnings Trend in Bald Head Island
Bald Head Island Airbnb Occupancy Rate Trends (2026)
Maximize your bookings by understanding the Bald Head Island STR occupancy trends. Seasonal demand shifts significantly influence how often properties are booked. Typically, Julysees the highest demand (peak season occupancy), while January experiences the lowest (low season). Effective strategies, like adjusting minimum stays or offering promotions, can boost occupancy during slower periods. Here's how different property tiers perform in Bald Head Island:
- Best-in-class properties (Top 10%) achieve 63%+ occupancy, indicating high desirability and potentially optimized availability.
- Strong performing properties (Top 25%) maintain 50% or higher occupancy, suggesting good market fit and guest satisfaction.
- Typical properties (Median) have an occupancy rate around 30%.
- Entry-level properties (Bottom 25%) average 16% occupancy, potentially facing higher vacancy.
Average Monthly Occupancy Rate Trend in Bald Head Island
Average Daily Rate (ADR) Airbnb Trends in Bald Head Island (2026)
Effective short term rental pricing strategy in Bald Head Island involves understanding monthly ADR fluctuations. The Average Daily Rate (ADR) for Airbnb in Bald Head Island typically peaks in July and dips lowest during February. Leveraging Airbnb dynamic pricing tools or strategies based on this seasonality can significantly boost revenue. Here's a look at the typical nightly rates achieved:
- Best-in-class properties (Top 10%) command rates of $911+ per night, often due to premium features or locations.
- Strong performing properties (Top 25%) achieve nightly rates of $715 or more.
- Typical properties (Median) charge around $548 per night.
- Entry-level properties (Bottom 25%) earn around $446 per night.
Average Daily Rate (ADR) Trend by Month in Bald Head Island
Get Live Bald Head Island Market Intelligence 👇

Explore Real-time Analytics
Airbnb Seasonality Analysis & Trends in Bald Head Island (2026)
Peak Season (July, June, August)
- Revenue averages $10,942 per month
- Occupancy rates average 48.3%
- Daily rates average $662
Shoulder Season
- Revenue averages $5,839 per month
- Occupancy maintains around 34.8%
- Daily rates hold near $588
Low Season (January, February, December)
- Revenue drops to average $2,699 per month
- Occupancy decreases to average 17.7%
- Daily rates adjust to average $578
Seasonality Insights for Bald Head Island
- The Airbnb seasonality in Bald Head Island shows highly seasonal trends requiring careful strategy. While the sections above show seasonal averages, it's also insightful to look at the extremes:
- During the high season, the absolute peak month showcases Bald Head Island's highest earning potential, with monthly revenues capable of climbing to $12,089, occupancy reaching a high of 48.6%, and ADRs peaking at $669.
- Conversely, the slowest single month of the year, typically falling within the low season, marks the market's lowest point. In this month, revenue might dip to $2,256, occupancy could drop to 13.5%, and ADRs may adjust down to $487.
- Understanding both the seasonal averages and these monthly peaks and troughs in revenue, occupancy, and ADR is crucial for maximizing your Airbnb profit potential in Bald Head Island.
Seasonal Strategies for Maximizing Profit
- Peak Season: Maximize revenue through premium pricing and potentially longer minimum stays. Ensure high availability.
- Low Season: Offer competitive pricing, special promotions (e.g., extended stay discounts), and flexible cancellation policies. Target off-season travelers like remote workers or budget-conscious guests.
- Shoulder Seasons: Implement dynamic pricing that balances peak and low rates. Target weekend travelers or specific events. Offer slightly more flexible terms than peak season.
- Regularly analyze your own performance against these Bald Head Island seasonality benchmarks and adjust your pricing and availability strategy accordingly.
Best Areas for Airbnb Investment in Bald Head Island (2026)
Exploring the top neighborhoods for short-term rentals in Bald Head Island? This section highlights key areas, outlining why they are attractive for hosts and guests, along with notable local attractions. Consider these locations based on your target guest profile and investment strategy.
| Neighborhood / Area | Why Host Here? (Target Guests & Appeal) | Key Attractions & Landmarks |
|---|---|---|
| South Beach | Beautiful beachfront area ideal for vacation rentals, attracting tourists who want sun, sand, and nightlife. | Bald Head Lighthouse, East Beach, Old Baldy Lighthouse, Marsh Walk, The Cove |
| Middle Island | Quieter residential area offering proximity to natural landscapes and local wildlife, perfect for family retreats. | Bald Head Island Conservancy, Cape Fear River, Nature trails, Golf Club, South Beach |
| East Beach | Popular for its family-friendly atmosphere and scenic views, making it a prime spot for vacation rentals. | East Beach access, Biking routes, Kayaking, Sand dunes, Sunset views |
| West Beach | Offers beautiful sunsets and a calm environment, appealing to guests looking for relaxation and tranquility. | West Beach access, Fishing opportunities, Nature trails, Scenic views |
| Cape Fear Station | Unique area close to the ferry terminal, appealing for those wanting convenience with access to amenities. | Cape Fear Marina, Historic sites, Local shops and dining, Nature trails |
| The Commons | Community-oriented area with a mix of residential houses and vacation rentals, perfect for family gatherings. | Community pool, Parks and playgrounds, Biking trails, Marketplace |
| Harbor Village | Vibrant hub of entertainment and dining, ideal for travelers looking for an active vacation experience. | Local eateries, Shopping, Water sports, Marina area |
| Bald Head Island Marina | Convenient access point for water activities like fishing and boating, this spot attracts adventure seekers. | Boat rentals, Fishing charters, Water sports, Wildlife watching |
Understanding Airbnb License Requirements & STR Laws in Bald Head Island (2026)
While Bald Head Island, North Carolina, United States currently shows low STR regulations, specific Airbnb license requirements might still exist or change. Always verify the latest short term rental regulations and Airbnb license requirements directly with local government authorities for Bald Head Island to ensure full compliance before hosting.
(Source: AirROI data, 2026, finding no licensed listings among those analyzed)
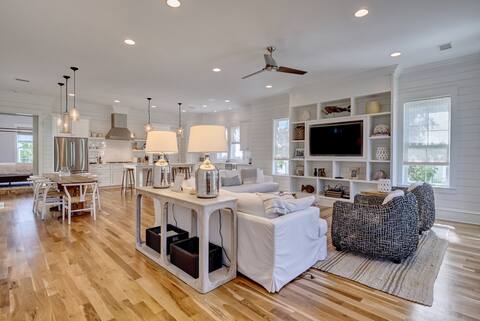
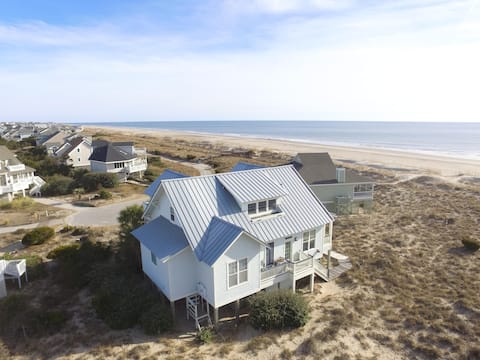
Top Performing Airbnb Properties in Bald Head Island (2026)
Benchmark your potential! Explore examples of top-performing Airbnb properties in Bald Head Islandbased on Trailing Twelve Month (TTM) revenue. Analyze their characteristics, revenue, occupancy rate, and ADR to understand what drives success in this market.

Chic Shellter
Entire Place • 5 bedrooms

New BHI Home • 3 Suites • Clubs • Kayaks •
Entire Place • 4 bedrooms

Oceanfront Oasis- Beachfront, Dog Friendly
Entire Place • 5 bedrooms

Luxury Home with Private Saltwater Pool BHI and Sh
Entire Place • 5 bedrooms
Southern Living home steps from East Beach!
Entire Place • 4 bedrooms
Come Back Home Oceanfront 5 Br 4 Ba 5 Star Ameniti
Entire Place • 5 bedrooms
Note: Performance varies based on location, size, amenities, seasonality, and management quality. Data reflects the past 12 months.
Top Performing Airbnb Hosts in Bald Head Island (2026)
Learn from the best! This table showcases top-performing Airbnb hosts in Bald Head Island based on the number of properties managed and estimated total revenue over the past year. Analyze their scale and performance metrics.
| Host Name | Properties | Grossing Revenue | Stay Reviews | Avg Rating |
|---|---|---|---|---|
| Bald Head Island Services | 109 | $4,156,783 | 743 | 4.79/5.0 |
| Tyler | 27 | $1,657,875 | 135 | 4.97/5.0 |
| Lindsey | 20 | $1,056,018 | 175 | 4.91/5.0 |
| ITrip NC Beaches | 15 | $751,554 | 118 | 4.77/5.0 |
| Stefanie | 2 | $209,141 | 57 | 5.00/5.0 |
| Hooper | 1 | $168,154 | 13 | 5.00/5.0 |
| Sebrell | 1 | $152,509 | 124 | 4.80/5.0 |
| Richard | 1 | $142,903 | 37 | 4.81/5.0 |
| Ainsley | 1 | $110,613 | 74 | 4.85/5.0 |
| Sarah | 1 | $108,540 | 5 | 5.00/5.0 |
Analyzing the strategies of top hosts, such as their property selection, pricing, and guest communication, can offer valuable lessons for optimizing your own Airbnb operations in Bald Head Island.
Dive Deeper: Advanced Bald Head Island STR Market Data (2026)
Ready to unlock more insights? AirROI provides access to advanced metrics and comprehensive Airbnb data for Bald Head Island. Explore detailed analytics beyond this report to refine your investment strategy, optimize pricing, and maximize your vacation rental profits.
Explore Advanced MetricsBald Head Island Short-Term Rental Market Composition (2026): Property & Room Types
Room Type Distribution
Property Type Distribution
Market Composition Insights for Bald Head Island
- The Bald Head Island Airbnb market composition is heavily skewed towards Entire Home/Apt listings, which make up 97.1% of the 207 active rentals. This indicates strong guest preference for privacy and space.
- Looking at the property type distribution in Bald Head Island, House properties are the most common (91.3%), reflecting the local real estate landscape.
- Houses represent a significant 91.3% portion, catering likely to families or larger groups.
- Smaller segments like hotel/boutique, outdoor/unique (combined 3.4%) offer potential for unique stay experiences.
Bald Head Island Airbnb Room Capacity Analysis (2026): Bedroom Distribution
Distribution of Listings by Number of Bedrooms
Room Capacity Insights for Bald Head Island
- The dominant room capacity in Bald Head Island is 3 bedrooms listings, making up 37.7% of the market. This suggests a strong demand for properties suitable for families or small groups.
- Together, 3 bedrooms and 4 bedrooms properties represent 70.6% of the active Airbnb listings in Bald Head Island, indicating a high concentration in these sizes.
- A significant 87.5% of listings offer 3+ bedrooms, catering to larger groups and families seeking more space in Bald Head Island.
Bald Head Island Vacation Rental Guest Capacity Trends (2026)
Distribution of Listings by Guest Capacity
Guest Capacity Insights for Bald Head Island
- The most common guest capacity trend in Bald Head Island vacation rentals is listings accommodating 8+ guests (73.9%). This suggests the primary traveler segment is likely larger groups.
- Properties designed for 8+ guests and 6 guests dominate the Bald Head Island STR market, accounting for 87.9% of listings.
- 91.8% of properties accommodate 6+ guests, serving the market segment for larger families or group travel in Bald Head Island.
- On average, properties in Bald Head Island are equipped to host 7.3 guests.
Bald Head Island Airbnb Booking Patterns (2026): Available vs. Booked Days
Available Days Distribution
Booked Days Distribution
Booking Pattern Insights for Bald Head Island
- The most common availability pattern in Bald Head Island falls within the 271-366 days range, representing 65.7% of listings. This suggests many properties have significant open periods on their calendars.
- Approximately 91.8% of listings show high availability (181+ days open annually), indicating potential for increased bookings or specific owner usage patterns.
- For booked days, the 31-90 days range is most frequent in Bald Head Island (42.5%), reflecting common guest stay durations or potential owner blocking patterns.
- A notable 8.7% of properties secure long booking periods (181+ days booked per year), highlighting successful long-term rental strategies or significant owner usage.
Bald Head Island Airbnb Minimum Stay Requirements Analysis
Distribution of Listings by Minimum Night Requirement
1 Night
3 listings
1.4% of total
2 Nights
3 listings
1.4% of total
3 Nights
24 listings
11.6% of total
4-6 Nights
12 listings
5.8% of total
30+ Nights
165 listings
79.7% of total
Key Insights
- The most prevalent minimum stay requirement in Bald Head Island is 30+ Nights, adopted by 79.7% of listings. This highlights the market's preference for longer commitments.
- Very short stays (1-2 nights) are less common (2.8%), suggesting hosts prefer slightly longer bookings to optimize turnover.
- A significant segment (79.7%) caters to monthly stays (30+ nights) in Bald Head Island, pointing to opportunities in the extended-stay market.
Recommendations
- Align with the market by considering a 30+ Nights minimum stay, as 79.7% of Bald Head Island hosts use this setting.
- If feasible, allowing 1-night stays, especially midweek or during low season, could capture last-minute bookings, as only 1.4% currently do.
- Explore offering discounts for stays of 30+ nights to attract the 79.7% of the market seeking extended stays.
- Adjust minimum nights based on seasonality – potentially shorter during low season and longer during peak demand periods in Bald Head Island.
Bald Head Island Airbnb Cancellation Policy Trends Analysis (2026)
Super Strict 30 Days
1 listings
0.5% of total
Super Strict 60 Days
171 listings
82.6% of total
Limited
1 listings
0.5% of total
Moderate
2 listings
1% of total
Firm
24 listings
11.6% of total
Strict
8 listings
3.9% of total
Cancellation Policy Insights for Bald Head Island
- The prevailing Airbnb cancellation policy trend in Bald Head Island is Super Strict 60 Days, used by 82.6% of listings.
- There's a relatively balanced mix between guest-friendly (1.0%) and stricter (15.5%) policies, offering choices for different guest needs.
- Strict cancellation policies are quite rare (3.9%), potentially making listings with this policy less competitive unless justified by high demand or property type.
Recommendations for Hosts
- Consider adopting a Super Strict 60 Days policy to align with the 82.6% market standard in Bald Head Island.
- Using a Strict policy might deter some guests, as only 3.9% of listings use it. Evaluate if potential revenue protection outweighs possible lower booking rates.
- Regularly review your cancellation policy against competitors and market demand shifts in Bald Head Island.
Bald Head Island STR Booking Lead Time Analysis (2026)
Average Booking Lead Time by Month
Booking Lead Time Insights for Bald Head Island
- The overall average booking lead time for vacation rentals in Bald Head Island is 87 days.
- Guests book furthest in advance for stays during May (average 119 days), likely coinciding with peak travel demand or local events.
- The shortest booking windows occur for stays in February (average 22 days), indicating more last-minute travel plans during this time.
- Seasonally, Summer (105 days avg.) sees the longest lead times, while Winter (37 days avg.) has the shortest, reflecting typical travel planning cycles.
Recommendations for Hosts
- Use the overall average lead time (87 days) as a baseline for your pricing and availability strategy in Bald Head Island.
- For May stays, consider implementing length-of-stay discounts or slightly higher rates for bookings made less than 119 days out to capitalize on advance planning.
- Target marketing efforts for the Summer season well in advance (at least 105 days) to capture early planners.
- Monitor your own booking lead times against these Bald Head Island averages to identify opportunities for dynamic pricing adjustments.
Popular & Essential Airbnb Amenities in Bald Head Island (2026)
Amenity Prevalence
Amenity Insights for Bald Head Island
- Essential amenities in Bald Head Island that guests expect include: Wifi, Air conditioning, Washer. Lacking these (any) could significantly impact bookings.
- Popular amenities like Kitchen, Coffee maker, Heating are common but not universal. Offering these can provide a competitive edge.
Recommendations for Hosts
- Ensure your listing includes all essential amenities for Bald Head Island: Wifi, Air conditioning, Washer.
- Prioritize adding missing essentials: Wifi, Air conditioning, Washer.
- Consider adding popular differentiators like Kitchen or Coffee maker to increase appeal.
- Highlight unique or less common amenities you offer (e.g., hot tub, dedicated workspace, EV charger) in your listing description and photos.
- Regularly check competitor amenities in Bald Head Island to stay competitive.
Bald Head Island Airbnb Guest Demographics & Profile Analysis (2026)
Guest Profile Summary for Bald Head Island
- The typical guest profile for Airbnb in Bald Head Island consists of primarily domestic travelers (97%), often arriving from nearby Raleigh, typically belonging to the Post-2000s (Gen Z/Alpha) group (50%), primarily speaking English or Spanish.
- Domestic travelers account for 96.9% of guests.
- Key international markets include United States (96.9%) and DC (2.1%).
- Top languages spoken are English (78.2%) followed by Spanish (9.2%).
- A significant demographic segment is the Post-2000s (Gen Z/Alpha) group, representing 50% of guests.
Recommendations for Hosts
- Target domestic marketing efforts towards travelers from Raleigh and Wilmington.
- Tailor amenities and listing descriptions to appeal to the dominant Post-2000s (Gen Z/Alpha) demographic (e.g., highlight fast WiFi, smart home features, local guides).
- Highlight unique local experiences or amenities relevant to the primary guest profile.
- Consider seasonal promotions aligned with peak travel times for key origin markets.
Nearby Short-Term Rental Market Comparison
How does the Bald Head Island Airbnb market stack up against its neighbors? Compare key performance metrics like average monthly revenue, ADR, and occupancy rates in surrounding areas to understand the broader regional STR landscape.
| Market | Active Properties | Monthly Revenue | Daily Rate | Avg. Occupancy |
|---|---|---|---|---|
| Ocean Isle Beach | 508 | $5,018 | $610.93 | 38% |
| Wrightsville Beach | 497 | $4,620 | $531.11 | 39% |
| Kure Beach | 502 | $3,804 | $427.64 | 42% |
| Cedar Point | 30 | $3,725 | $310.88 | 49% |
| Emerald Isle | 510 | $3,693 | $392.93 | 42% |
| Surfside Beach | 474 | $3,680 | $391.70 | 42% |
| North Topsail Beach | 946 | $3,533 | $428.67 | 39% |
| Surf City | 737 | $3,518 | $389.38 | 39% |
| Caswell Beach | 50 | $3,498 | $430.69 | 41% |
| Oak Island | 1,407 | $3,413 | $448.06 | 39% |