Town of Onondaga Airbnb Market Analysis 2025: Short Term Rental Data & Vacation Rental Statistics in New York, United States
Is Airbnb profitable in Town of Onondaga in 2025? Explore comprehensive Airbnb analytics for Town of Onondaga, New York, United States to uncover income potential. This 2025 STR market report for Town of Onondaga, based on AirROI data from April 2024 to March 2025, reveals key trends in the niche market of 20 active listings.
Whether you're considering an Airbnb investment in Town of Onondaga, optimizing your existing vacation rental, or exploring rental arbitrage opportunities, understanding the Town of Onondaga Airbnb data is crucial. Leveraging the low regulation environment is key to maximizing your short term rental income potential. Let's dive into the specifics.
Key Town of Onondaga Airbnb Performance Metrics Overview
Monthly Airbnb Revenue Variations & Income Potential in Town of Onondaga (2025)
Understanding the monthly revenue variations for Airbnb listings in Town of Onondaga is key to maximizing your short term rental income potential. Seasonality significantly impacts earnings. Our analysis, based on data from the past 12 months, shows that the peak revenue month for STRs in Town of Onondaga is typically August, while February often presents the lowest earnings, highlighting opportunities for strategic pricing adjustments during shoulder and low seasons. Explore the typical Airbnb income in Town of Onondaga across different performance tiers:
- Best-in-class properties (Top 10%) achieve $8,554+ monthly, often utilizing dynamic pricing and superior guest experiences.
- Strong performing properties (Top 25%) earn $3,769 or more, indicating effective management and desirable locations/amenities.
- Typical properties (Median) generate around $1,958 per month, representing the average market performance.
- Entry-level properties (Bottom 25%) see earnings around $1,075, often with potential for optimization.
Average Monthly Airbnb Earnings Trend in Town of Onondaga
Town of Onondaga Airbnb Occupancy Rate Trends (2025)
Maximize your bookings by understanding the Town of Onondaga STR occupancy trends. Seasonal demand shifts significantly influence how often properties are booked. Typically, Augustsees the highest demand (peak season occupancy), while March experiences the lowest (low season). Effective strategies, like adjusting minimum stays or offering promotions, can boost occupancy during slower periods. Here's how different property tiers perform in Town of Onondaga:
- Best-in-class properties (Top 10%) achieve 72%+ occupancy, indicating high desirability and potentially optimized availability.
- Strong performing properties (Top 25%) maintain 58% or higher occupancy, suggesting good market fit and guest satisfaction.
- Typical properties (Median) have an occupancy rate around 33%.
- Entry-level properties (Bottom 25%) average 20% occupancy, potentially facing higher vacancy.
Average Monthly Occupancy Rate Trend in Town of Onondaga
Average Daily Rate (ADR) Airbnb Trends in Town of Onondaga (2025)
Effective short term rental pricing strategy in Town of Onondaga involves understanding monthly ADR fluctuations. The Average Daily Rate (ADR) for Airbnb in Town of Onondaga typically peaks in July and dips lowest during April. Leveraging Airbnb dynamic pricing tools or strategies based on this seasonality can significantly boost revenue. Here's a look at the typical nightly rates achieved:
- Best-in-class properties (Top 10%) command rates of $356+ per night, often due to premium features or locations.
- Strong performing properties (Top 25%) achieve nightly rates of $268 or more.
- Typical properties (Median) charge around $136 per night.
- Entry-level properties (Bottom 25%) earn around $87 per night.
Average Daily Rate (ADR) Trend by Month in Town of Onondaga
Get Live Town of Onondaga Market Intelligence 👇

Explore Real-time Analytics
Airbnb Seasonality Analysis & Trends in Town of Onondaga (2025)
Peak Season (August, July, October)
- Revenue averages $4,383 per month
- Occupancy rates average 54.2%
- Daily rates average $200
Shoulder Season
- Revenue averages $3,047 per month
- Occupancy maintains around 38.4%
- Daily rates hold near $195
Low Season (February, March, April)
- Revenue drops to average $1,633 per month
- Occupancy decreases to average 22.6%
- Daily rates adjust to average $188
Seasonality Insights for Town of Onondaga
- The Airbnb seasonality in Town of Onondaga shows highly seasonal trends requiring careful strategy. While the sections above show seasonal averages, it's also insightful to look at the extremes:
- During the high season, the absolute peak month showcases Town of Onondaga's highest earning potential, with monthly revenues capable of climbing to $4,923, occupancy reaching a high of 59.6%, and ADRs peaking at $204.
- Conversely, the slowest single month of the year, typically falling within the low season, marks the market's lowest point. In this month, revenue might dip to $1,177, occupancy could drop to 17.3%, and ADRs may adjust down to $182.
- Understanding both the seasonal averages and these monthly peaks and troughs in revenue, occupancy, and ADR is crucial for maximizing your Airbnb profit potential in Town of Onondaga.
Seasonal Strategies for Maximizing Profit
- Peak Season: Maximize revenue through premium pricing and potentially longer minimum stays. Ensure high availability.
- Low Season: Offer competitive pricing, special promotions (e.g., extended stay discounts), and flexible cancellation policies. Target off-season travelers like remote workers or budget-conscious guests.
- Shoulder Seasons: Implement dynamic pricing that balances peak and low rates. Target weekend travelers or specific events. Offer slightly more flexible terms than peak season.
- Regularly analyze your own performance against these Town of Onondaga seasonality benchmarks and adjust your pricing and availability strategy accordingly.
Best Areas for Airbnb Investment in Town of Onondaga (2025)
Exploring the top neighborhoods for short-term rentals in Town of Onondaga? This section highlights key areas, outlining why they are attractive for hosts and guests, along with notable local attractions. Consider these locations based on your target guest profile and investment strategy.
| Neighborhood / Area | Why Host Here? (Target Guests & Appeal) | Key Attractions & Landmarks |
|---|---|---|
| Onondaga Lake Park | A beautiful lakeside park with walking trails, picnic areas, and recreational activities. Attracts families and nature enthusiasts looking for outdoor activities and scenic views. | Onondaga Lake, Memorial Park, The Salt Museum, Fishing and Boating activities, Picnic areas |
| Destiny USA | One of the largest shopping malls in the United States, featuring retail shops, dining, and entertainment options. Great for tourists and shoppers looking for a day of fun and relaxation. | Shopping at over 250 stores, Entertainment venues, Restaurants and eateries, The Syracuse Indoor Skydiving facility, The IMAX Theater |
| Downtown Syracuse | The cultural and business hub of the region, filled with restaurants, bars, and entertainment venues. Ideal for guests who want to experience city life and local attractions. | The Landmark Theatre, Syracuse Stage, Museum of Science and Technology, Restaurants and nightlife, Armory Square |
| Green Lakes State Park | A stunning state park known for its emerald-colored lakes and outdoor recreational opportunities. Perfect for guests looking for nature retreats and outdoor adventures. | Emerald and Round Lakes, Hiking and biking trails, Picnicking areas, Kayaking and swimming, Scenic views |
| Jamesville Beach Park | A scenic park located on the shores of Onondaga Lake, offering beach access and recreation. A great spot for families and water sport enthusiasts. | Swim beach, Playgrounds, Picnic areas, Kayak rentals, Walking trails |
| Syracuse University | A major university that attracts visitors for events, sporting activities, and campus tours. Ideal for academic visitors and parents of students. | Carrier Dome, Erie Canal Museum, SU Art Museum, Various on-campus events, Sports events |
| Cultural Attractions in Syracuse | Syracuse is home to numerous cultural attractions, including theatres, museums, and galleries. Ideal for guests interested in the arts and history. | The Everson Museum of Art, Onondaga Historical Association, The Carrier Dome, Various art galleries, Symphony performances |
| Skaneateles Lake | A picturesque lake town known for its charming village, beautiful lakeside views, and outdoor activities. Attracts those looking for a serene getaway. | Boat tours on Skaneateles Lake, Charming shops and cafes, Nearby wineries, Hiking trails, Water sports activities |
Understanding Airbnb License Requirements & STR Laws in Town of Onondaga (2025)
While Town of Onondaga, New York, United States currently shows low STR regulations, specific Airbnb license requirements might still exist or change. Always verify the latest short term rental regulations and Airbnb license requirements directly with local government authorities for Town of Onondaga to ensure full compliance before hosting.
(Source: AirROI data, 2025, finding no licensed listings among those analyzed)
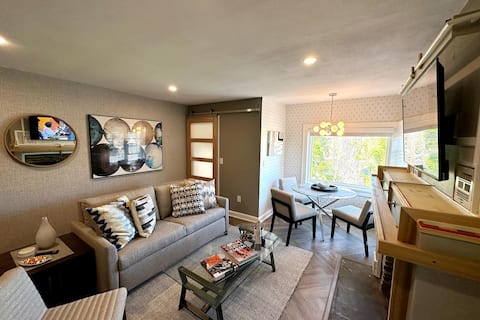
Top Performing Airbnb Properties in Town of Onondaga (2025)
Benchmark your potential! Explore examples of top-performing Airbnb properties in Town of Onondagabased on Trailing Twelve Month (TTM) revenue. Analyze their characteristics, revenue, occupancy rate, and ADR to understand what drives success in this market.

The Honeycrisp House at Beak & Skiff
Entire Place • 3 bedrooms

The Orchard Overlook at Beak & Skiff
Entire Place • 3 bedrooms

Hot Tub, Game room, Young fam haven Slps 10
Entire Place • 4 bedrooms

Vacation with Goats and Hot Tub near Syracuse
Entire Place • 3 bedrooms
Designer's Hillside Cottage! 1BR
Entire Place • 1 bedroom
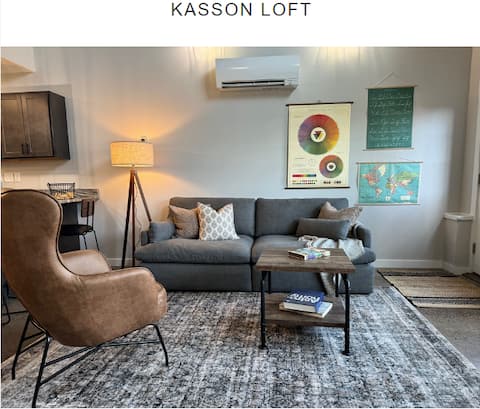
Converted School House Loft Apartment
Entire Place • 3 bedrooms
Note: Performance varies based on location, size, amenities, seasonality, and management quality. Data reflects the past 12 months.
Top Performing Airbnb Hosts in Town of Onondaga (2025)
Learn from the best! This table showcases top-performing Airbnb hosts in Town of Onondaga based on the number of properties managed and estimated total revenue over the past year. Analyze their scale and performance metrics.
| Host Name | Properties | Grossing Revenue | Stay Reviews | Avg Rating |
|---|---|---|---|---|
| Eddie | 2 | $177,472 | 348 | 4.93/5.0 |
| Merritt | 1 | $83,855 | 34 | 4.79/5.0 |
| Samantha | 4 | $74,462 | 479 | 4.92/5.0 |
| Jeffrey | 3 | $63,867 | 131 | 4.79/5.0 |
| Host #199752563 | 2 | $27,067 | 3 | 0.00/5.0 |
| Karen | 1 | $24,901 | 10 | 5.00/5.0 |
| Elizabeth | 1 | $22,530 | 81 | 4.64/5.0 |
| Geraldine | 3 | $15,534 | 125 | 5.00/5.0 |
| Jade | 1 | $5,593 | 3 | 4.33/5.0 |
| Tyler | 1 | $2,852 | 4 | 5.00/5.0 |
Analyzing the strategies of top hosts, such as their property selection, pricing, and guest communication, can offer valuable lessons for optimizing your own Airbnb operations in Town of Onondaga.
Dive Deeper: Advanced Town of Onondaga STR Market Data (2025)
Ready to unlock more insights? AirROI provides access to advanced metrics and comprehensive Airbnb data for Town of Onondaga. Explore detailed analytics beyond this report to refine your investment strategy, optimize pricing, and maximize your vacation rental profits.
Explore Advanced MetricsTown of Onondaga Short-Term Rental Market Composition (2025): Property & Room Types
Room Type Distribution
Property Type Distribution
Market Composition Insights for Town of Onondaga
- The Town of Onondaga Airbnb market composition is heavily skewed towards Entire Home/Apt listings, which make up 65% of the 20 active rentals. This indicates strong guest preference for privacy and space.
- However, a notable 35% share for Private Rooms suggests opportunities for budget-conscious travelers or hosts renting out spare rooms.
- Looking at the property type distribution in Town of Onondaga, House properties are the most common (50%), reflecting the local real estate landscape.
- Houses represent a significant 50% portion, catering likely to families or larger groups.
Town of Onondaga Airbnb Room Capacity Analysis (2025): Bedroom Distribution
Distribution of Listings by Number of Bedrooms
Room Capacity Insights for Town of Onondaga
- The dominant room capacity in Town of Onondaga is 3 bedrooms listings, making up 25% of the market. This suggests a strong demand for properties suitable for families or small groups.
- Together, 3 bedrooms and 1 bedroom properties represent 45.0% of the active Airbnb listings in Town of Onondaga, indicating a high concentration in these sizes.
- A significant 30.0% of listings offer 3+ bedrooms, catering to larger groups and families seeking more space in Town of Onondaga.
Town of Onondaga Vacation Rental Guest Capacity Trends (2025)
Distribution of Listings by Guest Capacity
Guest Capacity Insights for Town of Onondaga
- The most common guest capacity trend in Town of Onondaga vacation rentals is listings accommodating 6 guests (30%). This suggests the primary traveler segment is likely larger groups.
- Properties designed for 6 guests and 8+ guests dominate the Town of Onondaga STR market, accounting for 45.0% of listings.
- 45.0% of properties accommodate 6+ guests, serving the market segment for larger families or group travel in Town of Onondaga.
- On average, properties in Town of Onondaga are equipped to host 3.6 guests.
Town of Onondaga Airbnb Booking Patterns (2025): Available vs. Booked Days
Available Days Distribution
Booked Days Distribution
Booking Pattern Insights for Town of Onondaga
- The most common availability pattern in Town of Onondaga falls within the 271-366 days range, representing 45% of listings. This suggests many properties have significant open periods on their calendars.
- Approximately 75.0% of listings show high availability (181+ days open annually), indicating potential for increased bookings or specific owner usage patterns.
- For booked days, the 31-90 days range is most frequent in Town of Onondaga (30%), reflecting common guest stay durations or potential owner blocking patterns.
- A notable 25.0% of properties secure long booking periods (181+ days booked per year), highlighting successful long-term rental strategies or significant owner usage.
Town of Onondaga Airbnb Minimum Stay Requirements Analysis
Distribution of Listings by Minimum Night Requirement
1 Night
11 listings
61.1% of total
2 Nights
1 listings
5.6% of total
3 Nights
4 listings
22.2% of total
7-29 Nights
1 listings
5.6% of total
30+ Nights
1 listings
5.6% of total
Key Insights
- The most prevalent minimum stay requirement in Town of Onondaga is 1 Night, adopted by 61.1% of listings. This highlights the market's preference for shorter, flexible bookings.
- A strong majority (66.7%) of the Town of Onondaga Airbnb data shows acceptance of very short stays (1-2 nights), indicating a dynamic, high-turnover market.
Recommendations
- Align with the market by considering a 1 Night minimum stay, as 61.1% of Town of Onondaga hosts use this setting.
- Explore offering discounts for stays of 30+ nights to attract the 5.6% of the market seeking extended stays.
- Adjust minimum nights based on seasonality – potentially shorter during low season and longer during peak demand periods in Town of Onondaga.
Town of Onondaga Airbnb Cancellation Policy Trends Analysis (2025)
Flexible
4 listings
23.5% of total
Moderate
4 listings
23.5% of total
Firm
4 listings
23.5% of total
Strict
5 listings
29.4% of total
Cancellation Policy Insights for Town of Onondaga
- The prevailing Airbnb cancellation policy trend in Town of Onondaga is Strict, used by 29.4% of listings.
- A majority (52.9%) of hosts in Town of Onondaga utilize Firm or Strict policies, indicating a market where hosts prioritize booking security.
Recommendations for Hosts
- Consider adopting a Strict policy to align with the 29.4% market standard in Town of Onondaga.
- Regularly review your cancellation policy against competitors and market demand shifts in Town of Onondaga.
Town of Onondaga STR Booking Lead Time Analysis (2025)
Average Booking Lead Time by Month
Booking Lead Time Insights for Town of Onondaga
- The overall average booking lead time for vacation rentals in Town of Onondaga is 62 days.
- Guests book furthest in advance for stays during July (average 103 days), likely coinciding with peak travel demand or local events.
- The shortest booking windows occur for stays in February (average 21 days), indicating more last-minute travel plans during this time.
- Seasonally, Summer (88 days avg.) sees the longest lead times, while Winter (37 days avg.) has the shortest, reflecting typical travel planning cycles.
Recommendations for Hosts
- Use the overall average lead time (62 days) as a baseline for your pricing and availability strategy in Town of Onondaga.
- For July stays, consider implementing length-of-stay discounts or slightly higher rates for bookings made less than 103 days out to capitalize on advance planning.
- Target marketing efforts for the Summer season well in advance (at least 88 days) to capture early planners.
- Monitor your own booking lead times against these Town of Onondaga averages to identify opportunities for dynamic pricing adjustments.
Popular & Essential Airbnb Amenities in Town of Onondaga (2025)
Amenity Prevalence
Amenity Insights for Town of Onondaga
- Essential amenities in Town of Onondaga that guests expect include: Free parking on premises, Wifi, Washer, Kitchen, Essentials, Hot water, Smoke alarm, Dryer, Heating. Lacking these (any) could significantly impact bookings.
- Popular amenities like Iron are common but not universal. Offering these can provide a competitive edge.
Recommendations for Hosts
- Ensure your listing includes all essential amenities for Town of Onondaga: Free parking on premises, Wifi, Washer, Kitchen, Essentials, Hot water, Smoke alarm, Dryer, Heating.
- Prioritize adding missing essentials: Essentials, Hot water, Smoke alarm, Dryer, Heating.
- Consider adding popular differentiators like Iron to increase appeal.
- Highlight unique or less common amenities you offer (e.g., hot tub, dedicated workspace, EV charger) in your listing description and photos.
- Regularly check competitor amenities in Town of Onondaga to stay competitive.
Town of Onondaga Airbnb Guest Demographics & Profile Analysis (2025)
Guest Profile Summary for Town of Onondaga
- The typical guest profile for Airbnb in Town of Onondaga consists of primarily domestic travelers (94%), often arriving from nearby New York, typically belonging to the Post-2000s (Gen Z/Alpha) group (50%), primarily speaking English or Spanish.
- Domestic travelers account for 94.4% of guests.
- Key international markets include United States (94.4%) and Canada (4%).
- Top languages spoken are English (83.3%) followed by Spanish (5%).
- A significant demographic segment is the Post-2000s (Gen Z/Alpha) group, representing 50% of guests.
Recommendations for Hosts
- Target domestic marketing efforts towards travelers from New York and Syracuse.
- Tailor amenities and listing descriptions to appeal to the dominant Post-2000s (Gen Z/Alpha) demographic (e.g., highlight fast WiFi, smart home features, local guides).
- Highlight unique local experiences or amenities relevant to the primary guest profile.
- Consider seasonal promotions aligned with peak travel times for key origin markets.
Nearby Short-Term Rental Market Comparison
How does the Town of Onondaga Airbnb market stack up against its neighbors? Compare key performance metrics like average monthly revenue, ADR, and occupancy rates in surrounding areas to understand the broader regional STR landscape.
| Market | Active Properties | Monthly Revenue | Daily Rate | Avg. Occupancy |
|---|---|---|---|---|
| Berlin Township | 15 | $9,384 | $663.27 | 35% |
| Town of Trenton | 11 | $8,040 | $458.56 | 54% |
| Rushville | 13 | $6,613 | $489.17 | 50% |
| Penn Estates | 58 | $6,479 | $386.94 | 50% |
| Naples | 21 | $6,262 | $553.45 | 47% |
| Town of Otisco | 19 | $5,936 | $404.67 | 44% |
| Foster Township | 20 | $5,841 | $420.22 | 38% |
| Stroud Township | 122 | $5,734 | $420.52 | 44% |
| Town of Skaneateles | 62 | $5,047 | $476.41 | 46% |
| Mount Pocono | 20 | $5,029 | $448.59 | 42% |