Town of Mount Hope Airbnb Market Analysis 2025: Short Term Rental Data & Vacation Rental Statistics in New York, United States
Is Airbnb profitable in Town of Mount Hope in 2025? Explore comprehensive Airbnb analytics for Town of Mount Hope, New York, United States to uncover income potential. This 2025 STR market report for Town of Mount Hope, based on AirROI data from April 2024 to March 2025, reveals key trends in the niche market of 20 active listings.
Whether you're considering an Airbnb investment in Town of Mount Hope, optimizing your existing vacation rental, or exploring rental arbitrage opportunities, understanding the Town of Mount Hope Airbnb data is crucial. Leveraging the low regulation environment is key to maximizing your short term rental income potential. Let's dive into the specifics.
Key Town of Mount Hope Airbnb Performance Metrics Overview
Monthly Airbnb Revenue Variations & Income Potential in Town of Mount Hope (2025)
Understanding the monthly revenue variations for Airbnb listings in Town of Mount Hope is key to maximizing your short term rental income potential. Seasonality significantly impacts earnings. Our analysis, based on data from the past 12 months, shows that the peak revenue month for STRs in Town of Mount Hope is typically June, while January often presents the lowest earnings, highlighting opportunities for strategic pricing adjustments during shoulder and low seasons. Explore the typical Airbnb income in Town of Mount Hope across different performance tiers:
- Best-in-class properties (Top 10%) achieve $8,992+ monthly, often utilizing dynamic pricing and superior guest experiences.
- Strong performing properties (Top 25%) earn $4,560 or more, indicating effective management and desirable locations/amenities.
- Typical properties (Median) generate around $2,000 per month, representing the average market performance.
- Entry-level properties (Bottom 25%) see earnings around $825, often with potential for optimization.
Average Monthly Airbnb Earnings Trend in Town of Mount Hope
Town of Mount Hope Airbnb Occupancy Rate Trends (2025)
Maximize your bookings by understanding the Town of Mount Hope STR occupancy trends. Seasonal demand shifts significantly influence how often properties are booked. Typically, Julysees the highest demand (peak season occupancy), while April experiences the lowest (low season). Effective strategies, like adjusting minimum stays or offering promotions, can boost occupancy during slower periods. Here's how different property tiers perform in Town of Mount Hope:
- Best-in-class properties (Top 10%) achieve 79%+ occupancy, indicating high desirability and potentially optimized availability.
- Strong performing properties (Top 25%) maintain 71% or higher occupancy, suggesting good market fit and guest satisfaction.
- Typical properties (Median) have an occupancy rate around 47%.
- Entry-level properties (Bottom 25%) average 23% occupancy, potentially facing higher vacancy.
Average Monthly Occupancy Rate Trend in Town of Mount Hope
Average Daily Rate (ADR) Airbnb Trends in Town of Mount Hope (2025)
Effective short term rental pricing strategy in Town of Mount Hope involves understanding monthly ADR fluctuations. The Average Daily Rate (ADR) for Airbnb in Town of Mount Hope typically peaks in June and dips lowest during February. Leveraging Airbnb dynamic pricing tools or strategies based on this seasonality can significantly boost revenue. Here's a look at the typical nightly rates achieved:
- Best-in-class properties (Top 10%) command rates of $501+ per night, often due to premium features or locations.
- Strong performing properties (Top 25%) achieve nightly rates of $263 or more.
- Typical properties (Median) charge around $160 per night.
- Entry-level properties (Bottom 25%) earn around $33 per night.
Average Daily Rate (ADR) Trend by Month in Town of Mount Hope
Get Live Town of Mount Hope Market Intelligence 👇

Explore Real-time Analytics
Airbnb Seasonality Analysis & Trends in Town of Mount Hope (2025)
Peak Season (June, July, August)
- Revenue averages $5,412 per month
- Occupancy rates average 57.8%
- Daily rates average $215
Shoulder Season
- Revenue averages $3,220 per month
- Occupancy maintains around 48.4%
- Daily rates hold near $202
Low Season (January, February, March)
- Revenue drops to average $1,926 per month
- Occupancy decreases to average 38.1%
- Daily rates adjust to average $199
Seasonality Insights for Town of Mount Hope
- The Airbnb seasonality in Town of Mount Hope shows highly seasonal trends requiring careful strategy. While the sections above show seasonal averages, it's also insightful to look at the extremes:
- During the high season, the absolute peak month showcases Town of Mount Hope's highest earning potential, with monthly revenues capable of climbing to $5,565, occupancy reaching a high of 63.9%, and ADRs peaking at $216.
- Conversely, the slowest single month of the year, typically falling within the low season, marks the market's lowest point. In this month, revenue might dip to $1,890, occupancy could drop to 31.1%, and ADRs may adjust down to $198.
- Understanding both the seasonal averages and these monthly peaks and troughs in revenue, occupancy, and ADR is crucial for maximizing your Airbnb profit potential in Town of Mount Hope.
Seasonal Strategies for Maximizing Profit
- Peak Season: Maximize revenue through premium pricing and potentially longer minimum stays. Ensure high availability.
- Low Season: Offer competitive pricing, special promotions (e.g., extended stay discounts), and flexible cancellation policies. Target off-season travelers like remote workers or budget-conscious guests.
- Shoulder Seasons: Implement dynamic pricing that balances peak and low rates. Target weekend travelers or specific events. Offer slightly more flexible terms than peak season.
- Regularly analyze your own performance against these Town of Mount Hope seasonality benchmarks and adjust your pricing and availability strategy accordingly.
Best Areas for Airbnb Investment in Town of Mount Hope (2025)
Exploring the top neighborhoods for short-term rentals in Town of Mount Hope? This section highlights key areas, outlining why they are attractive for hosts and guests, along with notable local attractions. Consider these locations based on your target guest profile and investment strategy.
| Neighborhood / Area | Why Host Here? (Target Guests & Appeal) | Key Attractions & Landmarks |
|---|---|---|
| Mount Hope Village | Charming village known for its quaint atmosphere and proximity to nature. Ideal for travelers seeking a peaceful retreat just steps away from outdoor activities. | Mount Hope Park, Huntington Forest, local shops and boutiques, scenic walking trails, community events |
| Cotswold Lake | Scenic lake area perfect for summer vacations and water sports. Popular among families and outdoor enthusiasts looking for a recreational getaway. | Cotswold Lake, picnic areas, boat rentals, fishing spots, nature trails |
| Guitarist Lake | A hidden gem that offers serene views and a tranquil environment, attracting visitors looking to unwind and enjoy scenic nature. | Guitarist Lake, hiking trails, bird watching, peaceful picnic spots |
| Groveland | A small community known for its spacious homes and family-friendly atmosphere. Great for those looking to host larger groups or families. | local parks, community center, quiet neighborhoods, festivals and local events |
| Masonville | An emerging area with affordable properties and a growing community. Attractive for budget-conscious travelers wanting to explore the nearby natural attractions. | Masonville Park, local farms, community markets, outdoor events |
| Tidy Dole Resort | Popular destination for seasonal visitors, this resort area draws guests looking for relaxation and leisure activities, especially during the summer months. | Resort amenities, water activities, fine dining, recreational sports |
| Evergreen Woods | A tranquil neighborhood surrounded by lush greenery. Ideal for nature lovers and those looking to escape the hustle and bustle of city life. | Evergreen Woods trails, camping spots, bird watching, nature photography |
| Pine Grove Estates | A family-friendly neighborhood that is gaining popularity due to its spacious homes and sense of community. Ideal for larger groups or families visiting the area. | Pine Grove Park, community events, playgrounds, local eateries |
Understanding Airbnb License Requirements & STR Laws in Town of Mount Hope (2025)
While Town of Mount Hope, New York, United States currently shows low STR regulations, specific Airbnb license requirements might still exist or change. Always verify the latest short term rental regulations and Airbnb license requirements directly with local government authorities for Town of Mount Hope to ensure full compliance before hosting.
(Source: AirROI data, 2025, finding no licensed listings among those analyzed)
Top Performing Airbnb Properties in Town of Mount Hope (2025)
Benchmark your potential! Explore examples of top-performing Airbnb properties in Town of Mount Hopebased on Trailing Twelve Month (TTM) revenue. Analyze their characteristics, revenue, occupancy rate, and ADR to understand what drives success in this market.
Secluded Farmhouse, 30 acres private estate.
Entire Place • 6 bedrooms
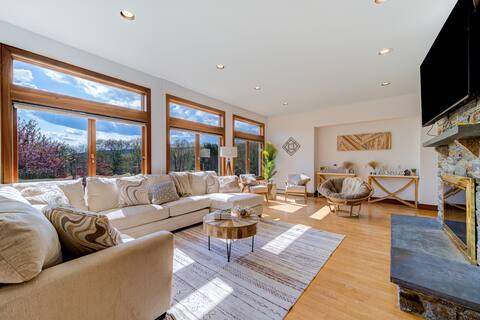
Relaxing Luxuries Retreat
Entire Place • 4 bedrooms
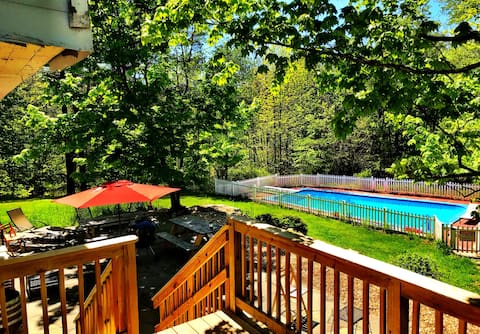
Lakefront House w/Private Dock, Fire Pit & Hot Tub
Entire Place • 1 bedroom
6BDR entire house Relax Quiet Safe Clean 2 kitchen
Entire Place • 6 bedrooms
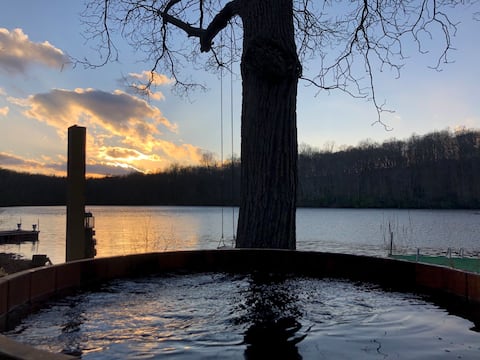
Lake House with Private Dock, Grill, and Fire Pit
Entire Place • 3 bedrooms

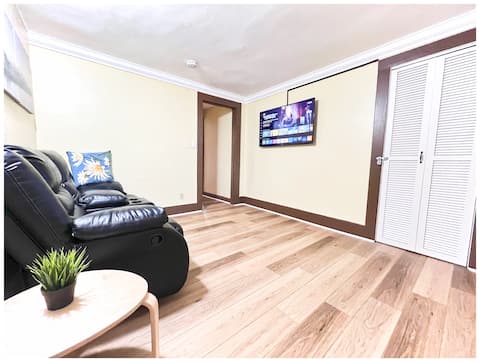
⌂ Backyard Porch ⌂ Cozy Getaway ⌂ Catskills Hikes
Entire Place • 2 bedrooms
Note: Performance varies based on location, size, amenities, seasonality, and management quality. Data reflects the past 12 months.
Top Performing Airbnb Hosts in Town of Mount Hope (2025)
Learn from the best! This table showcases top-performing Airbnb hosts in Town of Mount Hope based on the number of properties managed and estimated total revenue over the past year. Analyze their scale and performance metrics.
| Host Name | Properties | Grossing Revenue | Stay Reviews | Avg Rating |
|---|---|---|---|---|
| Feng | 11 | $156,605 | 154 | 4.34/5.0 |
| Han | 2 | $123,592 | 124 | 4.99/5.0 |
| Pierre & Emily | 1 | $110,224 | 102 | 4.72/5.0 |
| Host #408837240 | 1 | $103,897 | 78 | 4.74/5.0 |
| Lillian | 2 | $51,826 | 134 | 4.84/5.0 |
| Mike | 1 | $48,684 | 66 | 4.97/5.0 |
| Angel | 1 | $30,926 | 62 | 4.94/5.0 |
| Host #511258954 | 1 | $13,156 | 14 | 4.93/5.0 |
Analyzing the strategies of top hosts, such as their property selection, pricing, and guest communication, can offer valuable lessons for optimizing your own Airbnb operations in Town of Mount Hope.
Dive Deeper: Advanced Town of Mount Hope STR Market Data (2025)
Ready to unlock more insights? AirROI provides access to advanced metrics and comprehensive Airbnb data for Town of Mount Hope. Explore detailed analytics beyond this report to refine your investment strategy, optimize pricing, and maximize your vacation rental profits.
Explore Advanced MetricsTown of Mount Hope Short-Term Rental Market Composition (2025): Property & Room Types
Room Type Distribution
Property Type Distribution
Market Composition Insights for Town of Mount Hope
- The Town of Mount Hope Airbnb market composition is heavily skewed towards Entire Home/Apt listings, which make up 70% of the 20 active rentals. This indicates strong guest preference for privacy and space.
- Looking at the property type distribution in Town of Mount Hope, House properties are the most common (95%), reflecting the local real estate landscape.
- Houses represent a significant 95% portion, catering likely to families or larger groups.
Town of Mount Hope Airbnb Room Capacity Analysis (2025): Bedroom Distribution
Distribution of Listings by Number of Bedrooms
Room Capacity Insights for Town of Mount Hope
- The dominant room capacity in Town of Mount Hope is 3 bedrooms listings, making up 30% of the market. This suggests a strong demand for properties suitable for families or small groups.
- Together, 3 bedrooms and 2 bedrooms properties represent 45.0% of the active Airbnb listings in Town of Mount Hope, indicating a high concentration in these sizes.
- A significant 50.0% of listings offer 3+ bedrooms, catering to larger groups and families seeking more space in Town of Mount Hope.
Town of Mount Hope Vacation Rental Guest Capacity Trends (2025)
Distribution of Listings by Guest Capacity
Guest Capacity Insights for Town of Mount Hope
- The most common guest capacity trend in Town of Mount Hope vacation rentals is listings accommodating 6 guests (30%). This suggests the primary traveler segment is likely larger groups.
- Properties designed for 6 guests and 8+ guests dominate the Town of Mount Hope STR market, accounting for 50.0% of listings.
- 50.0% of properties accommodate 6+ guests, serving the market segment for larger families or group travel in Town of Mount Hope.
- On average, properties in Town of Mount Hope are equipped to host 4.3 guests.
Town of Mount Hope Airbnb Booking Patterns (2025): Available vs. Booked Days
Available Days Distribution
Booked Days Distribution
Booking Pattern Insights for Town of Mount Hope
- The most common availability pattern in Town of Mount Hope falls within the 181-270 days range, representing 35% of listings. This suggests many properties have significant open periods on their calendars.
- Approximately 55.0% of listings show high availability (181+ days open annually), indicating potential for increased bookings or specific owner usage patterns.
- For booked days, the 91-180 days range is most frequent in Town of Mount Hope (35%), reflecting common guest stay durations or potential owner blocking patterns.
- A notable 45.0% of properties secure long booking periods (181+ days booked per year), highlighting successful long-term rental strategies or significant owner usage.
Town of Mount Hope Airbnb Minimum Stay Requirements Analysis
Distribution of Listings by Minimum Night Requirement
1 Night
3 listings
20% of total
2 Nights
7 listings
46.7% of total
3 Nights
1 listings
6.7% of total
30+ Nights
4 listings
26.7% of total
Key Insights
- The most prevalent minimum stay requirement in Town of Mount Hope is 2 Nights, adopted by 46.7% of listings. This highlights the market's preference for shorter, flexible bookings.
- A strong majority (66.7%) of the Town of Mount Hope Airbnb data shows acceptance of very short stays (1-2 nights), indicating a dynamic, high-turnover market.
- A significant segment (26.7%) caters to monthly stays (30+ nights) in Town of Mount Hope, pointing to opportunities in the extended-stay market.
Recommendations
- Align with the market by considering a 2 Nights minimum stay, as 46.7% of Town of Mount Hope hosts use this setting.
- If feasible, allowing 1-night stays, especially midweek or during low season, could capture last-minute bookings, as only 20% currently do.
- Explore offering discounts for stays of 30+ nights to attract the 26.7% of the market seeking extended stays.
- Adjust minimum nights based on seasonality – potentially shorter during low season and longer during peak demand periods in Town of Mount Hope.
Town of Mount Hope Airbnb Cancellation Policy Trends Analysis (2025)
Moderate
1 listings
6.7% of total
Firm
12 listings
80% of total
Strict
2 listings
13.3% of total
Cancellation Policy Insights for Town of Mount Hope
- The prevailing Airbnb cancellation policy trend in Town of Mount Hope is Firm, used by 80% of listings.
- A majority (93.3%) of hosts in Town of Mount Hope utilize Firm or Strict policies, indicating a market where hosts prioritize booking security.
Recommendations for Hosts
- Consider adopting a Firm policy to align with the 80% market standard in Town of Mount Hope.
- Using a Strict policy might deter some guests, as only 13.3% of listings use it. Evaluate if potential revenue protection outweighs possible lower booking rates.
- Regularly review your cancellation policy against competitors and market demand shifts in Town of Mount Hope.
Town of Mount Hope STR Booking Lead Time Analysis (2025)
Average Booking Lead Time by Month
Booking Lead Time Insights for Town of Mount Hope
- The overall average booking lead time for vacation rentals in Town of Mount Hope is 27 days.
- Guests book furthest in advance for stays during May (average 62 days), likely coinciding with peak travel demand or local events.
- The shortest booking windows occur for stays in February (average 11 days), indicating more last-minute travel plans during this time.
- Seasonally, Spring (47 days avg.) sees the longest lead times, while Winter (17 days avg.) has the shortest, reflecting typical travel planning cycles.
Recommendations for Hosts
- Use the overall average lead time (27 days) as a baseline for your pricing and availability strategy in Town of Mount Hope.
- For May stays, consider implementing length-of-stay discounts or slightly higher rates for bookings made less than 62 days out to capitalize on advance planning.
- During February, focus on last-minute booking availability and promotions, as guests book with very short notice (11 days avg.).
- Target marketing efforts for the Spring season well in advance (at least 47 days) to capture early planners.
- Monitor your own booking lead times against these Town of Mount Hope averages to identify opportunities for dynamic pricing adjustments.
Popular & Essential Airbnb Amenities in Town of Mount Hope (2025)
Amenity Prevalence
No amenities with partial availability (less than 100%) were found to display in the chart. All essential amenities might be present in all listings. Check insights below.
Amenity Insights for Town of Mount Hope
- Essential amenities in Town of Mount Hope that guests expect include: Free parking on premises, Dishes and silverware, Shampoo, Bed linens, Kitchen, Fire extinguisher, Essentials, Heating, Smoke alarm, Cooking basics. Lacking these (any) could significantly impact bookings.
Recommendations for Hosts
- Ensure your listing includes all essential amenities for Town of Mount Hope: Free parking on premises, Dishes and silverware, Shampoo, Bed linens, Kitchen, Fire extinguisher, Essentials, Heating, Smoke alarm, Cooking basics.
- Highlight unique or less common amenities you offer (e.g., hot tub, dedicated workspace, EV charger) in your listing description and photos.
- Regularly check competitor amenities in Town of Mount Hope to stay competitive.
Town of Mount Hope Airbnb Guest Demographics & Profile Analysis (2025)
Guest Profile Summary for Town of Mount Hope
- The typical guest profile for Airbnb in Town of Mount Hope consists of primarily domestic travelers (94%), often arriving from nearby New York, typically belonging to the Post-2000s (Gen Z/Alpha) group (50%), primarily speaking English or Spanish.
- Domestic travelers account for 94.1% of guests.
- Key international markets include United States (94.1%) and Czechia (1.1%).
- Top languages spoken are English (55.6%) followed by Spanish (15.6%).
- A significant demographic segment is the Post-2000s (Gen Z/Alpha) group, representing 50% of guests.
Recommendations for Hosts
- Target domestic marketing efforts towards travelers from New York and Boston.
- Tailor amenities and listing descriptions to appeal to the dominant Post-2000s (Gen Z/Alpha) demographic (e.g., highlight fast WiFi, smart home features, local guides).
- Highlight unique local experiences or amenities relevant to the primary guest profile.
- Consider seasonal promotions aligned with peak travel times for key origin markets.
Nearby Short-Term Rental Market Comparison
How does the Town of Mount Hope Airbnb market stack up against its neighbors? Compare key performance metrics like average monthly revenue, ADR, and occupancy rates in surrounding areas to understand the broader regional STR landscape.
| Market | Active Properties | Monthly Revenue | Daily Rate | Avg. Occupancy |
|---|---|---|---|---|
| Berlin Township | 15 | $9,384 | $663.27 | 35% |
| Town of Stuyvesant | 10 | $6,757 | $533.74 | 41% |
| Frankford Township | 10 | $6,656 | $501.80 | 45% |
| Penn Estates | 58 | $6,479 | $386.94 | 50% |
| Spring Lake Heights | 16 | $6,192 | $690.88 | 49% |
| Town of Kingston | 13 | $6,045 | $436.18 | 49% |
| Town of Pawling | 16 | $5,956 | $392.41 | 56% |
| Brookfield | 13 | $5,891 | $486.63 | 51% |
| Town/Village of Harrison | 10 | $5,764 | $590.20 | 48% |
| Stroud Township | 122 | $5,734 | $420.52 | 44% |