Findley Lake Airbnb Market Analysis 2025: Short Term Rental Data & Vacation Rental Statistics in New York, United States
Is Airbnb profitable in Findley Lake in 2025? Explore comprehensive Airbnb analytics for Findley Lake, New York, United States to uncover income potential. This 2025 STR market report for Findley Lake, based on AirROI data from April 2024 to March 2025, reveals key trends in the niche market of 17 active listings.
Whether you're considering an Airbnb investment in Findley Lake, optimizing your existing vacation rental, or exploring rental arbitrage opportunities, understanding the Findley Lake Airbnb data is crucial. Leveraging the low regulation environment is key to maximizing your short term rental income potential. Let's dive into the specifics.
Key Findley Lake Airbnb Performance Metrics Overview
Monthly Airbnb Revenue Variations & Income Potential in Findley Lake (2025)
Understanding the monthly revenue variations for Airbnb listings in Findley Lake is key to maximizing your short term rental income potential. Seasonality significantly impacts earnings. Our analysis, based on data from the past 12 months, shows that the peak revenue month for STRs in Findley Lake is typically July, while November often presents the lowest earnings, highlighting opportunities for strategic pricing adjustments during shoulder and low seasons. Explore the typical Airbnb income in Findley Lake across different performance tiers:
- Best-in-class properties (Top 10%) achieve $4,271+ monthly, often utilizing dynamic pricing and superior guest experiences.
- Strong performing properties (Top 25%) earn $3,410 or more, indicating effective management and desirable locations/amenities.
- Typical properties (Median) generate around $1,887 per month, representing the average market performance.
- Entry-level properties (Bottom 25%) see earnings around $959, often with potential for optimization.
Average Monthly Airbnb Earnings Trend in Findley Lake
Findley Lake Airbnb Occupancy Rate Trends (2025)
Maximize your bookings by understanding the Findley Lake STR occupancy trends. Seasonal demand shifts significantly influence how often properties are booked. Typically, Augustsees the highest demand (peak season occupancy), while November experiences the lowest (low season). Effective strategies, like adjusting minimum stays or offering promotions, can boost occupancy during slower periods. Here's how different property tiers perform in Findley Lake:
- Best-in-class properties (Top 10%) achieve 76%+ occupancy, indicating high desirability and potentially optimized availability.
- Strong performing properties (Top 25%) maintain 60% or higher occupancy, suggesting good market fit and guest satisfaction.
- Typical properties (Median) have an occupancy rate around 35%.
- Entry-level properties (Bottom 25%) average 16% occupancy, potentially facing higher vacancy.
Average Monthly Occupancy Rate Trend in Findley Lake
Average Daily Rate (ADR) Airbnb Trends in Findley Lake (2025)
Effective short term rental pricing strategy in Findley Lake involves understanding monthly ADR fluctuations. The Average Daily Rate (ADR) for Airbnb in Findley Lake typically peaks in February and dips lowest during April. Leveraging Airbnb dynamic pricing tools or strategies based on this seasonality can significantly boost revenue. Here's a look at the typical nightly rates achieved:
- Best-in-class properties (Top 10%) command rates of $575+ per night, often due to premium features or locations.
- Strong performing properties (Top 25%) achieve nightly rates of $263 or more.
- Typical properties (Median) charge around $196 per night.
- Entry-level properties (Bottom 25%) earn around $126 per night.
Average Daily Rate (ADR) Trend by Month in Findley Lake
Get Live Findley Lake Market Intelligence 👇

Explore Real-time Analytics
Airbnb Seasonality Analysis & Trends in Findley Lake (2025)
Peak Season (July, August, June)
- Revenue averages $3,236 per month
- Occupancy rates average 53.6%
- Daily rates average $250
Shoulder Season
- Revenue averages $1,993 per month
- Occupancy maintains around 37.6%
- Daily rates hold near $251
Low Season (January, April, November)
- Revenue drops to average $1,533 per month
- Occupancy decreases to average 31.3%
- Daily rates adjust to average $252
Seasonality Insights for Findley Lake
- The Airbnb seasonality in Findley Lake shows highly seasonal trends requiring careful strategy. While the sections above show seasonal averages, it's also insightful to look at the extremes:
- During the high season, the absolute peak month showcases Findley Lake's highest earning potential, with monthly revenues capable of climbing to $3,393, occupancy reaching a high of 58.1%, and ADRs peaking at $262.
- Conversely, the slowest single month of the year, typically falling within the low season, marks the market's lowest point. In this month, revenue might dip to $1,472, occupancy could drop to 26.4%, and ADRs may adjust down to $245.
- Understanding both the seasonal averages and these monthly peaks and troughs in revenue, occupancy, and ADR is crucial for maximizing your Airbnb profit potential in Findley Lake.
Seasonal Strategies for Maximizing Profit
- Peak Season: Maximize revenue through premium pricing and potentially longer minimum stays. Ensure high availability.
- Low Season: Offer competitive pricing, special promotions (e.g., extended stay discounts), and flexible cancellation policies. Target off-season travelers like remote workers or budget-conscious guests.
- Shoulder Seasons: Implement dynamic pricing that balances peak and low rates. Target weekend travelers or specific events. Offer slightly more flexible terms than peak season.
- Regularly analyze your own performance against these Findley Lake seasonality benchmarks and adjust your pricing and availability strategy accordingly.
Best Areas for Airbnb Investment in Findley Lake (2025)
Exploring the top neighborhoods for short-term rentals in Findley Lake? This section highlights key areas, outlining why they are attractive for hosts and guests, along with notable local attractions. Consider these locations based on your target guest profile and investment strategy.
| Neighborhood / Area | Why Host Here? (Target Guests & Appeal) | Key Attractions & Landmarks |
|---|---|---|
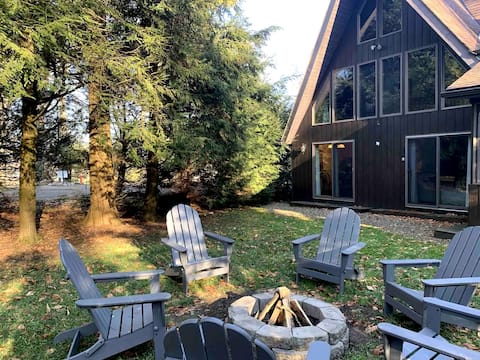
| Findley Lake | A serene small town known for its beautiful lake and outdoor activities. Perfect for families and nature lovers looking for a peaceful getaway. | Findley Lake, Chautauqua Lake, Panama Rocks Scenic Park, State Parks for hiking and fishing, Skiing at nearby Peek'n Peak Resort |
| Peek'n Peak Resort | A popular ski and golf resort area that attracts visitors year-round. Ideal for outdoor enthusiasts and those looking for recreational activities. | Skiing and snowboarding, Golf courses, Ziplining, Spa services, Dining options at the resort |
| Chautauqua Institution | A historic resort community known for its cultural and educational programs during the summer months. A unique place for visitors interested in arts and culture. | Chautauqua Lake, Performances at the Amphitheater, Art galleries, Lectures and workshops, Walking trails |
| Ashville | A charming village close to Findley Lake, popular for its scenic charm and proximity to outdoor activities, making it a lovely escape destination. | Lake Chautauqua, Local parks, Fishing spots, Charming rural landscapes, Community events |
| Clymer | A quiet rural area that offers a peaceful retreat, attractive to those seeking a serene vacation away from the hustle and bustle. | Clymer Central School sports events, Local farms, Rural landscape tours, Fishing and hiking in nearby areas, Community heritage sights |
| Sugar Grove | Nestled in the countryside and close to Findley Lake, this area is perfect for serene nature retreats and has access to several outdoor activities. | Nearby forests and trails, Lake Erie nearby, Local artisanal shops, Historical sites, Seasonal events |
| Mayville | Located near Chautauqua Lake, it is an emerging spot for tourists, providing access to beautiful lake views and various outdoor activities. | Chautauqua Lake, Mayville Lakeside Park, Local dining options, Fishing and boating, Hiking trails |
| Westfield | A quaint town close to Lake Erie, known for its wineries and beautiful landscape. Great for those looking to explore local culture and nature. | Wineries and vineyards, Lake Erie shoreline, Local art galleries, Shops and markets, Community events and festivals |
Understanding Airbnb License Requirements & STR Laws in Findley Lake (2025)
While Findley Lake, New York, United States currently shows low STR regulations, specific Airbnb license requirements might still exist or change. Always verify the latest short term rental regulations and Airbnb license requirements directly with local government authorities for Findley Lake to ensure full compliance before hosting.
(Source: AirROI data, 2025, finding no licensed listings among those analyzed)
Top Performing Airbnb Properties in Findley Lake (2025)
Benchmark your potential! Explore examples of top-performing Airbnb properties in Findley Lakebased on Trailing Twelve Month (TTM) revenue. Analyze their characteristics, revenue, occupancy rate, and ADR to understand what drives success in this market.
Lakeside Lodge—Secluded Family Getaway Sleeps 10
Entire Place • 4 bedrooms
A Pleasant Escape lake house *hot tub*
Entire Place • 3 bedrooms
Starry Cove, a lakeside cottage retreat!
Entire Place • 4 bedrooms

Becker Rentals
Entire Place • 2 bedrooms

Tiki Haus! Minutes to Peak N Peek - Skiing
Entire Place • 3 bedrooms

Lakeside Oasis in the Heart of Findley Lake
Entire Place • 3 bedrooms
Note: Performance varies based on location, size, amenities, seasonality, and management quality. Data reflects the past 12 months.
Top Performing Airbnb Hosts in Findley Lake (2025)
Learn from the best! This table showcases top-performing Airbnb hosts in Findley Lake based on the number of properties managed and estimated total revenue over the past year. Analyze their scale and performance metrics.
| Host Name | Properties | Grossing Revenue | Stay Reviews | Avg Rating |
|---|---|---|---|---|
| Laurie | 1 | $51,902 | 177 | 4.95/5.0 |
| Christianne | 1 | $49,829 | 65 | 4.88/5.0 |
| Tiffany | 1 | $41,709 | 93 | 4.96/5.0 |
| Pam | 2 | $35,559 | 19 | 4.60/5.0 |
| Leanne | 1 | $31,934 | 167 | 4.94/5.0 |
| Judy | 1 | $23,734 | 21 | 4.90/5.0 |
| Charlsea | 1 | $23,088 | 92 | 4.91/5.0 |
| Daniel | 1 | $19,596 | 12 | 5.00/5.0 |
| Stephen And Julie | 1 | $19,112 | 279 | 4.94/5.0 |
| Amanda | 1 | $17,898 | 8 | 4.50/5.0 |
Analyzing the strategies of top hosts, such as their property selection, pricing, and guest communication, can offer valuable lessons for optimizing your own Airbnb operations in Findley Lake.
Dive Deeper: Advanced Findley Lake STR Market Data (2025)
Ready to unlock more insights? AirROI provides access to advanced metrics and comprehensive Airbnb data for Findley Lake. Explore detailed analytics beyond this report to refine your investment strategy, optimize pricing, and maximize your vacation rental profits.
Explore Advanced MetricsFindley Lake Short-Term Rental Market Composition (2025): Property & Room Types
Room Type Distribution
Property Type Distribution
Market Composition Insights for Findley Lake
- The Findley Lake Airbnb market composition is heavily skewed towards Entire Home/Apt listings, which make up 100% of the 17 active rentals. This indicates strong guest preference for privacy and space.
- Looking at the property type distribution in Findley Lake, House properties are the most common (82.4%), reflecting the local real estate landscape.
- Houses represent a significant 82.4% portion, catering likely to families or larger groups.
Findley Lake Airbnb Room Capacity Analysis (2025): Bedroom Distribution
Distribution of Listings by Number of Bedrooms
Room Capacity Insights for Findley Lake
- The dominant room capacity in Findley Lake is 3 bedrooms listings, making up 29.4% of the market. This suggests a strong demand for properties suitable for families or small groups.
- Together, 3 bedrooms and 4 bedrooms properties represent 52.9% of the active Airbnb listings in Findley Lake, indicating a high concentration in these sizes.
- A significant 58.8% of listings offer 3+ bedrooms, catering to larger groups and families seeking more space in Findley Lake.
Findley Lake Vacation Rental Guest Capacity Trends (2025)
Distribution of Listings by Guest Capacity
Guest Capacity Insights for Findley Lake
- The most common guest capacity trend in Findley Lake vacation rentals is listings accommodating 8+ guests (58.8%). This suggests the primary traveler segment is likely larger groups.
- Properties designed for 8+ guests and 6 guests dominate the Findley Lake STR market, accounting for 82.3% of listings.
- 82.3% of properties accommodate 6+ guests, serving the market segment for larger families or group travel in Findley Lake.
- On average, properties in Findley Lake are equipped to host 6.8 guests.
Findley Lake Airbnb Booking Patterns (2025): Available vs. Booked Days
Available Days Distribution
Booked Days Distribution
Booking Pattern Insights for Findley Lake
- The most common availability pattern in Findley Lake falls within the 271-366 days range, representing 52.9% of listings. This suggests many properties have significant open periods on their calendars.
- Approximately 76.4% of listings show high availability (181+ days open annually), indicating potential for increased bookings or specific owner usage patterns.
- For booked days, the 31-90 days range is most frequent in Findley Lake (29.4%), reflecting common guest stay durations or potential owner blocking patterns.
- A notable 23.5% of properties secure long booking periods (181+ days booked per year), highlighting successful long-term rental strategies or significant owner usage.
Findley Lake Airbnb Minimum Stay Requirements Analysis
Distribution of Listings by Minimum Night Requirement
1 Night
5 listings
29.4% of total
2 Nights
7 listings
41.2% of total
3 Nights
2 listings
11.8% of total
4-6 Nights
2 listings
11.8% of total
7-29 Nights
1 listings
5.9% of total
Key Insights
- The most prevalent minimum stay requirement in Findley Lake is 2 Nights, adopted by 41.2% of listings. This highlights the market's preference for shorter, flexible bookings.
- A strong majority (70.6%) of the Findley Lake Airbnb data shows acceptance of very short stays (1-2 nights), indicating a dynamic, high-turnover market.
Recommendations
- Align with the market by considering a 2 Nights minimum stay, as 41.2% of Findley Lake hosts use this setting.
- If feasible, allowing 1-night stays, especially midweek or during low season, could capture last-minute bookings, as only 29.4% currently do.
- Adjust minimum nights based on seasonality – potentially shorter during low season and longer during peak demand periods in Findley Lake.
Findley Lake Airbnb Cancellation Policy Trends Analysis (2025)
Flexible
3 listings
17.6% of total
Moderate
6 listings
35.3% of total
Firm
5 listings
29.4% of total
Strict
3 listings
17.6% of total
Cancellation Policy Insights for Findley Lake
- The prevailing Airbnb cancellation policy trend in Findley Lake is Moderate, used by 35.3% of listings.
- There's a relatively balanced mix between guest-friendly (52.9%) and stricter (47.0%) policies, offering choices for different guest needs.
Recommendations for Hosts
- Consider adopting a Moderate policy to align with the 35.3% market standard in Findley Lake.
- Regularly review your cancellation policy against competitors and market demand shifts in Findley Lake.
Findley Lake STR Booking Lead Time Analysis (2025)
Average Booking Lead Time by Month
Booking Lead Time Insights for Findley Lake
- The overall average booking lead time for vacation rentals in Findley Lake is 58 days.
- Guests book furthest in advance for stays during April (average 120 days), likely coinciding with peak travel demand or local events.
- The shortest booking windows occur for stays in February (average 28 days), indicating more last-minute travel plans during this time.
- Seasonally, Summer (88 days avg.) sees the longest lead times, while Winter (51 days avg.) has the shortest, reflecting typical travel planning cycles.
Recommendations for Hosts
- Use the overall average lead time (58 days) as a baseline for your pricing and availability strategy in Findley Lake.
- For April stays, consider implementing length-of-stay discounts or slightly higher rates for bookings made less than 120 days out to capitalize on advance planning.
- Target marketing efforts for the Summer season well in advance (at least 88 days) to capture early planners.
- Monitor your own booking lead times against these Findley Lake averages to identify opportunities for dynamic pricing adjustments.
Popular & Essential Airbnb Amenities in Findley Lake (2025)
Amenity Prevalence
Amenity Insights for Findley Lake
- Essential amenities in Findley Lake that guests expect include: TV, Smoke alarm, Free parking on premises, Coffee maker, Fire extinguisher, Kitchen. Lacking these (any) could significantly impact bookings.
- Popular amenities like Heating, Wifi, Refrigerator are common but not universal. Offering these can provide a competitive edge.
- Warning: Wifi is not universally provided but is considered essential globally. Ensure reliable Wifi is offered.
Recommendations for Hosts
- Ensure your listing includes all essential amenities for Findley Lake: TV, Smoke alarm, Free parking on premises, Coffee maker, Fire extinguisher, Kitchen.
- Consider adding popular differentiators like Heating or Wifi to increase appeal.
- Highlight unique or less common amenities you offer (e.g., hot tub, dedicated workspace, EV charger) in your listing description and photos.
- Regularly check competitor amenities in Findley Lake to stay competitive.
Findley Lake Airbnb Guest Demographics & Profile Analysis (2025)
Guest Profile Summary for Findley Lake
- The typical guest profile for Airbnb in Findley Lake consists of primarily domestic travelers (97%), often arriving from nearby Pittsburgh, typically belonging to the Post-2000s (Gen Z/Alpha) group (50%), primarily speaking English or Spanish.
- Domestic travelers account for 96.5% of guests.
- Key international markets include United States (96.5%) and Canada (1.2%).
- Top languages spoken are English (85.9%) followed by Spanish (3.1%).
- A significant demographic segment is the Post-2000s (Gen Z/Alpha) group, representing 50% of guests.
Recommendations for Hosts
- Target domestic marketing efforts towards travelers from Pittsburgh and Buffalo.
- Tailor amenities and listing descriptions to appeal to the dominant Post-2000s (Gen Z/Alpha) demographic (e.g., highlight fast WiFi, smart home features, local guides).
- Highlight unique local experiences or amenities relevant to the primary guest profile.
- Consider seasonal promotions aligned with peak travel times for key origin markets.
Nearby Short-Term Rental Market Comparison
How does the Findley Lake Airbnb market stack up against its neighbors? Compare key performance metrics like average monthly revenue, ADR, and occupancy rates in surrounding areas to understand the broader regional STR landscape.
| Market | Active Properties | Monthly Revenue | Daily Rate | Avg. Occupancy |
|---|---|---|---|---|
| Town of Mansfield | 58 | $4,670 | $517.93 | 32% |
| Town of West Seneca | 15 | $4,337 | $246.11 | 52% |
| Town of Porter | 25 | $4,243 | $300.26 | 55% |
| Town of Ellicottville | 201 | $3,840 | $380.95 | 36% |
| Sandy Township | 21 | $3,681 | $239.13 | 47% |
| North East Township | 34 | $3,530 | $264.33 | 48% |
| Town of Elma | 10 | $3,377 | $418.28 | 48% |
| Niagara-on-the-Lake | 413 | $3,358 | $265.20 | 44% |
| Town of Orchard Park | 38 | $3,302 | $252.95 | 46% |
| Tonawanda Town | 21 | $3,213 | $206.17 | 53% |