Santa Fe Airbnb Market Analysis 2026: Short Term Rental Data & Vacation Rental Statistics in New Mexico, United States
Is Airbnb profitable in Santa Fe in 2026? Explore comprehensive Airbnb analytics for Santa Fe, New Mexico, United States to uncover income potential. This 2026 STR market report for Santa Fe, based on AirROI data from February 2025 to January 2026, reveals key trends in the bustling market of 1,746 active listings.
Whether you're considering an Airbnb investment in Santa Fe, optimizing your existing vacation rental, or exploring rental arbitrage opportunities, understanding the Santa Fe Airbnb data is crucial. Navigating the high regulation landscape is key to maximizing your short term rental income potential. Let's dive into the specifics.
Key Santa Fe Airbnb Performance Metrics Overview
Monthly Airbnb Revenue Variations & Income Potential in Santa Fe (2026)
Understanding the monthly revenue variations for Airbnb listings in Santa Fe is key to maximizing your short term rental income potential. Seasonality significantly impacts earnings. Our analysis, based on data from the past 12 months, shows that the peak revenue month for STRs in Santa Fe is typically October, while January often presents the lowest earnings, highlighting opportunities for strategic pricing adjustments during shoulder and low seasons. Explore the typical Airbnb income in Santa Fe across different performance tiers:
- Best-in-class properties (Top 10%) achieve $9,883+ monthly, often utilizing dynamic pricing and superior guest experiences.
- Strong performing properties (Top 25%) earn $6,383 or more, indicating effective management and desirable locations/amenities.
- Typical properties (Median) generate around $3,875 per month, representing the average market performance.
- Entry-level properties (Bottom 25%) see earnings around $2,186, often with potential for optimization.
Average Monthly Airbnb Earnings Trend in Santa Fe
Santa Fe Airbnb Occupancy Rate Trends (2026)
Maximize your bookings by understanding the Santa Fe STR occupancy trends. Seasonal demand shifts significantly influence how often properties are booked. Typically, Octobersees the highest demand (peak season occupancy), while January experiences the lowest (low season). Effective strategies, like adjusting minimum stays or offering promotions, can boost occupancy during slower periods. Here's how different property tiers perform in Santa Fe:
- Best-in-class properties (Top 10%) achieve 86%+ occupancy, indicating high desirability and potentially optimized availability.
- Strong performing properties (Top 25%) maintain 73% or higher occupancy, suggesting good market fit and guest satisfaction.
- Typical properties (Median) have an occupancy rate around 54%.
- Entry-level properties (Bottom 25%) average 31% occupancy, potentially facing higher vacancy.
Average Monthly Occupancy Rate Trend in Santa Fe
Average Daily Rate (ADR) Airbnb Trends in Santa Fe (2026)
Effective short term rental pricing strategy in Santa Fe involves understanding monthly ADR fluctuations. The Average Daily Rate (ADR) for Airbnb in Santa Fe typically peaks in October and dips lowest during February. Leveraging Airbnb dynamic pricing tools or strategies based on this seasonality can significantly boost revenue. Here's a look at the typical nightly rates achieved:
- Best-in-class properties (Top 10%) command rates of $580+ per night, often due to premium features or locations.
- Strong performing properties (Top 25%) achieve nightly rates of $375 or more.
- Typical properties (Median) charge around $246 per night.
- Entry-level properties (Bottom 25%) earn around $159 per night.
Average Daily Rate (ADR) Trend by Month in Santa Fe
Get Live Santa Fe Market Intelligence 👇

Explore Real-time Analytics
Airbnb Seasonality Analysis & Trends in Santa Fe (2026)
Peak Season (October, July, August)
- Revenue averages $6,359 per month
- Occupancy rates average 60.6%
- Daily rates average $331
Shoulder Season
- Revenue averages $5,112 per month
- Occupancy maintains around 51.9%
- Daily rates hold near $315
Low Season (January, February, April)
- Revenue drops to average $3,469 per month
- Occupancy decreases to average 42.3%
- Daily rates adjust to average $280
Seasonality Insights for Santa Fe
- The Airbnb seasonality in Santa Fe shows moderate seasonality with distinct peak and low periods. While the sections above show seasonal averages, it's also insightful to look at the extremes:
- During the high season, the absolute peak month showcases Santa Fe's highest earning potential, with monthly revenues capable of climbing to $6,379, occupancy reaching a high of 60.8%, and ADRs peaking at $343.
- Conversely, the slowest single month of the year, typically falling within the low season, marks the market's lowest point. In this month, revenue might dip to $3,143, occupancy could drop to 32.9%, and ADRs may adjust down to $263.
- Understanding both the seasonal averages and these monthly peaks and troughs in revenue, occupancy, and ADR is crucial for maximizing your Airbnb profit potential in Santa Fe.
Seasonal Strategies for Maximizing Profit
- Peak Season: Maximize revenue through premium pricing and potentially longer minimum stays. Ensure high availability.
- Low Season: Offer competitive pricing, special promotions (e.g., extended stay discounts), and flexible cancellation policies. Target off-season travelers like remote workers or budget-conscious guests.
- Shoulder Seasons: Implement dynamic pricing that balances peak and low rates. Target weekend travelers or specific events. Offer slightly more flexible terms than peak season.
- Regularly analyze your own performance against these Santa Fe seasonality benchmarks and adjust your pricing and availability strategy accordingly.
Best Areas for Airbnb Investment in Santa Fe (2026)
Exploring the top neighborhoods for short-term rentals in Santa Fe? This section highlights key areas, outlining why they are attractive for hosts and guests, along with notable local attractions. Consider these locations based on your target guest profile and investment strategy.
| Neighborhood / Area | Why Host Here? (Target Guests & Appeal) | Key Attractions & Landmarks |
|---|---|---|
| Downtown Santa Fe | The heart of Santa Fe featuring historic buildings, art galleries, and vibrant restaurants. It attracts tourists looking for cultural experiences and convenient access to local attractions. | Santa Fe Plaza, Loretto Chapel, Georgia O'Keeffe Museum, Palace of the Governors, Santa Fe Farmers Market |
| Railyard District | A revitalized area known for its arts, entertainment, and dining. Popular with younger visitors and those seeking a trendy atmosphere with walking access to events and art shows. | Railyard Park, Meow Wolf, Santa Fe Arts District, local artisan shops, farmers market |
| Canyon Road | Famous for its adobe homes and world-class art galleries, Canyon Road attracts art lovers and those searching for a picturesque and serene environment with access to numerous studios. | Canyon Road Arts District, high-end galleries, scenic views, Santa Fe River Park, historic adobe buildings |
| Bishop's Lodge | A luxurious area set in nature, appealing to those looking for relaxation and outdoor activities, making it a great spot for travelers seeking peace away from the city hustle. | Bishop's Lodge Resort, Santa Fe National Forest, hiking trails, spas, nature retreats |
| Testosterone | An up-and-coming area known for trendy new establishments and proximity to downtown, attracting a younger demographic and those interested in the city's evolving food and nightlife scene. | Santa Fe Brewing Company, trendy cafes, art installations, night spots, local boutiques |
| DeVargas Center | A shopping and dining hub that serves both locals and tourists, providing convenient access to shops, restaurants, and entertainment, making it an appealing spot for short-term stays. | DeVargas Mall, local shops, restaurants, movie theater, galleries |
| Ten Thousand Waves | A renowned Japanese-style spa located in a serene setting, ideal for travelers seeking wellness and relaxation experiences amidst stunning landscapes. | Ten Thousand Waves Spa, mountain views, tranquil gardens, hiking opportunities, yoga classes |
| La Fonda | A historic hotel and cultural landmark at the heart of Santa Fe, known for its authentic Southwestern ambiance. It attracts visitors wanting a rich local experience. | La Fonda Hotel, Santa Fe Plaza, historic architecture, local cuisine, cultural events |
Understanding Airbnb License Requirements & STR Laws in Santa Fe (2026)
Yes, Santa Fe, New Mexico, United States enforces high STR regulations. Obtaining a license and ensuring compliance is almost certainly required according to current 2026 STR laws. Always verify the latest short term rental regulations and Airbnb license requirements directly with local government authorities for Santa Fe to ensure full compliance before hosting.
(Source: AirROI data, 2026, based on 68% licensed listings)
Top Performing Airbnb Properties in Santa Fe (2026)
Benchmark your potential! Explore examples of top-performing Airbnb properties in Santa Febased on Trailing Twelve Month (TTM) revenue. Analyze their characteristics, revenue, occupancy rate, and ADR to understand what drives success in this market.

Ski Discounts! Luxury Estate with Hot Tub
Entire Place • 6 bedrooms

Dos Hermanas 4, 5, 6 & 8| Walk to Plaza| Courtyard
Entire Place • 4 bedrooms

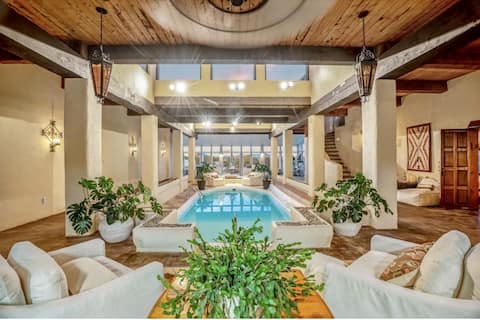
Cinco Chimineas - Heated Indoor Pool
Entire Place • 5 bedrooms
Indoor heated pool minutes to downtown Santa Fe
Entire Place • 7 bedrooms
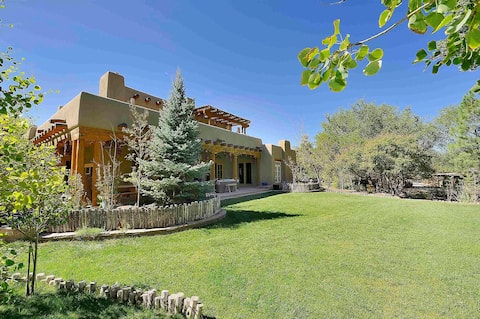
Green Acres Luxury Estate on 4 Acres 8m to Plaza!
Entire Place • 7 bedrooms

Las Alondras - Amazing Views, Hot Tub
Entire Place • 5 bedrooms
Note: Performance varies based on location, size, amenities, seasonality, and management quality. Data reflects the past 12 months.
Top Performing Airbnb Hosts in Santa Fe (2026)
Learn from the best! This table showcases top-performing Airbnb hosts in Santa Fe based on the number of properties managed and estimated total revenue over the past year. Analyze their scale and performance metrics.
| Host Name | Properties | Grossing Revenue | Stay Reviews | Avg Rating |
|---|---|---|---|---|
| Two Casitas | 106 | $12,498,257 | 7914 | 4.94/5.0 |
| A Vacation Different | 39 | $3,379,048 | 1647 | 4.94/5.0 |
| Kokopelli Property Management | 59 | $2,080,227 | 760 | 4.62/5.0 |
| Evolve | 34 | $1,822,349 | 1623 | 4.81/5.0 |
| All Seasons Resort Lodging | 57 | $1,753,698 | 377 | 4.52/5.0 |
| Casas De Santa Fe | 40 | $1,315,523 | 428 | 4.76/5.0 |
| Susan | 12 | $1,312,352 | 816 | 4.90/5.0 |
| Mo | 16 | $1,293,565 | 582 | 4.91/5.0 |
| AdobeStar Vacation Rentals | 24 | $1,145,415 | 1357 | 4.92/5.0 |
| AdobeStar Vacation Rentals | 18 | $907,142 | 493 | 4.92/5.0 |
Analyzing the strategies of top hosts, such as their property selection, pricing, and guest communication, can offer valuable lessons for optimizing your own Airbnb operations in Santa Fe.
Dive Deeper: Advanced Santa Fe STR Market Data (2026)
Ready to unlock more insights? AirROI provides access to advanced metrics and comprehensive Airbnb data for Santa Fe. Explore detailed analytics beyond this report to refine your investment strategy, optimize pricing, and maximize your vacation rental profits.
Explore Advanced MetricsSanta Fe Short-Term Rental Market Composition (2026): Property & Room Types
Room Type Distribution
Property Type Distribution
Market Composition Insights for Santa Fe
- The Santa Fe Airbnb market composition is heavily skewed towards Entire Home/Apt listings, which make up 92% of the 1,746 active rentals. This indicates strong guest preference for privacy and space.
- Looking at the property type distribution in Santa Fe, House properties are the most common (62.3%), reflecting the local real estate landscape.
- Houses represent a significant 62.3% portion, catering likely to families or larger groups.
- The presence of 12.9% Hotel/Boutique listings indicates integration with traditional hospitality.
- Smaller segments like others, outdoor/unique, unique stays (combined 5.6%) offer potential for unique stay experiences.
Santa Fe Airbnb Room Capacity Analysis (2026): Bedroom Distribution
Distribution of Listings by Number of Bedrooms
Room Capacity Insights for Santa Fe
- The dominant room capacity in Santa Fe is 1 bedroom listings, making up 33.2% of the market. This suggests a strong demand for properties suitable for couples or solo travelers.
- Together, 1 bedroom and 2 bedrooms properties represent 65.9% of the active Airbnb listings in Santa Fe, indicating a high concentration in these sizes.
- A significant 25.7% of listings offer 3+ bedrooms, catering to larger groups and families seeking more space in Santa Fe.
Santa Fe Vacation Rental Guest Capacity Trends (2026)
Distribution of Listings by Guest Capacity
Guest Capacity Insights for Santa Fe
- The most common guest capacity trend in Santa Fe vacation rentals is listings accommodating 4 guests (29.8%). This suggests the primary traveler segment is likely small families or groups.
- Properties designed for 4 guests and 2 guests dominate the Santa Fe STR market, accounting for 56.9% of listings.
- 31.2% of properties accommodate 6+ guests, serving the market segment for larger families or group travel in Santa Fe.
- On average, properties in Santa Fe are equipped to host 4.1 guests.
Santa Fe Airbnb Booking Patterns (2026): Available vs. Booked Days
Available Days Distribution
Booked Days Distribution
Booking Pattern Insights for Santa Fe
- The most common availability pattern in Santa Fe falls within the 271-366 days range, representing 31.3% of listings. This suggests many properties have significant open periods on their calendars.
- Approximately 59.0% of listings show high availability (181+ days open annually), indicating potential for increased bookings or specific owner usage patterns.
- For booked days, the 181-270 days range is most frequent in Santa Fe (31.3%), reflecting common guest stay durations or potential owner blocking patterns.
- A notable 42.1% of properties secure long booking periods (181+ days booked per year), highlighting successful long-term rental strategies or significant owner usage.
Santa Fe Airbnb Minimum Stay Requirements Analysis
Distribution of Listings by Minimum Night Requirement
1 Night
281 listings
16.1% of total
2 Nights
266 listings
15.2% of total
3 Nights
175 listings
10% of total
4-6 Nights
115 listings
6.6% of total
7-29 Nights
70 listings
4% of total
30+ Nights
839 listings
48.1% of total
Key Insights
- The most prevalent minimum stay requirement in Santa Fe is 30+ Nights, adopted by 48.1% of listings. This highlights the market's preference for longer commitments.
- A significant segment (48.1%) caters to monthly stays (30+ nights) in Santa Fe, pointing to opportunities in the extended-stay market.
Recommendations
- Align with the market by considering a 30+ Nights minimum stay, as 48.1% of Santa Fe hosts use this setting.
- If feasible, allowing 1-night stays, especially midweek or during low season, could capture last-minute bookings, as only 16.1% currently do.
- Explore offering discounts for stays of 30+ nights to attract the 48.1% of the market seeking extended stays.
- Adjust minimum nights based on seasonality – potentially shorter during low season and longer during peak demand periods in Santa Fe.
Santa Fe Airbnb Cancellation Policy Trends Analysis (2026)
Non-refundable
2 listings
0.1% of total
Limited
39 listings
2.2% of total
Super Strict 60 Days
103 listings
5.9% of total
Super Strict 30 Days
148 listings
8.5% of total
Flexible
169 listings
9.7% of total
Moderate
485 listings
27.8% of total
Firm
613 listings
35.2% of total
Strict
184 listings
10.6% of total
Cancellation Policy Insights for Santa Fe
- The prevailing Airbnb cancellation policy trend in Santa Fe is Firm, used by 35.2% of listings.
- There's a relatively balanced mix between guest-friendly (37.5%) and stricter (45.8%) policies, offering choices for different guest needs.
Recommendations for Hosts
- Consider adopting a Firm policy to align with the 35.2% market standard in Santa Fe.
- Using a Strict policy might deter some guests, as only 10.6% of listings use it. Evaluate if potential revenue protection outweighs possible lower booking rates.
- Regularly review your cancellation policy against competitors and market demand shifts in Santa Fe.
Santa Fe STR Booking Lead Time Analysis (2026)
Average Booking Lead Time by Month
Booking Lead Time Insights for Santa Fe
- The overall average booking lead time for vacation rentals in Santa Fe is 58 days.
- Guests book furthest in advance for stays during August (average 77 days), likely coinciding with peak travel demand or local events.
- The shortest booking windows occur for stays in January (average 37 days), indicating more last-minute travel plans during this time.
- Seasonally, Summer (66 days avg.) sees the longest lead times, while Winter (46 days avg.) has the shortest, reflecting typical travel planning cycles.
Recommendations for Hosts
- Use the overall average lead time (58 days) as a baseline for your pricing and availability strategy in Santa Fe.
- For August stays, consider implementing length-of-stay discounts or slightly higher rates for bookings made less than 77 days out to capitalize on advance planning.
- Target marketing efforts for the Summer season well in advance (at least 66 days) to capture early planners.
- Monitor your own booking lead times against these Santa Fe averages to identify opportunities for dynamic pricing adjustments.
Popular & Essential Airbnb Amenities in Santa Fe (2026)
Amenity Prevalence
Amenity Insights for Santa Fe
- Essential amenities in Santa Fe that guests expect include: Wifi, Smoke alarm, Heating. Lacking these (any) could significantly impact bookings.
- Popular amenities like Free parking on premises, Fire extinguisher, Hot water are common but not universal. Offering these can provide a competitive edge.
Recommendations for Hosts
- Ensure your listing includes all essential amenities for Santa Fe: Wifi, Smoke alarm, Heating.
- Prioritize adding missing essentials: Wifi, Smoke alarm, Heating.
- Consider adding popular differentiators like Free parking on premises or Fire extinguisher to increase appeal.
- Highlight unique or less common amenities you offer (e.g., hot tub, dedicated workspace, EV charger) in your listing description and photos.
- Regularly check competitor amenities in Santa Fe to stay competitive.
Santa Fe Airbnb Guest Demographics & Profile Analysis (2026)
Guest Profile Summary for Santa Fe
- The typical guest profile for Airbnb in Santa Fe consists of primarily domestic travelers (96%), often arriving from nearby Denver, typically belonging to the Post-2000s (Gen Z/Alpha) group (50%), primarily speaking English or Spanish.
- Domestic travelers account for 96.1% of guests.
- Key international markets include United States (96.1%) and DC (0.9%).
- Top languages spoken are English (66.2%) followed by Spanish (16.1%).
- A significant demographic segment is the Post-2000s (Gen Z/Alpha) group, representing 50% of guests.
Recommendations for Hosts
- Target domestic marketing efforts towards travelers from Denver and Austin.
- Tailor amenities and listing descriptions to appeal to the dominant Post-2000s (Gen Z/Alpha) demographic (e.g., highlight fast WiFi, smart home features, local guides).
- Highlight unique local experiences or amenities relevant to the primary guest profile.
- Consider seasonal promotions aligned with peak travel times for key origin markets.
Nearby Short-Term Rental Market Comparison
How does the Santa Fe Airbnb market stack up against its neighbors? Compare key performance metrics like average monthly revenue, ADR, and occupancy rates in surrounding areas to understand the broader regional STR landscape.
| Market | Active Properties | Monthly Revenue | Daily Rate | Avg. Occupancy |
|---|---|---|---|---|
| Valdez | 31 | $3,145 | $354.77 | 34% |
| Arroyo Seco | 59 | $3,119 | $351.72 | 37% |
| Jemez Springs | 40 | $3,085 | $211.27 | 52% |
| El Prado | 221 | $3,016 | $256.61 | 45% |
| Abiquiu | 38 | $2,868 | $222.67 | 51% |
| Tres Piedras | 18 | $2,836 | $191.25 | 49% |
| Placitas | 30 | $2,714 | $233.44 | 49% |
| Dixon | 10 | $2,710 | $162.61 | 55% |
| Angel Fire | 693 | $2,706 | $381.30 | 32% |
| Lamy | 10 | $2,608 | $335.73 | 42% |