High Rolls Airbnb Market Analysis 2026: Short Term Rental Data & Vacation Rental Statistics in New Mexico, United States
Is Airbnb profitable in High Rolls in 2026? Explore comprehensive Airbnb analytics for High Rolls, New Mexico, United States to uncover income potential. This 2026 STR market report for High Rolls, based on AirROI data from February 2025 to January 2026, reveals key trends in the niche market of 35 active listings.
Whether you're considering an Airbnb investment in High Rolls, optimizing your existing vacation rental, or exploring rental arbitrage opportunities, understanding the High Rolls Airbnb data is crucial. Leveraging the low regulation environment is key to maximizing your short term rental income potential. Let's dive into the specifics.
Key High Rolls Airbnb Performance Metrics Overview
Monthly Airbnb Revenue Variations & Income Potential in High Rolls (2026)
Understanding the monthly revenue variations for Airbnb listings in High Rolls is key to maximizing your short term rental income potential. Seasonality significantly impacts earnings. Our analysis, based on data from the past 12 months, shows that the peak revenue month for STRs in High Rolls is typically March, while May often presents the lowest earnings, highlighting opportunities for strategic pricing adjustments during shoulder and low seasons. Explore the typical Airbnb income in High Rolls across different performance tiers:
- Best-in-class properties (Top 10%) achieve $4,419+ monthly, often utilizing dynamic pricing and superior guest experiences.
- Strong performing properties (Top 25%) earn $2,651 or more, indicating effective management and desirable locations/amenities.
- Typical properties (Median) generate around $1,531 per month, representing the average market performance.
- Entry-level properties (Bottom 25%) see earnings around $905, often with potential for optimization.
Average Monthly Airbnb Earnings Trend in High Rolls
High Rolls Airbnb Occupancy Rate Trends (2026)
Maximize your bookings by understanding the High Rolls STR occupancy trends. Seasonal demand shifts significantly influence how often properties are booked. Typically, Marchsees the highest demand (peak season occupancy), while January experiences the lowest (low season). Effective strategies, like adjusting minimum stays or offering promotions, can boost occupancy during slower periods. Here's how different property tiers perform in High Rolls:
- Best-in-class properties (Top 10%) achieve 68%+ occupancy, indicating high desirability and potentially optimized availability.
- Strong performing properties (Top 25%) maintain 53% or higher occupancy, suggesting good market fit and guest satisfaction.
- Typical properties (Median) have an occupancy rate around 36%.
- Entry-level properties (Bottom 25%) average 22% occupancy, potentially facing higher vacancy.
Average Monthly Occupancy Rate Trend in High Rolls
Average Daily Rate (ADR) Airbnb Trends in High Rolls (2026)
Effective short term rental pricing strategy in High Rolls involves understanding monthly ADR fluctuations. The Average Daily Rate (ADR) for Airbnb in High Rolls typically peaks in December and dips lowest during April. Leveraging Airbnb dynamic pricing tools or strategies based on this seasonality can significantly boost revenue. Here's a look at the typical nightly rates achieved:
- Best-in-class properties (Top 10%) command rates of $300+ per night, often due to premium features or locations.
- Strong performing properties (Top 25%) achieve nightly rates of $215 or more.
- Typical properties (Median) charge around $135 per night.
- Entry-level properties (Bottom 25%) earn around $100 per night.
Average Daily Rate (ADR) Trend by Month in High Rolls
Get Live High Rolls Market Intelligence 👇

Explore Real-time Analytics
Airbnb Seasonality Analysis & Trends in High Rolls (2026)
Peak Season (March, July, August)
- Revenue averages $2,506 per month
- Occupancy rates average 42.2%
- Daily rates average $175
Shoulder Season
- Revenue averages $2,221 per month
- Occupancy maintains around 39.8%
- Daily rates hold near $182
Low Season (January, April, May)
- Revenue drops to average $1,828 per month
- Occupancy decreases to average 35.1%
- Daily rates adjust to average $172
Seasonality Insights for High Rolls
- The Airbnb seasonality in High Rolls shows moderate seasonality with distinct peak and low periods. While the sections above show seasonal averages, it's also insightful to look at the extremes:
- During the high season, the absolute peak month showcases High Rolls's highest earning potential, with monthly revenues capable of climbing to $2,587, occupancy reaching a high of 44.7%, and ADRs peaking at $197.
- Conversely, the slowest single month of the year, typically falling within the low season, marks the market's lowest point. In this month, revenue might dip to $1,755, occupancy could drop to 25.9%, and ADRs may adjust down to $163.
- Understanding both the seasonal averages and these monthly peaks and troughs in revenue, occupancy, and ADR is crucial for maximizing your Airbnb profit potential in High Rolls.
Seasonal Strategies for Maximizing Profit
- Peak Season: Maximize revenue through premium pricing and potentially longer minimum stays. Ensure high availability.
- Low Season: Offer competitive pricing, special promotions (e.g., extended stay discounts), and flexible cancellation policies. Target off-season travelers like remote workers or budget-conscious guests.
- Shoulder Seasons: Implement dynamic pricing that balances peak and low rates. Target weekend travelers or specific events. Offer slightly more flexible terms than peak season.
- Regularly analyze your own performance against these High Rolls seasonality benchmarks and adjust your pricing and availability strategy accordingly.
Best Areas for Airbnb Investment in High Rolls (2026)
Exploring the top neighborhoods for short-term rentals in High Rolls? This section highlights key areas, outlining why they are attractive for hosts and guests, along with notable local attractions. Consider these locations based on your target guest profile and investment strategy.
| Neighborhood / Area | Why Host Here? (Target Guests & Appeal) | Key Attractions & Landmarks |
|---|---|---|
| High Rolls | A picturesque mountain community known for its stunning natural beauty and tranquility. Attracts tourists seeking a peaceful retreat from city life, with opportunities for outdoor activities such as hiking and stargazing. | Cloudcroft, Lincoln National Forest, Sacramento Mountains, White Sands National Park, Sunspot Solar Observatory |
| Cloudcroft | A nearby charming village located at a high elevation, popular with tourists for its cool summer temperatures and beautiful scenery. Perfect for visitors looking for an escape into nature with various hiking trails and local shops. | Cloudcroft's historic district, Osha Trail, Sacramento Peak Observatory, Cloudcroft Lodge, New Mexico Rails-to-Trails |
| Alamogordo | The nearest city offering more amenities and attractions, making it a good base for visitors exploring the nearby natural wonders. Offers diverse restaurants and shopping opportunities, appealing to families and tourists. | New Mexico Museum of Space History, Alameda Park Zoo, White Sands National Park, Toy Train Depot, Alamogordo's weekly farmer's market |
| White Sands | Famous for its stunning white dunes, an incredible natural wonder that draws visitors from around the world. Ideal for those seeking unique photography opportunities and adventurous activities. | White Sands National Park, Dune Sledding, Sunset Strolls, Annual White Sands Music Festival, Photography events |
| Ruidoso | A popular resort town nearby known for skiing in winter and horse racing in summer. Attracts a variety of tourists, especially families and outdoor enthusiasts, offering year-round activities. | Ruidoso Downs Race Track, Ski Apache, Billy the Kid Casino, Ingram Beach, Grindstone Lake |
| Tularosa | A quaint village with rich history and charm, appealing to visitors who wish to learn about local culture and heritage while enjoying the nearby natural landscape. | Tularosa's Historic District, Tularosa Basin Museum, San Andres Mountains, Annual Tularosa Festival, Local artisan shops |
| Cedar Crest | A beautiful community that offers mountain living close to Albuquerque, making it appealing for those looking to escape city life while still having access to urban amenities. | Sandia Mountains, Cedar Crest Village, Pine Flat Campgrounds, La Luz Trail, Wildlife watching opportunities |
| Holloman Air Force Base | An area with a unique military presence attracting visiting families and personnel. Opportunities for short-term stays and accommodations for military personnel and their families. | Holloman Air Force Base Attractions, Wingate Park, Local dining options overflowed with American cuisine, Base-sponsored events and activities, Proximity to White Sands |
Understanding Airbnb License Requirements & STR Laws in High Rolls (2026)
While High Rolls, New Mexico, United States currently shows low STR regulations, specific Airbnb license requirements might still exist or change. Always verify the latest short term rental regulations and Airbnb license requirements directly with local government authorities for High Rolls to ensure full compliance before hosting.
(Source: AirROI data, 2026, finding no licensed listings among those analyzed)
Top Performing Airbnb Properties in High Rolls (2026)
Benchmark your potential! Explore examples of top-performing Airbnb properties in High Rollsbased on Trailing Twelve Month (TTM) revenue. Analyze their characteristics, revenue, occupancy rate, and ADR to understand what drives success in this market.

Entire Cloudcroft Hostel
Entire Place • 5 bedrooms

The Four Seasons: Mtn Cabin w/ Hot Tub & Fireplace
Entire Place • 5 bedrooms

Modern Farmhouse Cabin in High Rolls, NM
Entire Place • 4 bedrooms
Rustic Adobe Farmhouse Retreat w/Mountain Views
Entire Place • 2 bedrooms
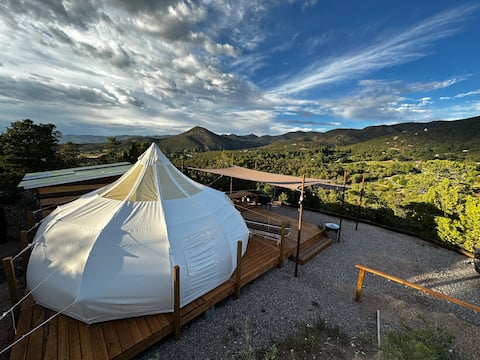
El Campo Glamping - The First
Entire Place • 1 bedroom

Elk Ridge Cabin
Entire Place • 1 bedroom
Note: Performance varies based on location, size, amenities, seasonality, and management quality. Data reflects the past 12 months.
Top Performing Airbnb Hosts in High Rolls (2026)
Learn from the best! This table showcases top-performing Airbnb hosts in High Rolls based on the number of properties managed and estimated total revenue over the past year. Analyze their scale and performance metrics.
| Host Name | Properties | Grossing Revenue | Stay Reviews | Avg Rating |
|---|---|---|---|---|
| Stephanie G | 7 | $159,621 | 1466 | 4.88/5.0 |
| Homee LLC. | 4 | $84,917 | 247 | 4.85/5.0 |
| Ivanna | 1 | $83,924 | 86 | 4.88/5.0 |
| Jessica | 1 | $69,838 | 22 | 4.95/5.0 |
| Jessica And Rigo | 2 | $54,433 | 248 | 4.91/5.0 |
| Anjelica | 5 | $42,117 | 826 | 4.91/5.0 |
| Sonya | 1 | $35,104 | 24 | 5.00/5.0 |
| Toni | 3 | $33,090 | 259 | 4.87/5.0 |
| Jodi | 2 | $33,078 | 291 | 4.93/5.0 |
| Steve And Holly | 1 | $32,760 | 195 | 4.96/5.0 |
Analyzing the strategies of top hosts, such as their property selection, pricing, and guest communication, can offer valuable lessons for optimizing your own Airbnb operations in High Rolls.
Dive Deeper: Advanced High Rolls STR Market Data (2026)
Ready to unlock more insights? AirROI provides access to advanced metrics and comprehensive Airbnb data for High Rolls. Explore detailed analytics beyond this report to refine your investment strategy, optimize pricing, and maximize your vacation rental profits.
Explore Advanced MetricsHigh Rolls Short-Term Rental Market Composition (2026): Property & Room Types
Room Type Distribution
Property Type Distribution
Market Composition Insights for High Rolls
- The High Rolls Airbnb market composition is heavily skewed towards Entire Home/Apt listings, which make up 82.9% of the 35 active rentals. This indicates strong guest preference for privacy and space.
- Looking at the property type distribution in High Rolls, Outdoor/Unique properties are the most common (31.4%), reflecting the local real estate landscape.
- Houses represent a significant 20% portion, catering likely to families or larger groups.
- The presence of 25.7% Hotel/Boutique listings indicates integration with traditional hospitality.
- Smaller segments like unique stays (combined 2.9%) offer potential for unique stay experiences.
High Rolls Airbnb Room Capacity Analysis (2026): Bedroom Distribution
Distribution of Listings by Number of Bedrooms
Room Capacity Insights for High Rolls
- The dominant room capacity in High Rolls is 1 bedroom listings, making up 40% of the market. This suggests a strong demand for properties suitable for couples or solo travelers.
- Together, 1 bedroom and 2 bedrooms properties represent 62.9% of the active Airbnb listings in High Rolls, indicating a high concentration in these sizes.
- A significant 28.6% of listings offer 3+ bedrooms, catering to larger groups and families seeking more space in High Rolls.
High Rolls Vacation Rental Guest Capacity Trends (2026)
Distribution of Listings by Guest Capacity
Guest Capacity Insights for High Rolls
- The most common guest capacity trend in High Rolls vacation rentals is listings accommodating 4 guests (31.4%). This suggests the primary traveler segment is likely small families or groups.
- Properties designed for 4 guests and 8+ guests dominate the High Rolls STR market, accounting for 54.3% of listings.
- 40.0% of properties accommodate 6+ guests, serving the market segment for larger families or group travel in High Rolls.
- On average, properties in High Rolls are equipped to host 4.8 guests.
High Rolls Airbnb Booking Patterns (2026): Available vs. Booked Days
Available Days Distribution
Booked Days Distribution
Booking Pattern Insights for High Rolls
- The most common availability pattern in High Rolls falls within the 181-270 days range, representing 48.6% of listings. This suggests many properties have significant open periods on their calendars.
- Approximately 82.9% of listings show high availability (181+ days open annually), indicating potential for increased bookings or specific owner usage patterns.
- For booked days, the 91-180 days range is most frequent in High Rolls (48.6%), reflecting common guest stay durations or potential owner blocking patterns.
- A notable 17.1% of properties secure long booking periods (181+ days booked per year), highlighting successful long-term rental strategies or significant owner usage.
High Rolls Airbnb Minimum Stay Requirements Analysis
Distribution of Listings by Minimum Night Requirement
1 Night
13 listings
37.1% of total
2 Nights
17 listings
48.6% of total
30+ Nights
5 listings
14.3% of total
Key Insights
- The most prevalent minimum stay requirement in High Rolls is 2 Nights, adopted by 48.6% of listings. This highlights the market's preference for shorter, flexible bookings.
- A strong majority (85.7%) of the High Rolls Airbnb data shows acceptance of very short stays (1-2 nights), indicating a dynamic, high-turnover market.
- A significant segment (14.3%) caters to monthly stays (30+ nights) in High Rolls, pointing to opportunities in the extended-stay market.
Recommendations
- Align with the market by considering a 2 Nights minimum stay, as 48.6% of High Rolls hosts use this setting.
- Explore offering discounts for stays of 30+ nights to attract the 14.3% of the market seeking extended stays.
- Adjust minimum nights based on seasonality – potentially shorter during low season and longer during peak demand periods in High Rolls.
High Rolls Airbnb Cancellation Policy Trends Analysis (2026)
Super Strict 30 Days
1 listings
2.9% of total
Flexible
9 listings
25.7% of total
Moderate
11 listings
31.4% of total
Firm
9 listings
25.7% of total
Strict
5 listings
14.3% of total
Cancellation Policy Insights for High Rolls
- The prevailing Airbnb cancellation policy trend in High Rolls is Moderate, used by 31.4% of listings.
- There's a relatively balanced mix between guest-friendly (57.1%) and stricter (40.0%) policies, offering choices for different guest needs.
Recommendations for Hosts
- Consider adopting a Moderate policy to align with the 31.4% market standard in High Rolls.
- Using a Strict policy might deter some guests, as only 14.3% of listings use it. Evaluate if potential revenue protection outweighs possible lower booking rates.
- Regularly review your cancellation policy against competitors and market demand shifts in High Rolls.
High Rolls STR Booking Lead Time Analysis (2026)
Average Booking Lead Time by Month
Booking Lead Time Insights for High Rolls
- The overall average booking lead time for vacation rentals in High Rolls is 33 days.
- Guests book furthest in advance for stays during December (average 63 days), likely coinciding with peak travel demand or local events.
- The shortest booking windows occur for stays in February (average 18 days), indicating more last-minute travel plans during this time.
- Seasonally, Winter (37 days avg.) sees the longest lead times, while Summer (33 days avg.) has the shortest, reflecting typical travel planning cycles.
Recommendations for Hosts
- Use the overall average lead time (33 days) as a baseline for your pricing and availability strategy in High Rolls.
- For December stays, consider implementing length-of-stay discounts or slightly higher rates for bookings made less than 63 days out to capitalize on advance planning.
- Target marketing efforts for the Winter season well in advance (at least 37 days) to capture early planners.
- Monitor your own booking lead times against these High Rolls averages to identify opportunities for dynamic pricing adjustments.
Popular & Essential Airbnb Amenities in High Rolls (2026)
Amenity Prevalence
Amenity Insights for High Rolls
- Essential amenities in High Rolls that guests expect include: Wifi, Fire extinguisher, Hot water, Coffee maker, Free parking on premises, Heating. Lacking these (any) could significantly impact bookings.
- Popular amenities like Bed linens, Smoke alarm, Refrigerator are common but not universal. Offering these can provide a competitive edge.
Recommendations for Hosts
- Ensure your listing includes all essential amenities for High Rolls: Wifi, Fire extinguisher, Hot water, Coffee maker, Free parking on premises, Heating.
- Prioritize adding missing essentials: Coffee maker, Free parking on premises, Heating.
- Consider adding popular differentiators like Bed linens or Smoke alarm to increase appeal.
- Highlight unique or less common amenities you offer (e.g., hot tub, dedicated workspace, EV charger) in your listing description and photos.
- Regularly check competitor amenities in High Rolls to stay competitive.
High Rolls Airbnb Guest Demographics & Profile Analysis (2026)
Guest Profile Summary for High Rolls
- The typical guest profile for Airbnb in High Rolls consists of primarily domestic travelers (95%), often arriving from nearby El Paso, typically belonging to the Post-2000s (Gen Z/Alpha) group (50%), primarily speaking English or Spanish.
- Domestic travelers account for 95.4% of guests.
- Key international markets include United States (95.4%) and Mexico (1.6%).
- Top languages spoken are English (65.2%) followed by Spanish (22.7%).
- A significant demographic segment is the Post-2000s (Gen Z/Alpha) group, representing 50% of guests.
Recommendations for Hosts
- Target domestic marketing efforts towards travelers from El Paso and Austin.
- Tailor amenities and listing descriptions to appeal to the dominant Post-2000s (Gen Z/Alpha) demographic (e.g., highlight fast WiFi, smart home features, local guides).
- Highlight unique local experiences or amenities relevant to the primary guest profile.
- Consider seasonal promotions aligned with peak travel times for key origin markets.
Nearby Short-Term Rental Market Comparison
How does the High Rolls Airbnb market stack up against its neighbors? Compare key performance metrics like average monthly revenue, ADR, and occupancy rates in surrounding areas to understand the broader regional STR landscape.
| Market | Active Properties | Monthly Revenue | Daily Rate | Avg. Occupancy |
|---|---|---|---|---|
| Alto | 120 | $3,065 | $372.00 | 33% |
| Ruidoso | 1,135 | $2,301 | $285.33 | 31% |
| Cloudcroft | 198 | $2,130 | $190.66 | 42% |
| Carlsbad | 170 | $2,001 | $145.24 | 51% |
| Alamogordo | 85 | $1,868 | $153.86 | 48% |
| Roswell | 100 | $1,866 | $186.25 | 43% |
| Lincoln County | 11 | $1,820 | $364.86 | 28% |
| Las Cruces | 471 | $1,672 | $140.43 | 47% |
| Nogal | 19 | $1,660 | $210.11 | 23% |
| Mesilla | 45 | $1,562 | $131.94 | 45% |