Alto Airbnb Market Analysis 2026: Short Term Rental Data & Vacation Rental Statistics in New Mexico, United States
Is Airbnb profitable in Alto in 2026? Explore comprehensive Airbnb analytics for Alto, New Mexico, United States to uncover income potential. This 2026 STR market report for Alto, based on AirROI data from February 2025 to January 2026, reveals key trends in the niche market of 120 active listings.
Whether you're considering an Airbnb investment in Alto, optimizing your existing vacation rental, or exploring rental arbitrage opportunities, understanding the Alto Airbnb data is crucial. Leveraging the low regulation environment is key to maximizing your short term rental income potential. Let's dive into the specifics.
Key Alto Airbnb Performance Metrics Overview
Monthly Airbnb Revenue Variations & Income Potential in Alto (2026)
Understanding the monthly revenue variations for Airbnb listings in Alto is key to maximizing your short term rental income potential. Seasonality significantly impacts earnings. Our analysis, based on data from the past 12 months, shows that the peak revenue month for STRs in Alto is typically December, while April often presents the lowest earnings, highlighting opportunities for strategic pricing adjustments during shoulder and low seasons. Explore the typical Airbnb income in Alto across different performance tiers:
- Best-in-class properties (Top 10%) achieve $8,066+ monthly, often utilizing dynamic pricing and superior guest experiences.
- Strong performing properties (Top 25%) earn $5,102 or more, indicating effective management and desirable locations/amenities.
- Typical properties (Median) generate around $3,028 per month, representing the average market performance.
- Entry-level properties (Bottom 25%) see earnings around $1,661, often with potential for optimization.
Average Monthly Airbnb Earnings Trend in Alto
Alto Airbnb Occupancy Rate Trends (2026)
Maximize your bookings by understanding the Alto STR occupancy trends. Seasonal demand shifts significantly influence how often properties are booked. Typically, Julysees the highest demand (peak season occupancy), while January experiences the lowest (low season). Effective strategies, like adjusting minimum stays or offering promotions, can boost occupancy during slower periods. Here's how different property tiers perform in Alto:
- Best-in-class properties (Top 10%) achieve 68%+ occupancy, indicating high desirability and potentially optimized availability.
- Strong performing properties (Top 25%) maintain 49% or higher occupancy, suggesting good market fit and guest satisfaction.
- Typical properties (Median) have an occupancy rate around 29%.
- Entry-level properties (Bottom 25%) average 17% occupancy, potentially facing higher vacancy.
Average Monthly Occupancy Rate Trend in Alto
Average Daily Rate (ADR) Airbnb Trends in Alto (2026)
Effective short term rental pricing strategy in Alto involves understanding monthly ADR fluctuations. The Average Daily Rate (ADR) for Airbnb in Alto typically peaks in December and dips lowest during April. Leveraging Airbnb dynamic pricing tools or strategies based on this seasonality can significantly boost revenue. Here's a look at the typical nightly rates achieved:
- Best-in-class properties (Top 10%) command rates of $623+ per night, often due to premium features or locations.
- Strong performing properties (Top 25%) achieve nightly rates of $439 or more.
- Typical properties (Median) charge around $321 per night.
- Entry-level properties (Bottom 25%) earn around $225 per night.
Average Daily Rate (ADR) Trend by Month in Alto
Get Live Alto Market Intelligence 👇

Explore Real-time Analytics
Airbnb Seasonality Analysis & Trends in Alto (2026)
Peak Season (December, July, August)
- Revenue averages $5,174 per month
- Occupancy rates average 40.9%
- Daily rates average $395
Shoulder Season
- Revenue averages $3,758 per month
- Occupancy maintains around 35.1%
- Daily rates hold near $354
Low Season (January, April, October)
- Revenue drops to average $2,879 per month
- Occupancy decreases to average 28.4%
- Daily rates adjust to average $355
Seasonality Insights for Alto
- The Airbnb seasonality in Alto shows highly seasonal trends requiring careful strategy. While the sections above show seasonal averages, it's also insightful to look at the extremes:
- During the high season, the absolute peak month showcases Alto's highest earning potential, with monthly revenues capable of climbing to $5,560, occupancy reaching a high of 42.2%, and ADRs peaking at $446.
- Conversely, the slowest single month of the year, typically falling within the low season, marks the market's lowest point. In this month, revenue might dip to $2,733, occupancy could drop to 26.4%, and ADRs may adjust down to $316.
- Understanding both the seasonal averages and these monthly peaks and troughs in revenue, occupancy, and ADR is crucial for maximizing your Airbnb profit potential in Alto.
Seasonal Strategies for Maximizing Profit
- Peak Season: Maximize revenue through premium pricing and potentially longer minimum stays. Ensure high availability.
- Low Season: Offer competitive pricing, special promotions (e.g., extended stay discounts), and flexible cancellation policies. Target off-season travelers like remote workers or budget-conscious guests.
- Shoulder Seasons: Implement dynamic pricing that balances peak and low rates. Target weekend travelers or specific events. Offer slightly more flexible terms than peak season.
- Regularly analyze your own performance against these Alto seasonality benchmarks and adjust your pricing and availability strategy accordingly.
Best Areas for Airbnb Investment in Alto (2026)
Exploring the top neighborhoods for short-term rentals in Alto? This section highlights key areas, outlining why they are attractive for hosts and guests, along with notable local attractions. Consider these locations based on your target guest profile and investment strategy.
| Neighborhood / Area | Why Host Here? (Target Guests & Appeal) | Key Attractions & Landmarks |
|---|---|---|
| Alto Lakes | A scenic and exclusive community providing great access to outdoor activities such as skiing in the winter and golfing during the summer. Highly sought after by families and vacationers looking for a peaceful retreat in nature. | Monticello Lake, Ruidoso Downs Race Track, Eagle Creek Sports Bar & Grill, African American Cultural & Heritage Facility, Alto Lakes Golf & Country Club |
| Ruidoso | A popular tourist destination known for its vibrant arts scene, outdoor activities, and proximity to skiing resorts. It's an all-year-round destination perfect for both winter sports enthusiasts and summer visitors. | Ski Apache, Ruidoso Downs Race Track, Lincoln National Forest, Grindstone Lake, Museums and art galleries in Ruidoso |
| Ski Apache | Known for its skiing and snowboarding during winter, this area attracts many thrill-seekers and offers breathtaking views, making it an ideal location for vacation rentals. | Ski Apache Ski Resort, Mountain biking trails, ZipLine at Ski Apache, Stargazing and scenic picnics |
| Mescalero | Home to the Mescalero Apache Tribe, this area offers rich cultural experiences and access to beautiful outdoor scenery, particularly appealing to travelers seeking a unique cultural connection. | Mescalero Apache Reservation, White Mountain Wilderness, Cedar Creek Falls, Inn of the Mountain Gods Casino |
| Lincoln National Forest | This expansive national forest offers rich opportunities for hiking, biking, and wildlife viewing, making it attractive to nature lovers and adventure travelers. | Hiking trails, Campsites, Mountains and scenic vistas, Wildlife viewing opportunities |
| Fort Stanton | A historic area with a rich military history providing potential for educational tourism and outdoor recreation both in history tours and nature activities. | Fort Stanton Historic Site, Hiking and biking trails, Outdoor camping |
| Bonito Lake | A pristine lake area known for its fishing, hiking, and other outdoor activities. A great spot for families and outdoor enthusiasts looking to escape into nature. | Fishing, Boating, Picnic areas, Hiking trails around the lake |
| Ruidoso River | With scenic views and recreational activities, this river area attracts tourists looking for relaxation and adventure. Fun for rafting, fishing, and family outings. | Ruidoso River Trail, Fishing spots, Picnic areas along the river |
Understanding Airbnb License Requirements & STR Laws in Alto (2026)
While Alto, New Mexico, United States currently shows low STR regulations, specific Airbnb license requirements might still exist or change. Always verify the latest short term rental regulations and Airbnb license requirements directly with local government authorities for Alto to ensure full compliance before hosting.
(Source: AirROI data, 2026, based on 1% licensed listings)
Top Performing Airbnb Properties in Alto (2026)
Benchmark your potential! Explore examples of top-performing Airbnb properties in Altobased on Trailing Twelve Month (TTM) revenue. Analyze their characteristics, revenue, occupancy rate, and ADR to understand what drives success in this market.

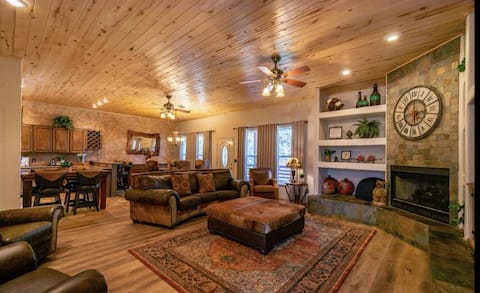
Scenic Alto Getaway w/ Mountain Views & Hot Tub!
Entire Place • 6 bedrooms
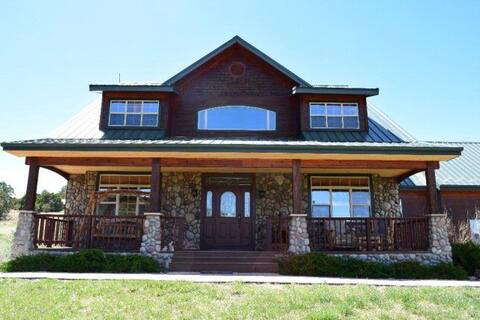
*Alto Home* Crown Ridge Lodge-Hot Tub & Game Room
Entire Place • 6 bedrooms
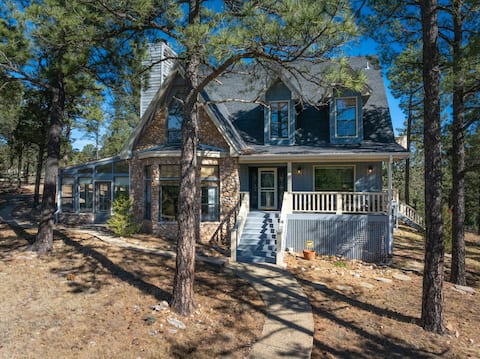
Falling Water Retreat will "wash you away"
Entire Place • 5 bedrooms

‘Casa Patron’ Home < 10 Mi to Hiking & Casinos
Entire Place • 4 bedrooms
The Restful Retreat/Mountain Views/ Sleeps 16
Entire Place • 5 bedrooms

Fenced Yard, Mtn views, Big Dogs OK, Wildlife
Entire Place • 3 bedrooms
Note: Performance varies based on location, size, amenities, seasonality, and management quality. Data reflects the past 12 months.
Top Performing Airbnb Hosts in Alto (2026)
Learn from the best! This table showcases top-performing Airbnb hosts in Alto based on the number of properties managed and estimated total revenue over the past year. Analyze their scale and performance metrics.
| Host Name | Properties | Grossing Revenue | Stay Reviews | Avg Rating |
|---|---|---|---|---|
| Ruidoso Vacation Rentals | 20 | $806,822 | 292 | 4.60/5.0 |
| Evolve | 18 | $798,383 | 867 | 4.69/5.0 |
| Hummingbird Cabins | 13 | $377,485 | 320 | 4.61/5.0 |
| Bhhs | 3 | $135,608 | 63 | 4.87/5.0 |
| Jessica | 1 | $119,682 | 32 | 4.97/5.0 |
| Ana Maureen | 3 | $104,205 | 121 | 4.87/5.0 |
| Kyndall | 1 | $103,686 | 8 | 5.00/5.0 |
| Angela | 1 | $102,337 | 94 | 4.99/5.0 |
| Mountain Air Cabins | 4 | $98,954 | 35 | 4.70/5.0 |
| Nicole | 1 | $85,578 | 101 | 4.94/5.0 |
Analyzing the strategies of top hosts, such as their property selection, pricing, and guest communication, can offer valuable lessons for optimizing your own Airbnb operations in Alto.
Dive Deeper: Advanced Alto STR Market Data (2026)
Ready to unlock more insights? AirROI provides access to advanced metrics and comprehensive Airbnb data for Alto. Explore detailed analytics beyond this report to refine your investment strategy, optimize pricing, and maximize your vacation rental profits.
Explore Advanced MetricsAlto Short-Term Rental Market Composition (2026): Property & Room Types
Room Type Distribution
Property Type Distribution
Market Composition Insights for Alto
- The Alto Airbnb market composition is heavily skewed towards Entire Home/Apt listings, which make up 100% of the 120 active rentals. This indicates strong guest preference for privacy and space.
- Looking at the property type distribution in Alto, House properties are the most common (47.5%), reflecting the local real estate landscape.
- Houses represent a significant 47.5% portion, catering likely to families or larger groups.
- Smaller segments like hotel/boutique (combined 0.8%) offer potential for unique stay experiences.
Alto Airbnb Room Capacity Analysis (2026): Bedroom Distribution
Distribution of Listings by Number of Bedrooms
Room Capacity Insights for Alto
- The dominant room capacity in Alto is 3 bedrooms listings, making up 43.3% of the market. This suggests a strong demand for properties suitable for families or small groups.
- Together, 3 bedrooms and 4 bedrooms properties represent 61.6% of the active Airbnb listings in Alto, indicating a high concentration in these sizes.
- A significant 76.6% of listings offer 3+ bedrooms, catering to larger groups and families seeking more space in Alto.
Alto Vacation Rental Guest Capacity Trends (2026)
Distribution of Listings by Guest Capacity
Guest Capacity Insights for Alto
- The most common guest capacity trend in Alto vacation rentals is listings accommodating 8+ guests (46.7%). This suggests the primary traveler segment is likely larger groups.
- Properties designed for 8+ guests and 6 guests dominate the Alto STR market, accounting for 77.5% of listings.
- 80.0% of properties accommodate 6+ guests, serving the market segment for larger families or group travel in Alto.
- On average, properties in Alto are equipped to host 6.5 guests.
Alto Airbnb Booking Patterns (2026): Available vs. Booked Days
Available Days Distribution
Booked Days Distribution
Booking Pattern Insights for Alto
- The most common availability pattern in Alto falls within the 271-366 days range, representing 51.7% of listings. This suggests many properties have significant open periods on their calendars.
- Approximately 89.2% of listings show high availability (181+ days open annually), indicating potential for increased bookings or specific owner usage patterns.
- For booked days, the 91-180 days range is most frequent in Alto (37.5%), reflecting common guest stay durations or potential owner blocking patterns.
- A notable 11.7% of properties secure long booking periods (181+ days booked per year), highlighting successful long-term rental strategies or significant owner usage.
Alto Airbnb Minimum Stay Requirements Analysis
Distribution of Listings by Minimum Night Requirement
1 Night
6 listings
5% of total
2 Nights
71 listings
59.2% of total
3 Nights
6 listings
5% of total
30+ Nights
37 listings
30.8% of total
Key Insights
- The most prevalent minimum stay requirement in Alto is 2 Nights, adopted by 59.2% of listings. This highlights the market's preference for shorter, flexible bookings.
- A strong majority (64.2%) of the Alto Airbnb data shows acceptance of very short stays (1-2 nights), indicating a dynamic, high-turnover market.
- A significant segment (30.8%) caters to monthly stays (30+ nights) in Alto, pointing to opportunities in the extended-stay market.
Recommendations
- Align with the market by considering a 2 Nights minimum stay, as 59.2% of Alto hosts use this setting.
- If feasible, allowing 1-night stays, especially midweek or during low season, could capture last-minute bookings, as only 5% currently do.
- A 2-night minimum appears standard (59.2%). Consider this for weekends or peak periods.
- Explore offering discounts for stays of 30+ nights to attract the 30.8% of the market seeking extended stays.
- Adjust minimum nights based on seasonality – potentially shorter during low season and longer during peak demand periods in Alto.
Alto Airbnb Cancellation Policy Trends Analysis (2026)
Super Strict 60 Days
1 listings
0.8% of total
Flexible
7 listings
5.8% of total
Moderate
12 listings
10% of total
Firm
69 listings
57.5% of total
Strict
31 listings
25.8% of total
Cancellation Policy Insights for Alto
- The prevailing Airbnb cancellation policy trend in Alto is Firm, used by 57.5% of listings.
- A majority (83.3%) of hosts in Alto utilize Firm or Strict policies, indicating a market where hosts prioritize booking security.
Recommendations for Hosts
- Consider adopting a Firm policy to align with the 57.5% market standard in Alto.
- Regularly review your cancellation policy against competitors and market demand shifts in Alto.
Alto STR Booking Lead Time Analysis (2026)
Average Booking Lead Time by Month
Booking Lead Time Insights for Alto
- The overall average booking lead time for vacation rentals in Alto is 37 days.
- Guests book furthest in advance for stays during July (average 53 days), likely coinciding with peak travel demand or local events.
- The shortest booking windows occur for stays in March (average 21 days), indicating more last-minute travel plans during this time.
- Seasonally, Summer (47 days avg.) sees the longest lead times, while Spring (31 days avg.) has the shortest, reflecting typical travel planning cycles.
Recommendations for Hosts
- Use the overall average lead time (37 days) as a baseline for your pricing and availability strategy in Alto.
- For July stays, consider implementing length-of-stay discounts or slightly higher rates for bookings made less than 53 days out to capitalize on advance planning.
- Target marketing efforts for the Summer season well in advance (at least 47 days) to capture early planners.
- Monitor your own booking lead times against these Alto averages to identify opportunities for dynamic pricing adjustments.
Popular & Essential Airbnb Amenities in Alto (2026)
Amenity Prevalence
Amenity Insights for Alto
- Essential amenities in Alto that guests expect include: TV, Smoke alarm, Kitchen, Heating, Wifi, Dishes and silverware, Hot water, Coffee maker, Refrigerator, Microwave. Lacking these (any) could significantly impact bookings.
Recommendations for Hosts
- Ensure your listing includes all essential amenities for Alto: TV, Smoke alarm, Kitchen, Heating, Wifi, Dishes and silverware, Hot water, Coffee maker, Refrigerator, Microwave.
- Prioritize adding missing essentials: TV, Smoke alarm, Kitchen, Heating, Wifi, Dishes and silverware, Hot water, Coffee maker, Refrigerator, Microwave.
- Highlight unique or less common amenities you offer (e.g., hot tub, dedicated workspace, EV charger) in your listing description and photos.
- Regularly check competitor amenities in Alto to stay competitive.
Alto Airbnb Guest Demographics & Profile Analysis (2026)
Guest Profile Summary for Alto
- The typical guest profile for Airbnb in Alto consists of primarily domestic travelers (93%), often arriving from nearby El Paso, typically belonging to the Post-2000s (Gen Z/Alpha) group (50%), primarily speaking English or Spanish.
- Domestic travelers account for 93.2% of guests.
- Key international markets include United States (93.2%) and Mexico (5.4%).
- Top languages spoken are English (64.6%) followed by Spanish (29.1%).
- A significant demographic segment is the Post-2000s (Gen Z/Alpha) group, representing 50% of guests.
Recommendations for Hosts
- Target domestic marketing efforts towards travelers from El Paso and Albuquerque.
- Tailor amenities and listing descriptions to appeal to the dominant Post-2000s (Gen Z/Alpha) demographic (e.g., highlight fast WiFi, smart home features, local guides).
- Highlight unique local experiences or amenities relevant to the primary guest profile.
- Consider seasonal promotions aligned with peak travel times for key origin markets.
Nearby Short-Term Rental Market Comparison
How does the Alto Airbnb market stack up against its neighbors? Compare key performance metrics like average monthly revenue, ADR, and occupancy rates in surrounding areas to understand the broader regional STR landscape.
| Market | Active Properties | Monthly Revenue | Daily Rate | Avg. Occupancy |
|---|---|---|---|---|
| Ruidoso | 1,135 | $2,301 | $285.33 | 31% |
| Cloudcroft | 198 | $2,130 | $190.66 | 42% |
| Carlsbad | 170 | $2,001 | $145.24 | 51% |
| High Rolls | 35 | $1,909 | $176.71 | 39% |
| Alamogordo | 85 | $1,868 | $153.86 | 48% |
| Roswell | 100 | $1,866 | $186.25 | 43% |
| Lincoln County | 11 | $1,820 | $364.86 | 28% |
| Socorro | 10 | $1,757 | $137.59 | 47% |
| Las Cruces | 471 | $1,672 | $140.43 | 47% |
| Nogal | 19 | $1,660 | $210.11 | 23% |