Albuquerque Airbnb Market Analysis 2026: Short Term Rental Data & Vacation Rental Statistics in New Mexico, United States
Is Airbnb profitable in Albuquerque in 2026? Explore comprehensive Airbnb analytics for Albuquerque, New Mexico, United States to uncover income potential. This 2026 STR market report for Albuquerque, based on AirROI data from February 2025 to January 2026, reveals key trends in the bustling market of 1,803 active listings.
Whether you're considering an Airbnb investment in Albuquerque, optimizing your existing vacation rental, or exploring rental arbitrage opportunities, understanding the Albuquerque Airbnb data is crucial. Leveraging the low regulation environment is key to maximizing your short term rental income potential. Let's dive into the specifics.
Key Albuquerque Airbnb Performance Metrics Overview
Monthly Airbnb Revenue Variations & Income Potential in Albuquerque (2026)
Understanding the monthly revenue variations for Airbnb listings in Albuquerque is key to maximizing your short term rental income potential. Seasonality significantly impacts earnings. Our analysis, based on data from the past 12 months, shows that the peak revenue month for STRs in Albuquerque is typically October, while January often presents the lowest earnings, highlighting opportunities for strategic pricing adjustments during shoulder and low seasons. Explore the typical Airbnb income in Albuquerque across different performance tiers:
- Best-in-class properties (Top 10%) achieve $5,404+ monthly, often utilizing dynamic pricing and superior guest experiences.
- Strong performing properties (Top 25%) earn $3,617 or more, indicating effective management and desirable locations/amenities.
- Typical properties (Median) generate around $2,320 per month, representing the average market performance.
- Entry-level properties (Bottom 25%) see earnings around $1,275, often with potential for optimization.
Average Monthly Airbnb Earnings Trend in Albuquerque
Albuquerque Airbnb Occupancy Rate Trends (2026)
Maximize your bookings by understanding the Albuquerque STR occupancy trends. Seasonal demand shifts significantly influence how often properties are booked. Typically, Marchsees the highest demand (peak season occupancy), while January experiences the lowest (low season). Effective strategies, like adjusting minimum stays or offering promotions, can boost occupancy during slower periods. Here's how different property tiers perform in Albuquerque:
- Best-in-class properties (Top 10%) achieve 85%+ occupancy, indicating high desirability and potentially optimized availability.
- Strong performing properties (Top 25%) maintain 73% or higher occupancy, suggesting good market fit and guest satisfaction.
- Typical properties (Median) have an occupancy rate around 54%.
- Entry-level properties (Bottom 25%) average 32% occupancy, potentially facing higher vacancy.
Average Monthly Occupancy Rate Trend in Albuquerque
Average Daily Rate (ADR) Airbnb Trends in Albuquerque (2026)
Effective short term rental pricing strategy in Albuquerque involves understanding monthly ADR fluctuations. The Average Daily Rate (ADR) for Airbnb in Albuquerque typically peaks in October and dips lowest during February. Leveraging Airbnb dynamic pricing tools or strategies based on this seasonality can significantly boost revenue. Here's a look at the typical nightly rates achieved:
- Best-in-class properties (Top 10%) command rates of $309+ per night, often due to premium features or locations.
- Strong performing properties (Top 25%) achieve nightly rates of $203 or more.
- Typical properties (Median) charge around $135 per night.
- Entry-level properties (Bottom 25%) earn around $93 per night.
Average Daily Rate (ADR) Trend by Month in Albuquerque
Get Live Albuquerque Market Intelligence 👇

Explore Real-time Analytics
Airbnb Seasonality Analysis & Trends in Albuquerque (2026)
Peak Season (October, September, July)
- Revenue averages $3,549 per month
- Occupancy rates average 55.0%
- Daily rates average $195
Shoulder Season
- Revenue averages $2,789 per month
- Occupancy maintains around 52.7%
- Daily rates hold near $171
Low Season (January, February, April)
- Revenue drops to average $2,136 per month
- Occupancy decreases to average 47.6%
- Daily rates adjust to average $161
Seasonality Insights for Albuquerque
- The Airbnb seasonality in Albuquerque shows highly seasonal trends requiring careful strategy. While the sections above show seasonal averages, it's also insightful to look at the extremes:
- During the high season, the absolute peak month showcases Albuquerque's highest earning potential, with monthly revenues capable of climbing to $4,511, occupancy reaching a high of 58.1%, and ADRs peaking at $234.
- Conversely, the slowest single month of the year, typically falling within the low season, marks the market's lowest point. In this month, revenue might dip to $1,975, occupancy could drop to 38.9%, and ADRs may adjust down to $150.
- Understanding both the seasonal averages and these monthly peaks and troughs in revenue, occupancy, and ADR is crucial for maximizing your Airbnb profit potential in Albuquerque.
Seasonal Strategies for Maximizing Profit
- Peak Season: Maximize revenue through premium pricing and potentially longer minimum stays. Ensure high availability.
- Low Season: Offer competitive pricing, special promotions (e.g., extended stay discounts), and flexible cancellation policies. Target off-season travelers like remote workers or budget-conscious guests.
- Shoulder Seasons: Implement dynamic pricing that balances peak and low rates. Target weekend travelers or specific events. Offer slightly more flexible terms than peak season.
- Regularly analyze your own performance against these Albuquerque seasonality benchmarks and adjust your pricing and availability strategy accordingly.
Best Areas for Airbnb Investment in Albuquerque (2026)
Exploring the top neighborhoods for short-term rentals in Albuquerque? This section highlights key areas, outlining why they are attractive for hosts and guests, along with notable local attractions. Consider these locations based on your target guest profile and investment strategy.
| Neighborhood / Area | Why Host Here? (Target Guests & Appeal) | Key Attractions & Landmarks |
|---|---|---|
| Downtown Albuquerque | The heart of Albuquerque, offering a mix of cultural attractions and nightlife. Ideal for visitors wanting to explore local events and historic sites with easy access to restaurants and shops. | Albuquerque Museum, Indian Pueblo Cultural Center, Old Town Albuquerque, Kimo Theatre, Plaza Vieja |
| Nob Hill | A vibrant, trendy neighborhood known for its eclectic mix of shops, restaurants, and nightlife. Popular with travelers looking for a laid-back atmosphere and unique local experiences. | Nob Hill Shopping District, Route 66, The New Mexico Museum of Natural History, Nob Hill Bar and Grill, Central Avenue |
| Old Town | Historical area with a charming plaza and adobe-style buildings, offering a glimpse into Albuquerque's rich past. Attracts tourists interested in history, art, and culture. | San Felipe de Neri Church, Old Town Plaza, ABQ BioPark, New Mexico History Museum, The Albuquerque Artwalk |
| Rio Rancho | A suburban area just north of Albuquerque, offering family-friendly activities and shopping. Great for families visiting nearby attractions. | Cabezon Park, Petroglyph National Monument, Cottonwood Mall, Aerial Tramway, Santa Ana Star Center |
| Unm Area | Close to the University of New Mexico and a young, diverse atmosphere. Attracts students and families visiting the university and surrounding attractions. | University of New Mexico, The Frontier Restaurant, Lobo Theatre, Duck Pond, Popejoy Hall |
| Sandia Heights | Stunning mountain views and a tranquil setting make this area appealing for those seeking a retreat close to nature. Perfect for outdoor enthusiasts and families looking for a peaceful getaway. | Sandia Peak Tramway, Cibola National Forest, Sandia Mountains, Scenic Views, Hiking Trails |
| South Valley | A culturally rich area that reflects the heritage of the region. Offers a more authentic glimpse of local life and traditions, attracting visitors interested in local culture. | Isleta Pueblo, Tijeras Canyon, Abq BioPark, Local Art Galleries, Cultural events |
| North Valley | Known for its rural character and equestrian culture, North Valley is a charming area with large lots and lush landscapes. Appeals to those seeking space and community. | Rio Grande Nature Center, Local Farms, Open Space Trails, Tierra Del Sol Golf Club, Equestrian Events |
Understanding Airbnb License Requirements & STR Laws in Albuquerque (2026)
While Albuquerque, New Mexico, United States currently shows low STR regulations, specific Airbnb license requirements might still exist or change. Always verify the latest short term rental regulations and Airbnb license requirements directly with local government authorities for Albuquerque to ensure full compliance before hosting.
(Source: AirROI data, 2026, based on 0% licensed listings)
Top Performing Airbnb Properties in Albuquerque (2026)
Benchmark your potential! Explore examples of top-performing Airbnb properties in Albuquerquebased on Trailing Twelve Month (TTM) revenue. Analyze their characteristics, revenue, occupancy rate, and ADR to understand what drives success in this market.

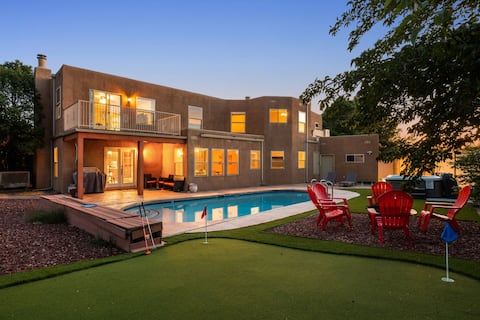
5 Bedroom, Pool, Hotub, Pickleball, Gym, Putt Putt
Entire Place • 5 bedrooms

5500sq ft, Pool, Sauna, Game Room, Lux Area of ABQ
Entire Place • 7 bedrooms

7BR Retreat w/ gated parking Views & Near Old Town
Entire Place • 7 bedrooms
Heated Pool ALL YEAR, Hot Tub, 3700sf, Game Room
Entire Place • 8 bedrooms

Sky-High Desert Oasis
Entire Place • 3 bedrooms

Monte Vista Oasis: Hot Tub, Fire Pit, VIEWS
Entire Place • 6 bedrooms
Note: Performance varies based on location, size, amenities, seasonality, and management quality. Data reflects the past 12 months.
Top Performing Airbnb Hosts in Albuquerque (2026)
Learn from the best! This table showcases top-performing Airbnb hosts in Albuquerque based on the number of properties managed and estimated total revenue over the past year. Analyze their scale and performance metrics.
| Host Name | Properties | Grossing Revenue | Stay Reviews | Avg Rating |
|---|---|---|---|---|
| Irvie Homes | 27 | $1,352,022 | 1047 | 4.80/5.0 |
| Taryn | 43 | $1,250,024 | 7590 | 4.88/5.0 |
| Jon | 14 | $764,576 | 2487 | 4.96/5.0 |
| Evolve | 26 | $693,577 | 580 | 4.83/5.0 |
| David | 27 | $666,900 | 1023 | 4.53/5.0 |
| Luke | 6 | $618,427 | 255 | 4.95/5.0 |
| Bennie | 7 | $512,345 | 840 | 4.94/5.0 |
| Aaron And Chantel | 18 | $502,412 | 1275 | 4.89/5.0 |
| Emily And James | 19 | $489,740 | 383 | 4.95/5.0 |
| Kelly | 7 | $450,302 | 1610 | 4.97/5.0 |
Analyzing the strategies of top hosts, such as their property selection, pricing, and guest communication, can offer valuable lessons for optimizing your own Airbnb operations in Albuquerque.
Dive Deeper: Advanced Albuquerque STR Market Data (2026)
Ready to unlock more insights? AirROI provides access to advanced metrics and comprehensive Airbnb data for Albuquerque. Explore detailed analytics beyond this report to refine your investment strategy, optimize pricing, and maximize your vacation rental profits.
Explore Advanced MetricsAlbuquerque Short-Term Rental Market Composition (2026): Property & Room Types
Room Type Distribution
Property Type Distribution
Market Composition Insights for Albuquerque
- The Albuquerque Airbnb market composition is heavily skewed towards Entire Home/Apt listings, which make up 89.2% of the 1,803 active rentals. This indicates strong guest preference for privacy and space.
- Looking at the property type distribution in Albuquerque, House properties are the most common (69.1%), reflecting the local real estate landscape.
- Houses represent a significant 69.1% portion, catering likely to families or larger groups.
- The presence of 9.3% Hotel/Boutique listings indicates integration with traditional hospitality.
- Smaller segments like others, outdoor/unique, unique stays (combined 5.6%) offer potential for unique stay experiences.
Albuquerque Airbnb Room Capacity Analysis (2026): Bedroom Distribution
Distribution of Listings by Number of Bedrooms
Room Capacity Insights for Albuquerque
- The dominant room capacity in Albuquerque is 1 bedroom listings, making up 26.6% of the market. This suggests a strong demand for properties suitable for couples or solo travelers.
- Together, 1 bedroom and 3 bedrooms properties represent 51.4% of the active Airbnb listings in Albuquerque, indicating a high concentration in these sizes.
- A significant 37.2% of listings offer 3+ bedrooms, catering to larger groups and families seeking more space in Albuquerque.
Albuquerque Vacation Rental Guest Capacity Trends (2026)
Distribution of Listings by Guest Capacity
Guest Capacity Insights for Albuquerque
- The most common guest capacity trend in Albuquerque vacation rentals is listings accommodating 2 guests (20.2%). This suggests the primary traveler segment is likely couples or solo travelers.
- Properties designed for 2 guests and 4 guests dominate the Albuquerque STR market, accounting for 39.8% of listings.
- 40.3% of properties accommodate 6+ guests, serving the market segment for larger families or group travel in Albuquerque.
- On average, properties in Albuquerque are equipped to host 4.4 guests.
Albuquerque Airbnb Booking Patterns (2026): Available vs. Booked Days
Available Days Distribution
Booked Days Distribution
Booking Pattern Insights for Albuquerque
- The most common availability pattern in Albuquerque falls within the 91-180 days range, representing 31.4% of listings. This suggests many properties have significant open periods on their calendars.
- Approximately 61.6% of listings show high availability (181+ days open annually), indicating potential for increased bookings or specific owner usage patterns.
- For booked days, the 181-270 days range is most frequent in Albuquerque (32.1%), reflecting common guest stay durations or potential owner blocking patterns.
- A notable 39.9% of properties secure long booking periods (181+ days booked per year), highlighting successful long-term rental strategies or significant owner usage.
Albuquerque Airbnb Minimum Stay Requirements Analysis
Distribution of Listings by Minimum Night Requirement
1 Night
469 listings
26% of total
2 Nights
392 listings
21.7% of total
3 Nights
140 listings
7.8% of total
4-6 Nights
68 listings
3.8% of total
7-29 Nights
155 listings
8.6% of total
30+ Nights
579 listings
32.1% of total
Key Insights
- The most prevalent minimum stay requirement in Albuquerque is 30+ Nights, adopted by 32.1% of listings. This highlights the market's preference for longer commitments.
- A significant segment (32.1%) caters to monthly stays (30+ nights) in Albuquerque, pointing to opportunities in the extended-stay market.
Recommendations
- Align with the market by considering a 30+ Nights minimum stay, as 32.1% of Albuquerque hosts use this setting.
- If feasible, allowing 1-night stays, especially midweek or during low season, could capture last-minute bookings, as only 26% currently do.
- Explore offering discounts for stays of 30+ nights to attract the 32.1% of the market seeking extended stays.
- Adjust minimum nights based on seasonality – potentially shorter during low season and longer during peak demand periods in Albuquerque.
Albuquerque Airbnb Cancellation Policy Trends Analysis (2026)
Limited
56 listings
3.1% of total
Super Strict 30 Days
2 listings
0.1% of total
Super Strict 60 Days
28 listings
1.6% of total
Flexible
434 listings
24.1% of total
Moderate
479 listings
26.6% of total
Firm
593 listings
32.9% of total
Strict
208 listings
11.6% of total
Cancellation Policy Insights for Albuquerque
- The prevailing Airbnb cancellation policy trend in Albuquerque is Firm, used by 32.9% of listings.
- There's a relatively balanced mix between guest-friendly (50.7%) and stricter (44.5%) policies, offering choices for different guest needs.
Recommendations for Hosts
- Consider adopting a Firm policy to align with the 32.9% market standard in Albuquerque.
- Using a Strict policy might deter some guests, as only 11.6% of listings use it. Evaluate if potential revenue protection outweighs possible lower booking rates.
- Regularly review your cancellation policy against competitors and market demand shifts in Albuquerque.
Albuquerque STR Booking Lead Time Analysis (2026)
Average Booking Lead Time by Month
Booking Lead Time Insights for Albuquerque
- The overall average booking lead time for vacation rentals in Albuquerque is 37 days.
- Guests book furthest in advance for stays during October (average 80 days), likely coinciding with peak travel demand or local events.
- The shortest booking windows occur for stays in February (average 21 days), indicating more last-minute travel plans during this time.
- Seasonally, Fall (50 days avg.) sees the longest lead times, while Winter (25 days avg.) has the shortest, reflecting typical travel planning cycles.
Recommendations for Hosts
- Use the overall average lead time (37 days) as a baseline for your pricing and availability strategy in Albuquerque.
- For October stays, consider implementing length-of-stay discounts or slightly higher rates for bookings made less than 80 days out to capitalize on advance planning.
- Target marketing efforts for the Fall season well in advance (at least 50 days) to capture early planners.
- Monitor your own booking lead times against these Albuquerque averages to identify opportunities for dynamic pricing adjustments.
Popular & Essential Airbnb Amenities in Albuquerque (2026)
Amenity Prevalence
Amenity Insights for Albuquerque
- Essential amenities in Albuquerque that guests expect include: Wifi, Smoke alarm, Air conditioning, TV, Heating. Lacking these (any) could significantly impact bookings.
- Popular amenities like Free parking on premises, Hot water, Dishes and silverware are common but not universal. Offering these can provide a competitive edge.
Recommendations for Hosts
- Ensure your listing includes all essential amenities for Albuquerque: Wifi, Smoke alarm, Air conditioning, TV, Heating.
- Prioritize adding missing essentials: Wifi, Smoke alarm, Air conditioning, TV, Heating.
- Consider adding popular differentiators like Free parking on premises or Hot water to increase appeal.
- Highlight unique or less common amenities you offer (e.g., hot tub, dedicated workspace, EV charger) in your listing description and photos.
- Regularly check competitor amenities in Albuquerque to stay competitive.
Albuquerque Airbnb Guest Demographics & Profile Analysis (2026)
Guest Profile Summary for Albuquerque
- The typical guest profile for Airbnb in Albuquerque consists of primarily domestic travelers (96%), often arriving from nearby Albuquerque, typically belonging to the Post-2000s (Gen Z/Alpha) group (50%), primarily speaking English or Spanish.
- Domestic travelers account for 96.2% of guests.
- Key international markets include United States (96.2%) and Canada (0.6%).
- Top languages spoken are English (67.6%) followed by Spanish (18%).
- A significant demographic segment is the Post-2000s (Gen Z/Alpha) group, representing 50% of guests.
Recommendations for Hosts
- Target domestic marketing efforts towards travelers from Albuquerque and El Paso.
- Tailor amenities and listing descriptions to appeal to the dominant Post-2000s (Gen Z/Alpha) demographic (e.g., highlight fast WiFi, smart home features, local guides).
- Highlight unique local experiences or amenities relevant to the primary guest profile.
- Consider seasonal promotions aligned with peak travel times for key origin markets.
Nearby Short-Term Rental Market Comparison
How does the Albuquerque Airbnb market stack up against its neighbors? Compare key performance metrics like average monthly revenue, ADR, and occupancy rates in surrounding areas to understand the broader regional STR landscape.
| Market | Active Properties | Monthly Revenue | Daily Rate | Avg. Occupancy |
|---|---|---|---|---|
| Santa Fe | 1,746 | $3,943 | $318.09 | 49% |
| Valdez | 31 | $3,145 | $354.77 | 34% |
| Arroyo Seco | 59 | $3,119 | $351.72 | 37% |
| Jemez Springs | 40 | $3,085 | $211.27 | 52% |
| El Prado | 221 | $3,016 | $256.61 | 45% |
| Abiquiu | 38 | $2,868 | $222.67 | 51% |
| Tres Piedras | 18 | $2,836 | $191.25 | 49% |
| Placitas | 30 | $2,714 | $233.44 | 49% |
| Dixon | 10 | $2,710 | $162.61 | 55% |
| Angel Fire | 693 | $2,706 | $381.30 | 32% |