Wildwood Crest Airbnb Market Analysis 2026: Short Term Rental Data & Vacation Rental Statistics in New Jersey, United States
Is Airbnb profitable in Wildwood Crest in 2026? Explore comprehensive Airbnb analytics for Wildwood Crest, New Jersey, United States to uncover income potential. This 2026 STR market report for Wildwood Crest, based on AirROI data from February 2025 to January 2026, reveals key trends in the market of 398 active listings.
Whether you're considering an Airbnb investment in Wildwood Crest, optimizing your existing vacation rental, or exploring rental arbitrage opportunities, understanding the Wildwood Crest Airbnb data is crucial. Leveraging the low regulation environment is key to maximizing your short term rental income potential. Let's dive into the specifics.
Key Wildwood Crest Airbnb Performance Metrics Overview
Monthly Airbnb Revenue Variations & Income Potential in Wildwood Crest (2026)
Understanding the monthly revenue variations for Airbnb listings in Wildwood Crest is key to maximizing your short term rental income potential. Seasonality significantly impacts earnings. Our analysis, based on data from the past 12 months, shows that the peak revenue month for STRs in Wildwood Crest is typically July, while February often presents the lowest earnings, highlighting opportunities for strategic pricing adjustments during shoulder and low seasons. Explore the typical Airbnb income in Wildwood Crest across different performance tiers:
- Best-in-class properties (Top 10%) achieve $7,336+ monthly, often utilizing dynamic pricing and superior guest experiences.
- Strong performing properties (Top 25%) earn $4,531 or more, indicating effective management and desirable locations/amenities.
- Typical properties (Median) generate around $2,702 per month, representing the average market performance.
- Entry-level properties (Bottom 25%) see earnings around $1,597, often with potential for optimization.
Average Monthly Airbnb Earnings Trend in Wildwood Crest
Wildwood Crest Airbnb Occupancy Rate Trends (2026)
Maximize your bookings by understanding the Wildwood Crest STR occupancy trends. Seasonal demand shifts significantly influence how often properties are booked. Typically, Augustsees the highest demand (peak season occupancy), while February experiences the lowest (low season). Effective strategies, like adjusting minimum stays or offering promotions, can boost occupancy during slower periods. Here's how different property tiers perform in Wildwood Crest:
- Best-in-class properties (Top 10%) achieve 63%+ occupancy, indicating high desirability and potentially optimized availability.
- Strong performing properties (Top 25%) maintain 47% or higher occupancy, suggesting good market fit and guest satisfaction.
- Typical properties (Median) have an occupancy rate around 31%.
- Entry-level properties (Bottom 25%) average 19% occupancy, potentially facing higher vacancy.
Average Monthly Occupancy Rate Trend in Wildwood Crest
Average Daily Rate (ADR) Airbnb Trends in Wildwood Crest (2026)
Effective short term rental pricing strategy in Wildwood Crest involves understanding monthly ADR fluctuations. The Average Daily Rate (ADR) for Airbnb in Wildwood Crest typically peaks in July and dips lowest during April. Leveraging Airbnb dynamic pricing tools or strategies based on this seasonality can significantly boost revenue. Here's a look at the typical nightly rates achieved:
- Best-in-class properties (Top 10%) command rates of $583+ per night, often due to premium features or locations.
- Strong performing properties (Top 25%) achieve nightly rates of $398 or more.
- Typical properties (Median) charge around $286 per night.
- Entry-level properties (Bottom 25%) earn around $219 per night.
Average Daily Rate (ADR) Trend by Month in Wildwood Crest
Get Live Wildwood Crest Market Intelligence 👇

Explore Real-time Analytics
Airbnb Seasonality Analysis & Trends in Wildwood Crest (2026)
Peak Season (July, August, June)
- Revenue averages $7,571 per month
- Occupancy rates average 61.2%
- Daily rates average $368
Shoulder Season
- Revenue averages $2,697 per month
- Occupancy maintains around 28.2%
- Daily rates hold near $340
Low Season (January, February, March)
- Revenue drops to average $1,630 per month
- Occupancy decreases to average 19.0%
- Daily rates adjust to average $330
Seasonality Insights for Wildwood Crest
- The Airbnb seasonality in Wildwood Crest shows highly seasonal trends requiring careful strategy. While the sections above show seasonal averages, it's also insightful to look at the extremes:
- During the high season, the absolute peak month showcases Wildwood Crest's highest earning potential, with monthly revenues capable of climbing to $8,874, occupancy reaching a high of 69.1%, and ADRs peaking at $373.
- Conversely, the slowest single month of the year, typically falling within the low season, marks the market's lowest point. In this month, revenue might dip to $1,442, occupancy could drop to 17.2%, and ADRs may adjust down to $308.
- Understanding both the seasonal averages and these monthly peaks and troughs in revenue, occupancy, and ADR is crucial for maximizing your Airbnb profit potential in Wildwood Crest.
Seasonal Strategies for Maximizing Profit
- Peak Season: Maximize revenue through premium pricing and potentially longer minimum stays. Ensure high availability.
- Low Season: Offer competitive pricing, special promotions (e.g., extended stay discounts), and flexible cancellation policies. Target off-season travelers like remote workers or budget-conscious guests.
- Shoulder Seasons: Implement dynamic pricing that balances peak and low rates. Target weekend travelers or specific events. Offer slightly more flexible terms than peak season.
- Regularly analyze your own performance against these Wildwood Crest seasonality benchmarks and adjust your pricing and availability strategy accordingly.
Best Areas for Airbnb Investment in Wildwood Crest (2026)
Exploring the top neighborhoods for short-term rentals in Wildwood Crest? This section highlights key areas, outlining why they are attractive for hosts and guests, along with notable local attractions. Consider these locations based on your target guest profile and investment strategy.
| Neighborhood / Area | Why Host Here? (Target Guests & Appeal) | Key Attractions & Landmarks |
|---|---|---|
| Wildwood Crest Beachfront | Prime location with direct access to the beach, perfect for families and tourists looking to enjoy the sun and ocean activities. | Wildwood Crest Beach, Sunset Lake, Crest Pier, Wildwood Boardwalk, Cape May County Park & Zoo, Morey’s Piers |
| Wildwood Convention Center | Great for hosting events and conferences, attracting visitors during off-peak seasons. Suitable for business travelers and event attendees. | Wildwood Convention Center, Doo Wop Experience Museum, North Wildwood Beach, Wildwood Crest Fishing Pier, Wildwood Historical Society |
| Wildwood Boardwalk | Iconic amusement area with dining and entertainment. Highly trafficked by tourists, making it ideal for shorter-term rentals. | Morey’s Piers Amusement Park, Wildwood Boardwalk, Splash Zone Water Park, Wildwood Crest Bike Path, Tram Car Rides |
| Crest Haven | Family-friendly neighborhood with a quiet ambiance, close to both the beach and local amenities, making it appealing for families. | Crest Haven Park, West Wildwood Beach, The Doo Wop Experience, Shark Park, Crest Pier |
| Cape May Point | A short drive away and known for its natural beauty and historic charm, ideal for those seeking a quieter rental experience near Wildwood. | Cape May Lighthouse, State Park Beach, Bird Sanctuary, Beautiful Victorian Homes, Ferry Beach |
| Wildwood Crest Historical District | Rich in history and charm, appealing to guests interested in the unique culture of Wildwood Crest. | Historic Wildwood Crest District, Wildwood Crest History Museum, Victorian Architecture, Local Art Galleries, Community Events |
| Sunset Lake Area | Offers picturesque views and tranquil settings, ideal for romantic getaways and families looking to relax by the water. | Sunset Lake, Watersports Rentals, Kayaking and Paddleboarding, Family Fishing Areas, Picnic Spots |
| West Wildwood | Quieter area with a small-town feel, appealing for longer stays and those looking for serenity while still being close to attractions. | West Wildwood Beach, Local Restaurants, Fishing Spots, Boardwalk Accessibility, Wildwood Golf Course |
Understanding Airbnb License Requirements & STR Laws in Wildwood Crest (2026)
While Wildwood Crest, New Jersey, United States currently shows low STR regulations, specific Airbnb license requirements might still exist or change. Always verify the latest short term rental regulations and Airbnb license requirements directly with local government authorities for Wildwood Crest to ensure full compliance before hosting.
(Source: AirROI data, 2026, based on 1% licensed listings)
Top Performing Airbnb Properties in Wildwood Crest (2026)
Benchmark your potential! Explore examples of top-performing Airbnb properties in Wildwood Crestbased on Trailing Twelve Month (TTM) revenue. Analyze their characteristics, revenue, occupancy rate, and ADR to understand what drives success in this market.
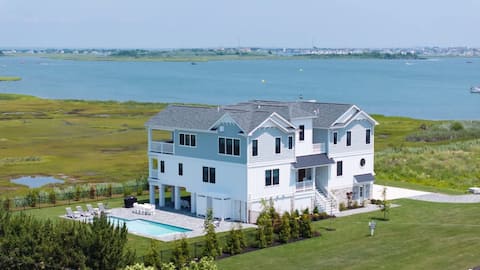
Tramonto: Luxury with Pool, Privacy, Sunset Views
Entire Place • 6 bedrooms

7 Bedroom Pet Friendly Gorgeous Home Pool+Hot Tub
Entire Place • 7 bedrooms
Gorgeous 5BR Home w/ Pool, Steps to the Beach!
Entire Place • 5 bedrooms

Beautiful Brand New 5BR Home, Steps from the Beach
Entire Place • 5 bedrooms
Home with Pool in the Crest, 2 blocks to beach
Entire Place • 4 bedrooms

Modern Waterfront 4-bedroom With Sunset Views
Entire Place • 4 bedrooms
Note: Performance varies based on location, size, amenities, seasonality, and management quality. Data reflects the past 12 months.
Top Performing Airbnb Hosts in Wildwood Crest (2026)
Learn from the best! This table showcases top-performing Airbnb hosts in Wildwood Crest based on the number of properties managed and estimated total revenue over the past year. Analyze their scale and performance metrics.
| Host Name | Properties | Grossing Revenue | Stay Reviews | Avg Rating |
|---|---|---|---|---|
| Experience Vacation Rentals | 32 | $995,682 | 115 | 4.40/5.0 |
| PMI Saltwater | 2 | $349,569 | 12 | 5.00/5.0 |
| Evolve | 15 | $259,296 | 223 | 4.51/5.0 |
| Don Martin Vacation Rentals | 12 | $257,993 | 86 | 4.48/5.0 |
| Patrick | 8 | $244,954 | 117 | 4.88/5.0 |
| Meghan | 1 | $226,730 | 67 | 4.96/5.0 |
| Cj | 4 | $194,651 | 354 | 4.73/5.0 |
| Nicole | 4 | $194,037 | 82 | 4.83/5.0 |
| Blue Homes | 5 | $129,760 | 40 | 4.94/5.0 |
| Steve | 10 | $124,207 | 669 | 4.37/5.0 |
Analyzing the strategies of top hosts, such as their property selection, pricing, and guest communication, can offer valuable lessons for optimizing your own Airbnb operations in Wildwood Crest.
Dive Deeper: Advanced Wildwood Crest STR Market Data (2026)
Ready to unlock more insights? AirROI provides access to advanced metrics and comprehensive Airbnb data for Wildwood Crest. Explore detailed analytics beyond this report to refine your investment strategy, optimize pricing, and maximize your vacation rental profits.
Explore Advanced MetricsWildwood Crest Short-Term Rental Market Composition (2026): Property & Room Types
Room Type Distribution
Property Type Distribution
Market Composition Insights for Wildwood Crest
- The Wildwood Crest Airbnb market composition is heavily skewed towards Entire Home/Apt listings, which make up 93.5% of the 398 active rentals. This indicates strong guest preference for privacy and space.
- Looking at the property type distribution in Wildwood Crest, Apartment/Condo properties are the most common (66.6%), reflecting the local real estate landscape.
- Houses represent a significant 27.4% portion, catering likely to families or larger groups.
- The presence of 6% Hotel/Boutique listings indicates integration with traditional hospitality.
Wildwood Crest Airbnb Room Capacity Analysis (2026): Bedroom Distribution
Distribution of Listings by Number of Bedrooms
Room Capacity Insights for Wildwood Crest
- The dominant room capacity in Wildwood Crest is 1 bedroom listings, making up 36.7% of the market. This suggests a strong demand for properties suitable for couples or solo travelers.
- Together, 1 bedroom and 2 bedrooms properties represent 60.8% of the active Airbnb listings in Wildwood Crest, indicating a high concentration in these sizes.
- A significant 33.4% of listings offer 3+ bedrooms, catering to larger groups and families seeking more space in Wildwood Crest.
Wildwood Crest Vacation Rental Guest Capacity Trends (2026)
Distribution of Listings by Guest Capacity
Guest Capacity Insights for Wildwood Crest
- The most common guest capacity trend in Wildwood Crest vacation rentals is listings accommodating 6 guests (29.9%). This suggests the primary traveler segment is likely larger groups.
- Properties designed for 6 guests and 8+ guests dominate the Wildwood Crest STR market, accounting for 57.5% of listings.
- 62.0% of properties accommodate 6+ guests, serving the market segment for larger families or group travel in Wildwood Crest.
- On average, properties in Wildwood Crest are equipped to host 5.8 guests.
Wildwood Crest Airbnb Booking Patterns (2026): Available vs. Booked Days
Available Days Distribution
Booked Days Distribution
Booking Pattern Insights for Wildwood Crest
- The most common availability pattern in Wildwood Crest falls within the 271-366 days range, representing 66.1% of listings. This suggests many properties have significant open periods on their calendars.
- Approximately 97.5% of listings show high availability (181+ days open annually), indicating potential for increased bookings or specific owner usage patterns.
- For booked days, the 31-90 days range is most frequent in Wildwood Crest (48.5%), reflecting common guest stay durations or potential owner blocking patterns.
- A notable 3.0% of properties secure long booking periods (181+ days booked per year), highlighting successful long-term rental strategies or significant owner usage.
Wildwood Crest Airbnb Minimum Stay Requirements Analysis
Distribution of Listings by Minimum Night Requirement
1 Night
29 listings
7.3% of total
2 Nights
40 listings
10.1% of total
3 Nights
39 listings
9.8% of total
4-6 Nights
46 listings
11.6% of total
7-29 Nights
16 listings
4% of total
30+ Nights
228 listings
57.3% of total
Key Insights
- The most prevalent minimum stay requirement in Wildwood Crest is 30+ Nights, adopted by 57.3% of listings. This highlights the market's preference for longer commitments.
- Very short stays (1-2 nights) are less common (17.4%), suggesting hosts prefer slightly longer bookings to optimize turnover.
- A significant segment (57.3%) caters to monthly stays (30+ nights) in Wildwood Crest, pointing to opportunities in the extended-stay market.
Recommendations
- Align with the market by considering a 30+ Nights minimum stay, as 57.3% of Wildwood Crest hosts use this setting.
- If feasible, allowing 1-night stays, especially midweek or during low season, could capture last-minute bookings, as only 7.3% currently do.
- Explore offering discounts for stays of 30+ nights to attract the 57.3% of the market seeking extended stays.
- Adjust minimum nights based on seasonality – potentially shorter during low season and longer during peak demand periods in Wildwood Crest.
Wildwood Crest Airbnb Cancellation Policy Trends Analysis (2026)
Super Strict 30 Days
18 listings
4.5% of total
Super Strict 60 Days
34 listings
8.5% of total
Flexible
15 listings
3.8% of total
Moderate
32 listings
8% of total
Firm
176 listings
44.2% of total
Strict
123 listings
30.9% of total
Cancellation Policy Insights for Wildwood Crest
- The prevailing Airbnb cancellation policy trend in Wildwood Crest is Firm, used by 44.2% of listings.
- A majority (75.1%) of hosts in Wildwood Crest utilize Firm or Strict policies, indicating a market where hosts prioritize booking security.
Recommendations for Hosts
- Consider adopting a Firm policy to align with the 44.2% market standard in Wildwood Crest.
- With 30.9% using Strict terms, this is a viable option in Wildwood Crest, particularly for high-value properties or during peak demand periods.
- Regularly review your cancellation policy against competitors and market demand shifts in Wildwood Crest.
Wildwood Crest STR Booking Lead Time Analysis (2026)
Average Booking Lead Time by Month
Booking Lead Time Insights for Wildwood Crest
- The overall average booking lead time for vacation rentals in Wildwood Crest is 78 days.
- Guests book furthest in advance for stays during July (average 103 days), likely coinciding with peak travel demand or local events.
- The shortest booking windows occur for stays in February (average 27 days), indicating more last-minute travel plans during this time.
- Seasonally, Summer (100 days avg.) sees the longest lead times, while Winter (31 days avg.) has the shortest, reflecting typical travel planning cycles.
Recommendations for Hosts
- Use the overall average lead time (78 days) as a baseline for your pricing and availability strategy in Wildwood Crest.
- For July stays, consider implementing length-of-stay discounts or slightly higher rates for bookings made less than 103 days out to capitalize on advance planning.
- Target marketing efforts for the Summer season well in advance (at least 100 days) to capture early planners.
- Monitor your own booking lead times against these Wildwood Crest averages to identify opportunities for dynamic pricing adjustments.
Popular & Essential Airbnb Amenities in Wildwood Crest (2026)
Amenity Prevalence
Amenity Insights for Wildwood Crest
- Essential amenities in Wildwood Crest that guests expect include: Air conditioning, Wifi, Smoke alarm, TV, Fire extinguisher. Lacking these (any) could significantly impact bookings.
- Popular amenities like Kitchen, Coffee maker, Heating are common but not universal. Offering these can provide a competitive edge.
Recommendations for Hosts
- Ensure your listing includes all essential amenities for Wildwood Crest: Air conditioning, Wifi, Smoke alarm, TV, Fire extinguisher.
- Prioritize adding missing essentials: Wifi, Smoke alarm, TV, Fire extinguisher.
- Consider adding popular differentiators like Kitchen or Coffee maker to increase appeal.
- Highlight unique or less common amenities you offer (e.g., hot tub, dedicated workspace, EV charger) in your listing description and photos.
- Regularly check competitor amenities in Wildwood Crest to stay competitive.
Wildwood Crest Airbnb Guest Demographics & Profile Analysis (2026)
Guest Profile Summary for Wildwood Crest
- The typical guest profile for Airbnb in Wildwood Crest consists of primarily domestic travelers (97%), often arriving from nearby Philadelphia, typically belonging to the Post-2000s (Gen Z/Alpha) group (50%), primarily speaking English or Spanish.
- Domestic travelers account for 96.7% of guests.
- Key international markets include United States (96.7%) and Canada (1.1%).
- Top languages spoken are English (75%) followed by Spanish (11.6%).
- A significant demographic segment is the Post-2000s (Gen Z/Alpha) group, representing 50% of guests.
Recommendations for Hosts
- Target domestic marketing efforts towards travelers from Philadelphia and New York.
- Tailor amenities and listing descriptions to appeal to the dominant Post-2000s (Gen Z/Alpha) demographic (e.g., highlight fast WiFi, smart home features, local guides).
- Highlight unique local experiences or amenities relevant to the primary guest profile.
- Consider seasonal promotions aligned with peak travel times for key origin markets.
Nearby Short-Term Rental Market Comparison
How does the Wildwood Crest Airbnb market stack up against its neighbors? Compare key performance metrics like average monthly revenue, ADR, and occupancy rates in surrounding areas to understand the broader regional STR landscape.
| Market | Active Properties | Monthly Revenue | Daily Rate | Avg. Occupancy |
|---|---|---|---|---|
| Cape May Point | 23 | $5,479 | $542.19 | 46% |
| Stone Harbor | 42 | $5,467 | $785.22 | 39% |
| Cape May | 334 | $5,029 | $553.79 | 42% |
| Surf City | 47 | $5,004 | $715.29 | 44% |
| Avalon | 84 | $4,853 | $699.96 | 38% |
| Ship Bottom | 64 | $4,794 | $534.91 | 41% |
| Long Beach Township | 163 | $4,763 | $777.82 | 37% |
| West Cape May | 100 | $4,700 | $480.79 | 46% |
| Harvey Cedars | 25 | $4,567 | $915.05 | 27% |
| Barnegat Light | 20 | $4,499 | $613.05 | 43% |