Summit Airbnb Market Analysis 2026: Short Term Rental Data & Vacation Rental Statistics in New Jersey, United States
Is Airbnb profitable in Summit in 2026? Explore comprehensive Airbnb analytics for Summit, New Jersey, United States to uncover income potential. This 2026 STR market report for Summit, based on AirROI data from February 2025 to January 2026, reveals key trends in the niche market of 24 active listings.
Whether you're considering an Airbnb investment in Summit, optimizing your existing vacation rental, or exploring rental arbitrage opportunities, understanding the Summit Airbnb data is crucial. Leveraging the low regulation environment is key to maximizing your short term rental income potential. Let's dive into the specifics.
Key Summit Airbnb Performance Metrics Overview
Monthly Airbnb Revenue Variations & Income Potential in Summit (2026)
Understanding the monthly revenue variations for Airbnb listings in Summit is key to maximizing your short term rental income potential. Seasonality significantly impacts earnings. Our analysis, based on data from the past 12 months, shows that the peak revenue month for STRs in Summit is typically March, while January often presents the lowest earnings, highlighting opportunities for strategic pricing adjustments during shoulder and low seasons. Explore the typical Airbnb income in Summit across different performance tiers:
- Best-in-class properties (Top 10%) achieve $3,140+ monthly, often utilizing dynamic pricing and superior guest experiences.
- Strong performing properties (Top 25%) earn $2,286 or more, indicating effective management and desirable locations/amenities.
- Typical properties (Median) generate around $1,278 per month, representing the average market performance.
- Entry-level properties (Bottom 25%) see earnings around $697, often with potential for optimization.
Average Monthly Airbnb Earnings Trend in Summit
Summit Airbnb Occupancy Rate Trends (2026)
Maximize your bookings by understanding the Summit STR occupancy trends. Seasonal demand shifts significantly influence how often properties are booked. Typically, Aprilsees the highest demand (peak season occupancy), while November experiences the lowest (low season). Effective strategies, like adjusting minimum stays or offering promotions, can boost occupancy during slower periods. Here's how different property tiers perform in Summit:
- Best-in-class properties (Top 10%) achieve 80%+ occupancy, indicating high desirability and potentially optimized availability.
- Strong performing properties (Top 25%) maintain 54% or higher occupancy, suggesting good market fit and guest satisfaction.
- Typical properties (Median) have an occupancy rate around 30%.
- Entry-level properties (Bottom 25%) average 15% occupancy, potentially facing higher vacancy.
Average Monthly Occupancy Rate Trend in Summit
Average Daily Rate (ADR) Airbnb Trends in Summit (2026)
Effective short term rental pricing strategy in Summit involves understanding monthly ADR fluctuations. The Average Daily Rate (ADR) for Airbnb in Summit typically peaks in May and dips lowest during January. Leveraging Airbnb dynamic pricing tools or strategies based on this seasonality can significantly boost revenue. Here's a look at the typical nightly rates achieved:
- Best-in-class properties (Top 10%) command rates of $218+ per night, often due to premium features or locations.
- Strong performing properties (Top 25%) achieve nightly rates of $179 or more.
- Typical properties (Median) charge around $149 per night.
- Entry-level properties (Bottom 25%) earn around $79 per night.
Average Daily Rate (ADR) Trend by Month in Summit
Get Live Summit Market Intelligence 👇

Explore Real-time Analytics
Airbnb Seasonality Analysis & Trends in Summit (2026)
Peak Season (March, April, May)
- Revenue averages $2,343 per month
- Occupancy rates average 41.8%
- Daily rates average $165
Shoulder Season
- Revenue averages $1,766 per month
- Occupancy maintains around 39.6%
- Daily rates hold near $161
Low Season (January, October, November)
- Revenue drops to average $1,053 per month
- Occupancy decreases to average 26.3%
- Daily rates adjust to average $155
Seasonality Insights for Summit
- The Airbnb seasonality in Summit shows highly seasonal trends requiring careful strategy. While the sections above show seasonal averages, it's also insightful to look at the extremes:
- During the high season, the absolute peak month showcases Summit's highest earning potential, with monthly revenues capable of climbing to $2,570, occupancy reaching a high of 47.0%, and ADRs peaking at $168.
- Conversely, the slowest single month of the year, typically falling within the low season, marks the market's lowest point. In this month, revenue might dip to $967, occupancy could drop to 23.9%, and ADRs may adjust down to $151.
- Understanding both the seasonal averages and these monthly peaks and troughs in revenue, occupancy, and ADR is crucial for maximizing your Airbnb profit potential in Summit.
Seasonal Strategies for Maximizing Profit
- Peak Season: Maximize revenue through premium pricing and potentially longer minimum stays. Ensure high availability.
- Low Season: Offer competitive pricing, special promotions (e.g., extended stay discounts), and flexible cancellation policies. Target off-season travelers like remote workers or budget-conscious guests.
- Shoulder Seasons: Implement dynamic pricing that balances peak and low rates. Target weekend travelers or specific events. Offer slightly more flexible terms than peak season.
- Regularly analyze your own performance against these Summit seasonality benchmarks and adjust your pricing and availability strategy accordingly.
Best Areas for Airbnb Investment in Summit (2026)
Exploring the top neighborhoods for short-term rentals in Summit? This section highlights key areas, outlining why they are attractive for hosts and guests, along with notable local attractions. Consider these locations based on your target guest profile and investment strategy.
| Neighborhood / Area | Why Host Here? (Target Guests & Appeal) | Key Attractions & Landmarks |
|---|---|---|
| Summit Downtown | The heart of Summit features a blend of charming shops, restaurants, and easy access to public transportation. Perfect for travelers who want to experience local culture and convenience in their stay. | Summit Village Green, Watchung Reservation, Studio Players Theatre, South Orange Performing Arts Center, Local cafes and boutiques |
| Watchung Mountains | This scenic area offers stunning views, nature trails, and a peaceful setting, attracting outdoor enthusiasts and those looking to escape the city. | Watchung Reservation, Trails for hiking and biking, Hiking at East & West Watchung Mountains, Great Swamp Wildlife Refuge |
| Family-Friendly Neighborhoods | Summit's residential neighborhoods are known for their excellent schools and family-friendly environment, appealing to families visiting the area or relocating for work. | Memorial Field, Taxter Park, Local playgrounds, Friendly community vibe |
| Historic District | Known for its beautiful historic homes and architecture, the district attracts tourists interested in history and local culture, making it a great area for short-term rentals. | Summit Historical Society, Historic homes tours, Local art exhibitions, Parks and gardens |
| Shady Rest Country Club | This area is known for its historic country club and golf, appealing to visitors interested in recreation and leisure activities within a tranquil environment. | Shady Rest Country Club, Golfing activities, Nearby restaurants, Peaceful surroundings |
| Local Parks | Summit's parks are a major draw for families and outdoor lovers looking for recreational activities during their stay. | Maplewood Park, Greenwood Gardens, Recreation facilities, Playscapes |
| Cultural Hotspot | Summit features a strong community of artists and musicians, making it a lively spot for cultural experiences and events throughout the year. | Arts and cultural festivals, Local galleries, Music events, Community theater productions |
| Proximity to New York City | Summit's easy access to NYC via train makes it a sought-after location for business travelers and tourists wishing to enjoy city amenities without staying in NYC itself. | Direct train to NYC, Variety of dining options, Day trips to NYC attractions, Cultural events in NYC |
Understanding Airbnb License Requirements & STR Laws in Summit (2026)
While Summit, New Jersey, United States currently shows low STR regulations, specific Airbnb license requirements might still exist or change. Always verify the latest short term rental regulations and Airbnb license requirements directly with local government authorities for Summit to ensure full compliance before hosting.
(Source: AirROI data, 2026, finding no licensed listings among those analyzed)
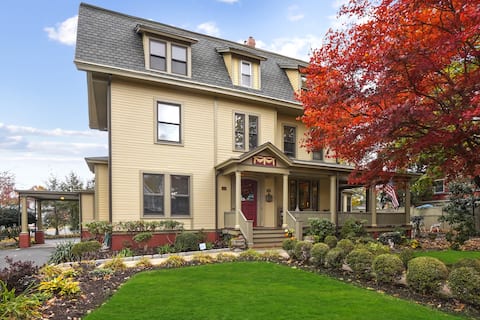
Top Performing Airbnb Properties in Summit (2026)
Benchmark your potential! Explore examples of top-performing Airbnb properties in Summitbased on Trailing Twelve Month (TTM) revenue. Analyze their characteristics, revenue, occupancy rate, and ADR to understand what drives success in this market.
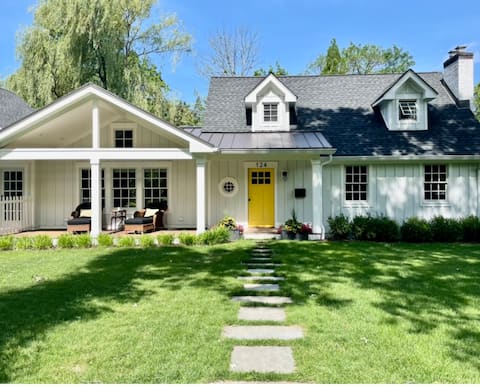
Modern Farmhouse nestled in beautiful Summit NJ
Entire Place • 3 bedrooms

Open Concept APT w/ Gym
Entire Place • 1 bedroom

The DeBary Inn - Junior Queen Room 2
Private Room • 1 bedroom

The Vestibule-Full Room with External Private Bath
Private Room • 1 bedroom
The DeBary Inn - Full Room 12
Private Room • 1 bedroom

The DeBary Inn - Full Room 9
Private Room • 1 bedroom
Note: Performance varies based on location, size, amenities, seasonality, and management quality. Data reflects the past 12 months.
Top Performing Airbnb Hosts in Summit (2026)
Learn from the best! This table showcases top-performing Airbnb hosts in Summit based on the number of properties managed and estimated total revenue over the past year. Analyze their scale and performance metrics.
| Host Name | Properties | Grossing Revenue | Stay Reviews | Avg Rating |
|---|---|---|---|---|
| DeBary | 15 | $226,998 | 253 | 4.81/5.0 |
| Lauralyn S | 1 | $58,831 | 35 | 5.00/5.0 |
| Andrew | 3 | $33,971 | 52 | 4.99/5.0 |
| Eryn | 1 | $32,408 | 53 | 4.70/5.0 |
| Maria | 3 | $25,070 | 71 | 4.66/5.0 |
| David | 1 | $11,140 | 92 | 4.86/5.0 |
Analyzing the strategies of top hosts, such as their property selection, pricing, and guest communication, can offer valuable lessons for optimizing your own Airbnb operations in Summit.
Dive Deeper: Advanced Summit STR Market Data (2026)
Ready to unlock more insights? AirROI provides access to advanced metrics and comprehensive Airbnb data for Summit. Explore detailed analytics beyond this report to refine your investment strategy, optimize pricing, and maximize your vacation rental profits.
Explore Advanced MetricsSummit Short-Term Rental Market Composition (2026): Property & Room Types
Room Type Distribution
Property Type Distribution
Market Composition Insights for Summit
- The Summit Airbnb market composition is heavily skewed towards Private Room listings, which make up 91.7% of the 24 active rentals. This indicates strong guest preference for privacy and space.
- Looking at the property type distribution in Summit, Hotel/Boutique properties are the most common (62.5%), reflecting the local real estate landscape.
- Houses represent a significant 33.3% portion, catering likely to families or larger groups.
- The presence of 62.5% Hotel/Boutique listings indicates integration with traditional hospitality.
- Smaller segments like apartment/condo (combined 4.2%) offer potential for unique stay experiences.
Summit Airbnb Room Capacity Analysis (2026): Bedroom Distribution
Distribution of Listings by Number of Bedrooms
Room Capacity Insights for Summit
- The dominant room capacity in Summit is 1 bedroom listings, making up 62.5% of the market. This suggests a strong demand for properties suitable for couples or solo travelers.
- Together, 1 bedroom and 3 bedrooms properties represent 66.7% of the active Airbnb listings in Summit, indicating a high concentration in these sizes.
- With over half the market (62.5%) consisting of studios or 1-bedroom units, Summit is particularly well-suited for individuals or couples.
- Listings with 3+ bedrooms (4.2%) represent a smaller niche, potentially indicating an underserved market for larger group accommodations in Summit.
Summit Vacation Rental Guest Capacity Trends (2026)
Distribution of Listings by Guest Capacity
Guest Capacity Insights for Summit
- The most common guest capacity trend in Summit vacation rentals is listings accommodating 2 guests (45.8%). This suggests the primary traveler segment is likely couples or solo travelers.
- Properties designed for 2 guests and 4 guests dominate the Summit STR market, accounting for 58.3% of listings.
- A significant 45.8% of listings cater specifically to 1-2 guests, highlighting strong demand from couples and solo travelers in Summit.
- Listings for large groups (6+ guests) are relatively rare (4.2%), potentially indicating an opportunity for hosts targeting this segment in Summit.
- On average, properties in Summit are equipped to host 1.9 guests.
Summit Airbnb Booking Patterns (2026): Available vs. Booked Days
Available Days Distribution
Booked Days Distribution
Booking Pattern Insights for Summit
- The most common availability pattern in Summit falls within the 271-366 days range, representing 54.2% of listings. This suggests many properties have significant open periods on their calendars.
- Approximately 87.5% of listings show high availability (181+ days open annually), indicating potential for increased bookings or specific owner usage patterns.
- For booked days, the 31-90 days range is most frequent in Summit (45.8%), reflecting common guest stay durations or potential owner blocking patterns.
- A notable 12.5% of properties secure long booking periods (181+ days booked per year), highlighting successful long-term rental strategies or significant owner usage.
Summit Airbnb Minimum Stay Requirements Analysis
Distribution of Listings by Minimum Night Requirement
1 Night
13 listings
54.2% of total
2 Nights
2 listings
8.3% of total
3 Nights
1 listings
4.2% of total
4-6 Nights
3 listings
12.5% of total
30+ Nights
5 listings
20.8% of total
Key Insights
- The most prevalent minimum stay requirement in Summit is 1 Night, adopted by 54.2% of listings. This highlights the market's preference for shorter, flexible bookings.
- A strong majority (62.5%) of the Summit Airbnb data shows acceptance of very short stays (1-2 nights), indicating a dynamic, high-turnover market.
- A significant segment (20.8%) caters to monthly stays (30+ nights) in Summit, pointing to opportunities in the extended-stay market.
Recommendations
- Align with the market by considering a 1 Night minimum stay, as 54.2% of Summit hosts use this setting.
- Explore offering discounts for stays of 30+ nights to attract the 20.8% of the market seeking extended stays.
- Adjust minimum nights based on seasonality – potentially shorter during low season and longer during peak demand periods in Summit.
Summit Airbnb Cancellation Policy Trends Analysis (2026)
Moderate
19 listings
79.2% of total
Firm
5 listings
20.8% of total
Cancellation Policy Insights for Summit
- The prevailing Airbnb cancellation policy trend in Summit is Moderate, used by 79.2% of listings.
- The market strongly favors guest-friendly terms, with 79.2% of listings offering Flexible or Moderate policies. This suggests guests in Summit may expect booking flexibility.
Recommendations for Hosts
- Consider adopting a Moderate policy to align with the 79.2% market standard in Summit.
- Regularly review your cancellation policy against competitors and market demand shifts in Summit.
Summit STR Booking Lead Time Analysis (2026)
Average Booking Lead Time by Month
Booking Lead Time Insights for Summit
- The overall average booking lead time for vacation rentals in Summit is 51 days.
- Guests book furthest in advance for stays during May (average 89 days), likely coinciding with peak travel demand or local events.
- The shortest booking windows occur for stays in March (average 25 days), indicating more last-minute travel plans during this time.
- Seasonally, Spring (61 days avg.) sees the longest lead times, while Winter (35 days avg.) has the shortest, reflecting typical travel planning cycles.
Recommendations for Hosts
- Use the overall average lead time (51 days) as a baseline for your pricing and availability strategy in Summit.
- For May stays, consider implementing length-of-stay discounts or slightly higher rates for bookings made less than 89 days out to capitalize on advance planning.
- Target marketing efforts for the Spring season well in advance (at least 61 days) to capture early planners.
- Monitor your own booking lead times against these Summit averages to identify opportunities for dynamic pricing adjustments.
Popular & Essential Airbnb Amenities in Summit (2026)
Amenity Prevalence
Amenity Insights for Summit
- Essential amenities in Summit that guests expect include: Wifi, TV, Heating, Free parking on premises, Carbon monoxide alarm, Fire extinguisher, Air conditioning, Smoke alarm, Essentials, Hair dryer. Lacking these (any) could significantly impact bookings.
Recommendations for Hosts
- Ensure your listing includes all essential amenities for Summit: Wifi, TV, Heating, Free parking on premises, Carbon monoxide alarm, Fire extinguisher, Air conditioning, Smoke alarm, Essentials, Hair dryer.
- Prioritize adding missing essentials: Hair dryer.
- Highlight unique or less common amenities you offer (e.g., hot tub, dedicated workspace, EV charger) in your listing description and photos.
- Regularly check competitor amenities in Summit to stay competitive.
Summit Airbnb Guest Demographics & Profile Analysis (2026)
Guest Profile Summary for Summit
- The typical guest profile for Airbnb in Summit consists of primarily domestic travelers (95%), often arriving from nearby Summit, typically belonging to the Post-2000s (Gen Z/Alpha) group (50%), primarily speaking English or Spanish.
- Domestic travelers account for 94.7% of guests.
- Key international markets include United States (94.7%) and DC (1.8%).
- Top languages spoken are English (56.4%) followed by Spanish (15.4%).
- A significant demographic segment is the Post-2000s (Gen Z/Alpha) group, representing 50% of guests.
Recommendations for Hosts
- Target domestic marketing efforts towards travelers from Summit and Decatur.
- Tailor amenities and listing descriptions to appeal to the dominant Post-2000s (Gen Z/Alpha) demographic (e.g., highlight fast WiFi, smart home features, local guides).
- Highlight unique local experiences or amenities relevant to the primary guest profile.
- Consider seasonal promotions aligned with peak travel times for key origin markets.
Nearby Short-Term Rental Market Comparison
How does the Summit Airbnb market stack up against its neighbors? Compare key performance metrics like average monthly revenue, ADR, and occupancy rates in surrounding areas to understand the broader regional STR landscape.
| Market | Active Properties | Monthly Revenue | Daily Rate | Avg. Occupancy |
|---|---|---|---|---|
| Freeland | 11 | $8,436 | $684.29 | 42% |
| Berlin Township | 15 | $7,208 | $729.10 | 35% |
| Town of Kingston | 10 | $6,470 | $473.76 | 49% |
| Frankford Township | 11 | $6,329 | $505.19 | 41% |
| Spring Lake Heights | 16 | $5,785 | $725.20 | 40% |
| Stroud Township | 137 | $5,728 | $478.40 | 40% |
| Town of Monroe | 22 | $5,690 | $720.52 | 37% |
| Hilltown Township | 11 | $5,557 | $578.96 | 40% |
| Stone Harbor | 42 | $5,467 | $785.22 | 39% |
| Mount Pocono | 22 | $5,346 | $485.18 | 45% |