South Orange Airbnb Market Analysis 2025: Short Term Rental Data & Vacation Rental Statistics in New Jersey, United States
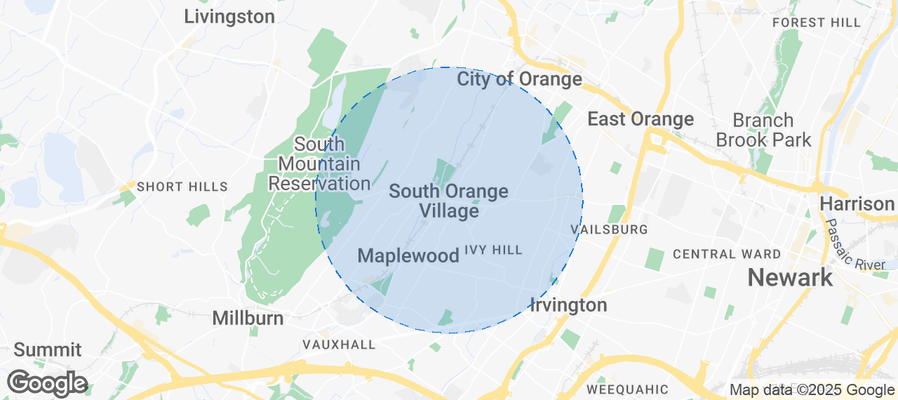
Is Airbnb profitable in South Orange in 2025? Explore comprehensive Airbnb analytics for South Orange, New Jersey, United States to uncover income potential. This 2025 STR market report for South Orange, based on AirROI data from November 2024 to October 2025, reveals key trends in the niche market of 18 active listings.
Whether you're considering an Airbnb investment in South Orange, optimizing your existing vacation rental, or exploring rental arbitrage opportunities, understanding the South Orange Airbnb data is crucial. Leveraging the low regulation environment is key to maximizing your short term rental income potential. Let's dive into the specifics.
Key South Orange Airbnb Performance Metrics Overview
Monthly Airbnb Revenue Variations & Income Potential in South Orange (2025)
Understanding the monthly revenue variations for Airbnb listings in South Orange is key to maximizing your short term rental income potential. Seasonality significantly impacts earnings. Our analysis, based on data from the past 12 months, shows that the peak revenue month for STRs in South Orange is typically December, while October often presents the lowest earnings, highlighting opportunities for strategic pricing adjustments during shoulder and low seasons. Explore the typical Airbnb income in South Orange across different performance tiers:
- Best-in-class properties (Top 10%) achieve $5,494+ monthly, often utilizing dynamic pricing and superior guest experiences.
- Strong performing properties (Top 25%) earn $4,280 or more, indicating effective management and desirable locations/amenities.
- Typical properties (Median) generate around $2,185 per month, representing the average market performance.
- Entry-level properties (Bottom 25%) see earnings around $1,334, often with potential for optimization.
Average Monthly Airbnb Earnings Trend in South Orange
South Orange Airbnb Occupancy Rate Trends (2025)
Maximize your bookings by understanding the South Orange STR occupancy trends. Seasonal demand shifts significantly influence how often properties are booked. Typically, Decembersees the highest demand (peak season occupancy), while January experiences the lowest (low season). Effective strategies, like adjusting minimum stays or offering promotions, can boost occupancy during slower periods. Here's how different property tiers perform in South Orange:
- Best-in-class properties (Top 10%) achieve 84%+ occupancy, indicating high desirability and potentially optimized availability.
- Strong performing properties (Top 25%) maintain 73% or higher occupancy, suggesting good market fit and guest satisfaction.
- Typical properties (Median) have an occupancy rate around 55%.
- Entry-level properties (Bottom 25%) average 36% occupancy, potentially facing higher vacancy.
Average Monthly Occupancy Rate Trend in South Orange
Average Daily Rate (ADR) Airbnb Trends in South Orange (2025)
Effective short term rental pricing strategy in South Orange involves understanding monthly ADR fluctuations. The Average Daily Rate (ADR) for Airbnb in South Orange typically peaks in December and dips lowest during September. Leveraging Airbnb dynamic pricing tools or strategies based on this seasonality can significantly boost revenue. Here's a look at the typical nightly rates achieved:
- Best-in-class properties (Top 10%) command rates of $458+ per night, often due to premium features or locations.
- Strong performing properties (Top 25%) achieve nightly rates of $259 or more.
- Typical properties (Median) charge around $183 per night.
- Entry-level properties (Bottom 25%) earn around $98 per night.
Average Daily Rate (ADR) Trend by Month in South Orange
Get Live South Orange Market Intelligence 👇
Explore Real-time Analytics
Airbnb Seasonality Analysis & Trends in South Orange (2025)
Peak Season (December, March, May)
- Revenue averages $3,706 per month
- Occupancy rates average 62.0%
- Daily rates average $251
Shoulder Season
- Revenue averages $3,080 per month
- Occupancy maintains around 57.3%
- Daily rates hold near $228
Low Season (January, February, October)
- Revenue drops to average $1,938 per month
- Occupancy decreases to average 39.1%
- Daily rates adjust to average $237
Seasonality Insights for South Orange
- The Airbnb seasonality in South Orange shows highly seasonal trends requiring careful strategy. While the sections above show seasonal averages, it's also insightful to look at the extremes:
- During the high season, the absolute peak month showcases South Orange's highest earning potential, with monthly revenues capable of climbing to $4,214, occupancy reaching a high of 68.3%, and ADRs peaking at $257.
- Conversely, the slowest single month of the year, typically falling within the low season, marks the market's lowest point. In this month, revenue might dip to $1,672, occupancy could drop to 36.6%, and ADRs may adjust down to $212.
- Understanding both the seasonal averages and these monthly peaks and troughs in revenue, occupancy, and ADR is crucial for maximizing your Airbnb profit potential in South Orange.
Seasonal Strategies for Maximizing Profit
- Peak Season: Maximize revenue through premium pricing and potentially longer minimum stays. Ensure high availability.
- Low Season: Offer competitive pricing, special promotions (e.g., extended stay discounts), and flexible cancellation policies. Target off-season travelers like remote workers or budget-conscious guests.
- Shoulder Seasons: Implement dynamic pricing that balances peak and low rates. Target weekend travelers or specific events. Offer slightly more flexible terms than peak season.
- Regularly analyze your own performance against these South Orange seasonality benchmarks and adjust your pricing and availability strategy accordingly.
Best Areas for Airbnb Investment in South Orange (2025)
Exploring the top neighborhoods for short-term rentals in South Orange? This section highlights key areas, outlining why they are attractive for hosts and guests, along with notable local attractions. Consider these locations based on your target guest profile and investment strategy.
| Neighborhood / Area | Why Host Here? (Target Guests & Appeal) | Key Attractions & Landmarks |
|---|---|---|
| Seton Village | Charming neighborhood known for its historic homes and close-knit community. Ideal for families and visitors wanting a quieter stay, with access to local parks and amenities. | Seton Hall University, South Orange Community Center, Mead Park, South Orange Performing Arts Center, Local restaurants and cafes |
| South Orange Village Center | The heart of South Orange with a vibrant downtown atmosphere. Perfect for guests looking for shops, dining, and cultural activities within walking distance. | South Orange Farmers Market, The Baird Center, South Orange Public Library, Local boutiques and eateries, The Village Coffee |
| Maplewood | Adjacent to South Orange, it's an increasingly popular area for those wanting a suburban vibe with urban accessibility. Attracts families and professionals. | Maplewood Village, Memorial Park, Durand-Hedden House and Garden, Local dining options, Family-friendly events |
| Seth Boyden | A residential area that is peaceful and community-oriented. Great for those who prefer a more laid-back environment during their stay. | Seth Boyden School, Local playgrounds, Friendly neighborhood atmosphere |
| Andrew's Park | A small park area that offers recreational opportunities and is appealing to couples or families looking for outdoor activities nearby. | Andrew's Park, Various walking trails, Community events held in the park |
| Clinton Avenue | A diverse area with access to transportation, shops, and restaurants. Attracts both tourists and business travelers due to its convenience. | Local restaurants, Clinton Avenue shops, Public transport access, Nearby parks |
| South Orange Historic District | Rich in history and architecture, this area provides guests with a picturesque setting and cultural experiences. | Historic homes, Local museums, Guided walking tours, Cultural events in the area |
| Montrose Park | A scenic park area ideal for families. Offers ample space for outdoor activities and is close to community amenities. | Montrose Park, South Orange Tennis Club, Nearby dining, Community sports events |
Understanding Airbnb License Requirements & STR Laws in South Orange (2025)
While South Orange, New Jersey, United States currently shows low STR regulations, specific Airbnb license requirements might still exist or change. Always verify the latest short term rental regulations and Airbnb license requirements directly with local government authorities for South Orange to ensure full compliance before hosting.
(Source: AirROI data, 2025, finding no licensed listings among those analyzed)
Top Performing Airbnb Properties in South Orange (2025)
Benchmark your potential! Explore examples of top-performing Airbnb properties in South Orangebased on Trailing Twelve Month (TTM) revenue. Analyze their characteristics, revenue, occupancy rate, and ADR to understand what drives success in this market.

Stunning Mid-Century Retreat
Entire Place • 4 bedrooms

46 Church St 2 : Good vibes steps from NYC train
Entire Place • 2 bedrooms

48 Church: South Orange Townhome 1blk from Transit
Entire Place • 2 bedrooms

46 Church St: Apartment steps from transit to NYC
Entire Place • 2 bedrooms
Private 1 bedroom apartment with separate entrance
Entire Place • 1 bedroom

Guest Studio w/Kitchenette
Entire Place • N/A
Note: Performance varies based on location, size, amenities, seasonality, and management quality. Data reflects the past 12 months.
Top Performing Airbnb Hosts in South Orange (2025)
Learn from the best! This table showcases top-performing Airbnb hosts in South Orange based on the number of properties managed and estimated total revenue over the past year. Analyze their scale and performance metrics.
| Host Name | Properties | Grossing Revenue | Stay Reviews | Avg Rating |
|---|---|---|---|---|
| Anthony | 3 | $142,368 | 115 | 4.81/5.0 |
| Lee | 1 | $69,298 | 34 | 5.00/5.0 |
| Jennifer | 1 | $42,269 | 467 | 4.87/5.0 |
| Denis | 2 | $37,765 | 8 | 5.00/5.0 |
| Steve And Roma | 1 | $30,870 | 77 | 4.94/5.0 |
| Renee | 1 | $27,441 | 11 | 5.00/5.0 |
| Elius | 1 | $22,371 | 43 | 4.67/5.0 |
| Ari | 1 | $15,756 | 131 | 4.81/5.0 |
| David | 1 | $13,810 | 44 | 4.91/5.0 |
| Cynthia | 1 | $9,779 | 43 | 4.51/5.0 |
Analyzing the strategies of top hosts, such as their property selection, pricing, and guest communication, can offer valuable lessons for optimizing your own Airbnb operations in South Orange.
Dive Deeper: Advanced South Orange STR Market Data (2025)
Ready to unlock more insights? AirROI provides access to advanced metrics and comprehensive Airbnb data for South Orange. Explore detailed analytics beyond this report to refine your investment strategy, optimize pricing, and maximize your vacation rental profits.
Explore Advanced MetricsSouth Orange Short-Term Rental Market Composition (2025): Property & Room Types
Room Type Distribution
Property Type Distribution
Market Composition Insights for South Orange
- The South Orange Airbnb market composition is heavily skewed towards Entire Home/Apt listings, which make up 83.3% of the 18 active rentals. This indicates strong guest preference for privacy and space.
- Looking at the property type distribution in South Orange, House properties are the most common (61.1%), reflecting the local real estate landscape.
- Houses represent a significant 61.1% portion, catering likely to families or larger groups.
- The presence of 5.6% Hotel/Boutique listings indicates integration with traditional hospitality.
South Orange Airbnb Room Capacity Analysis (2025): Bedroom Distribution
Distribution of Listings by Number of Bedrooms
Room Capacity Insights for South Orange
- The dominant room capacity in South Orange is 1 bedroom listings, making up 27.8% of the market. This suggests a strong demand for properties suitable for couples or solo travelers.
- Together, 1 bedroom and 2 bedrooms properties represent 50.0% of the active Airbnb listings in South Orange, indicating a high concentration in these sizes.
- A significant 33.3% of listings offer 3+ bedrooms, catering to larger groups and families seeking more space in South Orange.
South Orange Vacation Rental Guest Capacity Trends (2025)
Distribution of Listings by Guest Capacity
Guest Capacity Insights for South Orange
- The most common guest capacity trend in South Orange vacation rentals is listings accommodating 5 guests (22.2%). This suggests the primary traveler segment is likely larger groups.
- Properties designed for 5 guests and 2 guests dominate the South Orange STR market, accounting for 44.4% of listings.
- 22.3% of properties accommodate 6+ guests, serving the market segment for larger families or group travel in South Orange.
- On average, properties in South Orange are equipped to host 3.8 guests.
South Orange Airbnb Booking Patterns (2025): Available vs. Booked Days
Available Days Distribution
Booked Days Distribution
Booking Pattern Insights for South Orange
- The most common availability pattern in South Orange falls within the 271-366 days range, representing 44.4% of listings. This suggests many properties have significant open periods on their calendars.
- Approximately 55.5% of listings show high availability (181+ days open annually), indicating potential for increased bookings or specific owner usage patterns.
- For booked days, the 181-270 days range is most frequent in South Orange (44.4%), reflecting common guest stay durations or potential owner blocking patterns.
- A notable 44.4% of properties secure long booking periods (181+ days booked per year), highlighting successful long-term rental strategies or significant owner usage.
South Orange Airbnb Minimum Stay Requirements Analysis
Distribution of Listings by Minimum Night Requirement
1 Night
2 listings
11.1% of total
2 Nights
5 listings
27.8% of total
3 Nights
1 listings
5.6% of total
7-29 Nights
3 listings
16.7% of total
30+ Nights
7 listings
38.9% of total
Key Insights
- The most prevalent minimum stay requirement in South Orange is 30+ Nights, adopted by 38.9% of listings. This highlights the market's preference for longer commitments.
- A significant segment (38.9%) caters to monthly stays (30+ nights) in South Orange, pointing to opportunities in the extended-stay market.
Recommendations
- Align with the market by considering a 30+ Nights minimum stay, as 38.9% of South Orange hosts use this setting.
- If feasible, allowing 1-night stays, especially midweek or during low season, could capture last-minute bookings, as only 11.1% currently do.
- Explore offering discounts for stays of 30+ nights to attract the 38.9% of the market seeking extended stays.
- Adjust minimum nights based on seasonality – potentially shorter during low season and longer during peak demand periods in South Orange.
South Orange Airbnb Cancellation Policy Trends Analysis (2025)
Flexible
5 listings
27.8% of total
Moderate
8 listings
44.4% of total
Firm
5 listings
27.8% of total
Cancellation Policy Insights for South Orange
- The prevailing Airbnb cancellation policy trend in South Orange is Moderate, used by 44.4% of listings.
- The market strongly favors guest-friendly terms, with 72.2% of listings offering Flexible or Moderate policies. This suggests guests in South Orange may expect booking flexibility.
Recommendations for Hosts
- Consider adopting a Moderate policy to align with the 44.4% market standard in South Orange.
- Regularly review your cancellation policy against competitors and market demand shifts in South Orange.
South Orange STR Booking Lead Time Analysis (2025)
Average Booking Lead Time by Month
Booking Lead Time Insights for South Orange
- The overall average booking lead time for vacation rentals in South Orange is 31 days.
- Guests book furthest in advance for stays during May (average 56 days), likely coinciding with peak travel demand or local events.
- The shortest booking windows occur for stays in March (average 17 days), indicating more last-minute travel plans during this time.
- Seasonally, Fall (35 days avg.) sees the longest lead times, while Summer (24 days avg.) has the shortest, reflecting typical travel planning cycles.
Recommendations for Hosts
- Use the overall average lead time (31 days) as a baseline for your pricing and availability strategy in South Orange.
- For May stays, consider implementing length-of-stay discounts or slightly higher rates for bookings made less than 56 days out to capitalize on advance planning.
- Target marketing efforts for the Fall season well in advance (at least 35 days) to capture early planners.
- Monitor your own booking lead times against these South Orange averages to identify opportunities for dynamic pricing adjustments.
Popular & Essential Airbnb Amenities in South Orange (2025)
Amenity Prevalence
Amenity Insights for South Orange
- Essential amenities in South Orange that guests expect include: Air conditioning, Carbon monoxide alarm. Lacking these (any) could significantly impact bookings.
- Popular amenities like Wifi, Smoke alarm, Essentials are common but not universal. Offering these can provide a competitive edge.
- Warning: Wifi is not universally provided but is considered essential globally. Ensure reliable Wifi is offered.
Recommendations for Hosts
- Ensure your listing includes all essential amenities for South Orange: Air conditioning, Carbon monoxide alarm.
- Consider adding popular differentiators like Wifi or Smoke alarm to increase appeal.
- Highlight unique or less common amenities you offer (e.g., hot tub, dedicated workspace, EV charger) in your listing description and photos.
- Regularly check competitor amenities in South Orange to stay competitive.
South Orange Airbnb Guest Demographics & Profile Analysis (2025)
Guest Profile Summary for South Orange
- The typical guest profile for Airbnb in South Orange consists of primarily domestic travelers (78%), often arriving from nearby Washington, typically belonging to the Post-2000s (Gen Z/Alpha) group (50%), primarily speaking English or Spanish.
- Domestic travelers account for 77.7% of guests.
- Key international markets include United States (77.7%) and DC (6.4%).
- Top languages spoken are English (63.9%) followed by Spanish (13.9%).
- A significant demographic segment is the Post-2000s (Gen Z/Alpha) group, representing 50% of guests.
Recommendations for Hosts
- Target domestic marketing efforts towards travelers from Washington and South Orange.
- Tailor amenities and listing descriptions to appeal to the dominant Post-2000s (Gen Z/Alpha) demographic (e.g., highlight fast WiFi, smart home features, local guides).
- Highlight unique local experiences or amenities relevant to the primary guest profile.
- Consider seasonal promotions aligned with peak travel times for key origin markets.
Nearby Short-Term Rental Market Comparison
How does the South Orange Airbnb market stack up against its neighbors? Compare key performance metrics like average monthly revenue, ADR, and occupancy rates in surrounding areas to understand the broader regional STR landscape.
| Market | Active Properties | Monthly Revenue | Daily Rate | Avg. Occupancy |
|---|---|---|---|---|
| Freeland | 10 | $9,465 | $755.73 | 40% |
| Berlin Township | 15 | $7,289 | $729.20 | 35% |
| Stroud Township | 141 | $5,934 | $488.89 | 41% |
| Spring Lake Heights | 17 | $5,658 | $715.85 | 39% |
| Town of Kingston | 12 | $5,654 | $468.91 | 46% |
| Frankford Township | 13 | $5,633 | $569.39 | 41% |
| Penn Estates | 50 | $5,567 | $430.94 | 46% |
| Pocono Township | 99 | $5,394 | $484.20 | 36% |
| Stone Harbor | 39 | $5,364 | $785.43 | 36% |
| Mount Pocono | 22 | $5,287 | $482.63 | 42% |