Seaside Heights Airbnb Market Analysis 2026: Short Term Rental Data & Vacation Rental Statistics in New Jersey, United States
Is Airbnb profitable in Seaside Heights in 2026? Explore comprehensive Airbnb analytics for Seaside Heights, New Jersey, United States to uncover income potential. This 2026 STR market report for Seaside Heights, based on AirROI data from February 2025 to January 2026, reveals key trends in the market of 536 active listings.
Whether you're considering an Airbnb investment in Seaside Heights, optimizing your existing vacation rental, or exploring rental arbitrage opportunities, understanding the Seaside Heights Airbnb data is crucial. Leveraging the low regulation environment is key to maximizing your short term rental income potential. Let's dive into the specifics.
Key Seaside Heights Airbnb Performance Metrics Overview
Monthly Airbnb Revenue Variations & Income Potential in Seaside Heights (2026)
Understanding the monthly revenue variations for Airbnb listings in Seaside Heights is key to maximizing your short term rental income potential. Seasonality significantly impacts earnings. Our analysis, based on data from the past 12 months, shows that the peak revenue month for STRs in Seaside Heights is typically July, while February often presents the lowest earnings, highlighting opportunities for strategic pricing adjustments during shoulder and low seasons. Explore the typical Airbnb income in Seaside Heights across different performance tiers:
- Best-in-class properties (Top 10%) achieve $8,296+ monthly, often utilizing dynamic pricing and superior guest experiences.
- Strong performing properties (Top 25%) earn $5,549 or more, indicating effective management and desirable locations/amenities.
- Typical properties (Median) generate around $3,204 per month, representing the average market performance.
- Entry-level properties (Bottom 25%) see earnings around $1,647, often with potential for optimization.
Average Monthly Airbnb Earnings Trend in Seaside Heights
Seaside Heights Airbnb Occupancy Rate Trends (2026)
Maximize your bookings by understanding the Seaside Heights STR occupancy trends. Seasonal demand shifts significantly influence how often properties are booked. Typically, Augustsees the highest demand (peak season occupancy), while January experiences the lowest (low season). Effective strategies, like adjusting minimum stays or offering promotions, can boost occupancy during slower periods. Here's how different property tiers perform in Seaside Heights:
- Best-in-class properties (Top 10%) achieve 75%+ occupancy, indicating high desirability and potentially optimized availability.
- Strong performing properties (Top 25%) maintain 56% or higher occupancy, suggesting good market fit and guest satisfaction.
- Typical properties (Median) have an occupancy rate around 33%.
- Entry-level properties (Bottom 25%) average 17% occupancy, potentially facing higher vacancy.
Average Monthly Occupancy Rate Trend in Seaside Heights
Average Daily Rate (ADR) Airbnb Trends in Seaside Heights (2026)
Effective short term rental pricing strategy in Seaside Heights involves understanding monthly ADR fluctuations. The Average Daily Rate (ADR) for Airbnb in Seaside Heights typically peaks in July and dips lowest during February. Leveraging Airbnb dynamic pricing tools or strategies based on this seasonality can significantly boost revenue. Here's a look at the typical nightly rates achieved:
- Best-in-class properties (Top 10%) command rates of $679+ per night, often due to premium features or locations.
- Strong performing properties (Top 25%) achieve nightly rates of $451 or more.
- Typical properties (Median) charge around $312 per night.
- Entry-level properties (Bottom 25%) earn around $230 per night.
Average Daily Rate (ADR) Trend by Month in Seaside Heights
Get Live Seaside Heights Market Intelligence 👇

Explore Real-time Analytics
Airbnb Seasonality Analysis & Trends in Seaside Heights (2026)
Peak Season (July, August, June)
- Revenue averages $7,224 per month
- Occupancy rates average 51.9%
- Daily rates average $432
Shoulder Season
- Revenue averages $3,473 per month
- Occupancy maintains around 34.4%
- Daily rates hold near $369
Low Season (January, February, March)
- Revenue drops to average $2,357 per month
- Occupancy decreases to average 30.9%
- Daily rates adjust to average $345
Seasonality Insights for Seaside Heights
- The Airbnb seasonality in Seaside Heights shows highly seasonal trends requiring careful strategy. While the sections above show seasonal averages, it's also insightful to look at the extremes:
- During the high season, the absolute peak month showcases Seaside Heights's highest earning potential, with monthly revenues capable of climbing to $8,252, occupancy reaching a high of 58.6%, and ADRs peaking at $439.
- Conversely, the slowest single month of the year, typically falling within the low season, marks the market's lowest point. In this month, revenue might dip to $1,820, occupancy could drop to 26.7%, and ADRs may adjust down to $336.
- Understanding both the seasonal averages and these monthly peaks and troughs in revenue, occupancy, and ADR is crucial for maximizing your Airbnb profit potential in Seaside Heights.
Seasonal Strategies for Maximizing Profit
- Peak Season: Maximize revenue through premium pricing and potentially longer minimum stays. Ensure high availability.
- Low Season: Offer competitive pricing, special promotions (e.g., extended stay discounts), and flexible cancellation policies. Target off-season travelers like remote workers or budget-conscious guests.
- Shoulder Seasons: Implement dynamic pricing that balances peak and low rates. Target weekend travelers or specific events. Offer slightly more flexible terms than peak season.
- Regularly analyze your own performance against these Seaside Heights seasonality benchmarks and adjust your pricing and availability strategy accordingly.
Best Areas for Airbnb Investment in Seaside Heights (2026)
Exploring the top neighborhoods for short-term rentals in Seaside Heights? This section highlights key areas, outlining why they are attractive for hosts and guests, along with notable local attractions. Consider these locations based on your target guest profile and investment strategy.
| Neighborhood / Area | Why Host Here? (Target Guests & Appeal) | Key Attractions & Landmarks |
|---|---|---|
| Central Avenue | The main thoroughfare through Seaside Heights, bustling with restaurants, shops, and close proximity to the beach boardwalk. It's a popular area for tourists looking for convenience and entertainment. | Seaside Heights Boardwalk, Karma Nightclub, The Jersey Shore House, Maruca's Tomato Pies, Silver Bullet Bar |
| On the Boardwalk | Direct access to the beach and a variety of amusement parks and games. This area attracts families and young adults, making it a prime spot for short-term rentals. | Seaside Heights Amusement Pier, Water Park, Tram Car, Beachfront dining, Arcades |
| Midway Avenue | A quieter residential street close to the bustling boardwalk and beach, offering a balance of peace and entertainment for vacationers who want to relax yet be close to excitement. | Seaside Park Beach, Heights Beach Club, Family-friendly restaurants, Local boutiques, Ice cream shops |
| Ocean Terrace | A beachfront street filled with condos and hotels, ideal for vacationers who enjoy ocean views and easy beach access. Perfect for those looking for a laid-back holiday vibe. | Ocean Terrace Beach, Shells Bar and Grill, Sunset Beach, Fishing Village, Surfing lessons |
| Sumner Avenue | Offers a more local experience with charming small businesses and residential homes. It's great for travelers who prefer a more authentic stay away from tourist spots. | Local parks, Coffee shops, Unique diners, Artisan shops, Cultural events |
| Bay Boulevard | A scenic area by the bay that caters to those seeking a quieter environment. It’s perfect for water sports enthusiasts and nature lovers looking for leisure activities. | Sunset views, Kayaking, Fishing spots, Local seafood restaurants, Marinas |
| Ocean County Park | This area is a little further from the main attractions, but offers natural beauty and tranquility, appealing to visitors who enjoy outdoor activities and parks. | Nature trails, Picnic areas, Playgrounds, Fishing facilities, Wildlife viewing |
| Seaside Heights Waterfront | Located near the water, this area features multiple family-friendly activities and quick access to both the beach and the bay, making it attractive for diverse groups of travelers. | Boardwalk attractions, Restaurants with a view, Fishing and boating activities, Warm summer events, Historical landmarks |
Understanding Airbnb License Requirements & STR Laws in Seaside Heights (2026)
While Seaside Heights, New Jersey, United States currently shows low STR regulations, specific Airbnb license requirements might still exist or change. Always verify the latest short term rental regulations and Airbnb license requirements directly with local government authorities for Seaside Heights to ensure full compliance before hosting.
(Source: AirROI data, 2026, finding no licensed listings among those analyzed)
Top Performing Airbnb Properties in Seaside Heights (2026)
Benchmark your potential! Explore examples of top-performing Airbnb properties in Seaside Heightsbased on Trailing Twelve Month (TTM) revenue. Analyze their characteristics, revenue, occupancy rate, and ADR to understand what drives success in this market.

Hot Tub | Game Room | Deeply cleaned | EV Charger
Entire Place • 6 bedrooms

Game Room | Washer/Dryer | Coffee | Pro Cleaned
Entire Place • 4 bedrooms
A Shore Thing
Entire Place • 4 bedrooms

Premium Linen+Towels | Fast Wifi | Coffee Included
Entire Place • 5 bedrooms
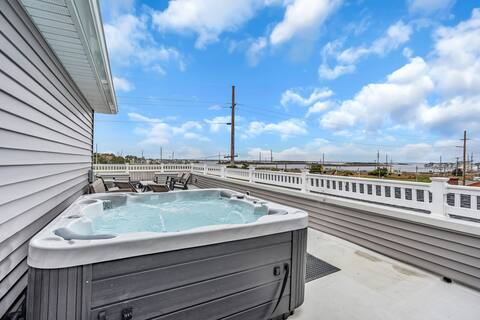
Fast Wifi | Rooftop HotTub | Pet Friendly | Coffee
Entire Place • 4 bedrooms

Hot Tub! Beach Block! Rooftop! Steps to Boardwalk!
Entire Place • 4 bedrooms
Note: Performance varies based on location, size, amenities, seasonality, and management quality. Data reflects the past 12 months.
Top Performing Airbnb Hosts in Seaside Heights (2026)
Learn from the best! This table showcases top-performing Airbnb hosts in Seaside Heights based on the number of properties managed and estimated total revenue over the past year. Analyze their scale and performance metrics.
| Host Name | Properties | Grossing Revenue | Stay Reviews | Avg Rating |
|---|---|---|---|---|
| Breezy Beach Stays LLC | 32 | $2,569,765 | 998 | 4.99/5.0 |
| Jim | 27 | $768,362 | 230 | 4.88/5.0 |
| Lazy River Rentals | 21 | $588,563 | 353 | 4.61/5.0 |
| Madeline | 11 | $474,859 | 368 | 4.75/5.0 |
| John Anthony | 27 | $460,561 | 376 | 4.86/5.0 |
| Mike | 8 | $389,691 | 391 | 4.88/5.0 |
| Michael | 7 | $381,471 | 458 | 4.97/5.0 |
| Jack & Vivian | 13 | $336,938 | 807 | 4.93/5.0 |
| Bryana | 3 | $330,266 | 123 | 4.99/5.0 |
| Michael | 5 | $326,128 | 269 | 4.98/5.0 |
Analyzing the strategies of top hosts, such as their property selection, pricing, and guest communication, can offer valuable lessons for optimizing your own Airbnb operations in Seaside Heights.
Dive Deeper: Advanced Seaside Heights STR Market Data (2026)
Ready to unlock more insights? AirROI provides access to advanced metrics and comprehensive Airbnb data for Seaside Heights. Explore detailed analytics beyond this report to refine your investment strategy, optimize pricing, and maximize your vacation rental profits.
Explore Advanced MetricsSeaside Heights Short-Term Rental Market Composition (2026): Property & Room Types
Room Type Distribution
Property Type Distribution
Market Composition Insights for Seaside Heights
- The Seaside Heights Airbnb market composition is heavily skewed towards Entire Home/Apt listings, which make up 98.1% of the 536 active rentals. This indicates strong guest preference for privacy and space.
- Looking at the property type distribution in Seaside Heights, House properties are the most common (49.3%), reflecting the local real estate landscape.
- Houses represent a significant 49.3% portion, catering likely to families or larger groups.
- Smaller segments like hotel/boutique, others (combined 2.7%) offer potential for unique stay experiences.
Seaside Heights Airbnb Room Capacity Analysis (2026): Bedroom Distribution
Distribution of Listings by Number of Bedrooms
Room Capacity Insights for Seaside Heights
- The dominant room capacity in Seaside Heights is 2 bedrooms listings, making up 39.4% of the market. This suggests a strong demand for properties suitable for couples or solo travelers.
- Together, 2 bedrooms and 3 bedrooms properties represent 63.1% of the active Airbnb listings in Seaside Heights, indicating a high concentration in these sizes.
- A significant 48.1% of listings offer 3+ bedrooms, catering to larger groups and families seeking more space in Seaside Heights.
Seaside Heights Vacation Rental Guest Capacity Trends (2026)
Distribution of Listings by Guest Capacity
Guest Capacity Insights for Seaside Heights
- The most common guest capacity trend in Seaside Heights vacation rentals is listings accommodating 8+ guests (29.5%). This suggests the primary traveler segment is likely larger groups.
- Properties designed for 8+ guests and 4 guests dominate the Seaside Heights STR market, accounting for 54.5% of listings.
- 57.7% of properties accommodate 6+ guests, serving the market segment for larger families or group travel in Seaside Heights.
- On average, properties in Seaside Heights are equipped to host 5.7 guests.
Seaside Heights Airbnb Booking Patterns (2026): Available vs. Booked Days
Available Days Distribution
Booked Days Distribution
Booking Pattern Insights for Seaside Heights
- The most common availability pattern in Seaside Heights falls within the 271-366 days range, representing 64.6% of listings. This suggests many properties have significant open periods on their calendars.
- Approximately 92.2% of listings show high availability (181+ days open annually), indicating potential for increased bookings or specific owner usage patterns.
- For booked days, the 31-90 days range is most frequent in Seaside Heights (47.6%), reflecting common guest stay durations or potential owner blocking patterns.
- A notable 8.0% of properties secure long booking periods (181+ days booked per year), highlighting successful long-term rental strategies or significant owner usage.
Seaside Heights Airbnb Minimum Stay Requirements Analysis
Distribution of Listings by Minimum Night Requirement
1 Night
42 listings
7.8% of total
2 Nights
72 listings
13.4% of total
3 Nights
42 listings
7.8% of total
4-6 Nights
32 listings
6% of total
7-29 Nights
50 listings
9.3% of total
30+ Nights
298 listings
55.6% of total
Key Insights
- The most prevalent minimum stay requirement in Seaside Heights is 30+ Nights, adopted by 55.6% of listings. This highlights the market's preference for longer commitments.
- A significant segment (55.6%) caters to monthly stays (30+ nights) in Seaside Heights, pointing to opportunities in the extended-stay market.
Recommendations
- Align with the market by considering a 30+ Nights minimum stay, as 55.6% of Seaside Heights hosts use this setting.
- If feasible, allowing 1-night stays, especially midweek or during low season, could capture last-minute bookings, as only 7.8% currently do.
- Explore offering discounts for stays of 30+ nights to attract the 55.6% of the market seeking extended stays.
- Adjust minimum nights based on seasonality – potentially shorter during low season and longer during peak demand periods in Seaside Heights.
Seaside Heights Airbnb Cancellation Policy Trends Analysis (2026)
Limited
8 listings
1.5% of total
Super Strict 30 Days
33 listings
6.2% of total
Flexible
25 listings
4.7% of total
Moderate
103 listings
19.3% of total
Firm
271 listings
50.7% of total
Strict
95 listings
17.8% of total
Cancellation Policy Insights for Seaside Heights
- The prevailing Airbnb cancellation policy trend in Seaside Heights is Firm, used by 50.7% of listings.
- A majority (68.5%) of hosts in Seaside Heights utilize Firm or Strict policies, indicating a market where hosts prioritize booking security.
Recommendations for Hosts
- Consider adopting a Firm policy to align with the 50.7% market standard in Seaside Heights.
- Regularly review your cancellation policy against competitors and market demand shifts in Seaside Heights.
Seaside Heights STR Booking Lead Time Analysis (2026)
Average Booking Lead Time by Month
Booking Lead Time Insights for Seaside Heights
- The overall average booking lead time for vacation rentals in Seaside Heights is 54 days.
- Guests book furthest in advance for stays during July (average 76 days), likely coinciding with peak travel demand or local events.
- The shortest booking windows occur for stays in January (average 23 days), indicating more last-minute travel plans during this time.
- Seasonally, Summer (68 days avg.) sees the longest lead times, while Winter (31 days avg.) has the shortest, reflecting typical travel planning cycles.
Recommendations for Hosts
- Use the overall average lead time (54 days) as a baseline for your pricing and availability strategy in Seaside Heights.
- For July stays, consider implementing length-of-stay discounts or slightly higher rates for bookings made less than 76 days out to capitalize on advance planning.
- Target marketing efforts for the Summer season well in advance (at least 68 days) to capture early planners.
- Monitor your own booking lead times against these Seaside Heights averages to identify opportunities for dynamic pricing adjustments.
Popular & Essential Airbnb Amenities in Seaside Heights (2026)
Amenity Prevalence
Amenity Insights for Seaside Heights
- Essential amenities in Seaside Heights that guests expect include: Air conditioning, Wifi, Smoke alarm, TV, Carbon monoxide alarm, Kitchen, Fire extinguisher. Lacking these (any) could significantly impact bookings.
- Popular amenities like Heating, Hot water, Dishes and silverware are common but not universal. Offering these can provide a competitive edge.
Recommendations for Hosts
- Ensure your listing includes all essential amenities for Seaside Heights: Air conditioning, Wifi, Smoke alarm, TV, Carbon monoxide alarm, Kitchen, Fire extinguisher.
- Prioritize adding missing essentials: Air conditioning, Wifi, Smoke alarm, TV, Carbon monoxide alarm, Kitchen, Fire extinguisher.
- Consider adding popular differentiators like Heating or Hot water to increase appeal.
- Highlight unique or less common amenities you offer (e.g., hot tub, dedicated workspace, EV charger) in your listing description and photos.
- Regularly check competitor amenities in Seaside Heights to stay competitive.
Seaside Heights Airbnb Guest Demographics & Profile Analysis (2026)
Guest Profile Summary for Seaside Heights
- The typical guest profile for Airbnb in Seaside Heights consists of primarily domestic travelers (97%), often arriving from nearby New York, typically belonging to the Post-2000s (Gen Z/Alpha) group (50%), primarily speaking English or Spanish.
- Domestic travelers account for 96.6% of guests.
- Key international markets include United States (96.6%) and Canada (0.9%).
- Top languages spoken are English (69%) followed by Spanish (15.8%).
- A significant demographic segment is the Post-2000s (Gen Z/Alpha) group, representing 50% of guests.
Recommendations for Hosts
- Target domestic marketing efforts towards travelers from New York and New Jersey.
- Tailor amenities and listing descriptions to appeal to the dominant Post-2000s (Gen Z/Alpha) demographic (e.g., highlight fast WiFi, smart home features, local guides).
- Highlight unique local experiences or amenities relevant to the primary guest profile.
- Consider seasonal promotions aligned with peak travel times for key origin markets.
Nearby Short-Term Rental Market Comparison
How does the Seaside Heights Airbnb market stack up against its neighbors? Compare key performance metrics like average monthly revenue, ADR, and occupancy rates in surrounding areas to understand the broader regional STR landscape.
| Market | Active Properties | Monthly Revenue | Daily Rate | Avg. Occupancy |
|---|---|---|---|---|
| Spring Lake Heights | 16 | $5,785 | $725.20 | 40% |
| Hilltown Township | 11 | $5,557 | $578.96 | 40% |
| Cape May Point | 23 | $5,479 | $542.19 | 46% |
| Stone Harbor | 42 | $5,467 | $785.22 | 39% |
| Neptune City | 12 | $5,299 | $531.14 | 45% |
| Monmouth Beach | 12 | $5,209 | $794.91 | 38% |
| Cape May | 334 | $5,029 | $553.79 | 42% |
| Surf City | 47 | $5,004 | $715.29 | 44% |
| Avalon | 84 | $4,853 | $699.96 | 38% |
| Lambertville | 54 | $4,849 | $359.53 | 50% |