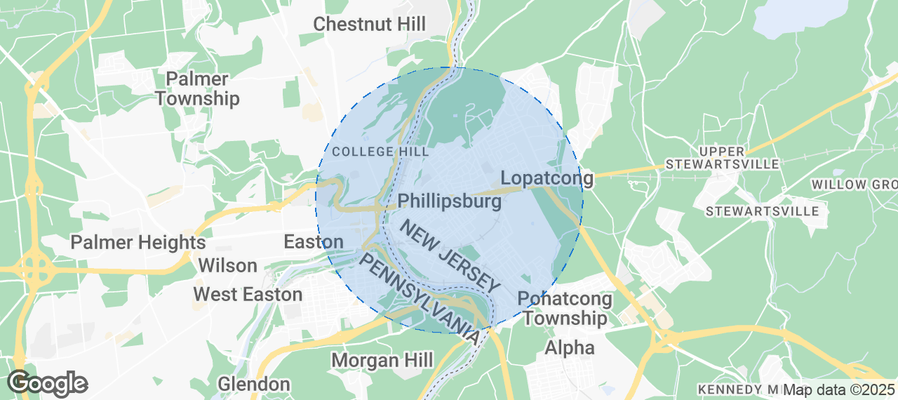
Phillipsburg Airbnb Market Analysis 2025: Short Term Rental Data & Vacation Rental Statistics in New Jersey, United States
Is Airbnb profitable in Phillipsburg in 2025? Explore comprehensive Airbnb analytics for Phillipsburg, New Jersey, United States to uncover income potential. This 2025 STR market report for Phillipsburg, based on AirROI data from September 2024 to August 2025, reveals key trends in the niche market of 18 active listings.
Whether you're considering an Airbnb investment in Phillipsburg, optimizing your existing vacation rental, or exploring rental arbitrage opportunities, understanding the Phillipsburg Airbnb data is crucial. Leveraging the low regulation environment is key to maximizing your short term rental income potential. Let's dive into the specifics.
Key Phillipsburg Airbnb Performance Metrics Overview
Monthly Airbnb Revenue Variations & Income Potential in Phillipsburg (2025)
Understanding the monthly revenue variations for Airbnb listings in Phillipsburg is key to maximizing your short term rental income potential. Seasonality significantly impacts earnings. Our analysis, based on data from the past 12 months, shows that the peak revenue month for STRs in Phillipsburg is typically July, while February often presents the lowest earnings, highlighting opportunities for strategic pricing adjustments during shoulder and low seasons. Explore the typical Airbnb income in Phillipsburg across different performance tiers:
- Best-in-class properties (Top 10%) achieve $2,702+ monthly, often utilizing dynamic pricing and superior guest experiences.
- Strong performing properties (Top 25%) earn $1,681 or more, indicating effective management and desirable locations/amenities.
- Typical properties (Median) generate around $1,218 per month, representing the average market performance.
- Entry-level properties (Bottom 25%) see earnings around $766, often with potential for optimization.
Average Monthly Airbnb Earnings Trend in Phillipsburg
Phillipsburg Airbnb Occupancy Rate Trends (2025)
Maximize your bookings by understanding the Phillipsburg STR occupancy trends. Seasonal demand shifts significantly influence how often properties are booked. Typically, Aprilsees the highest demand (peak season occupancy), while June experiences the lowest (low season). Effective strategies, like adjusting minimum stays or offering promotions, can boost occupancy during slower periods. Here's how different property tiers perform in Phillipsburg:
- Best-in-class properties (Top 10%) achieve 84%+ occupancy, indicating high desirability and potentially optimized availability.
- Strong performing properties (Top 25%) maintain 67% or higher occupancy, suggesting good market fit and guest satisfaction.
- Typical properties (Median) have an occupancy rate around 35%.
- Entry-level properties (Bottom 25%) average 21% occupancy, potentially facing higher vacancy.
Average Monthly Occupancy Rate Trend in Phillipsburg
Average Daily Rate (ADR) Airbnb Trends in Phillipsburg (2025)
Effective short term rental pricing strategy in Phillipsburg involves understanding monthly ADR fluctuations. The Average Daily Rate (ADR) for Airbnb in Phillipsburg typically peaks in January and dips lowest during April. Leveraging Airbnb dynamic pricing tools or strategies based on this seasonality can significantly boost revenue. Here's a look at the typical nightly rates achieved:
- Best-in-class properties (Top 10%) command rates of $470+ per night, often due to premium features or locations.
- Strong performing properties (Top 25%) achieve nightly rates of $248 or more.
- Typical properties (Median) charge around $99 per night.
- Entry-level properties (Bottom 25%) earn around $72 per night.
Average Daily Rate (ADR) Trend by Month in Phillipsburg
Get Live Phillipsburg Market Intelligence 👇
Explore Real-time Analytics
Airbnb Seasonality Analysis & Trends in Phillipsburg (2025)
Peak Season (July, March, May)
- Revenue averages $1,655 per month
- Occupancy rates average 52.9%
- Daily rates average $171
Shoulder Season
- Revenue averages $1,441 per month
- Occupancy maintains around 42.3%
- Daily rates hold near $173
Low Season (January, February, September)
- Revenue drops to average $1,083 per month
- Occupancy decreases to average 40.9%
- Daily rates adjust to average $177
Seasonality Insights for Phillipsburg
- The Airbnb seasonality in Phillipsburg shows moderate seasonality with distinct peak and low periods. While the sections above show seasonal averages, it's also insightful to look at the extremes:
- During the high season, the absolute peak month showcases Phillipsburg's highest earning potential, with monthly revenues capable of climbing to $1,709, occupancy reaching a high of 66.7%, and ADRs peaking at $178.
- Conversely, the slowest single month of the year, typically falling within the low season, marks the market's lowest point. In this month, revenue might dip to $976, occupancy could drop to 26.1%, and ADRs may adjust down to $161.
- Understanding both the seasonal averages and these monthly peaks and troughs in revenue, occupancy, and ADR is crucial for maximizing your Airbnb profit potential in Phillipsburg.
Seasonal Strategies for Maximizing Profit
- Peak Season: Maximize revenue through premium pricing and potentially longer minimum stays. Ensure high availability.
- Low Season: Offer competitive pricing, special promotions (e.g., extended stay discounts), and flexible cancellation policies. Target off-season travelers like remote workers or budget-conscious guests.
- Shoulder Seasons: Implement dynamic pricing that balances peak and low rates. Target weekend travelers or specific events. Offer slightly more flexible terms than peak season.
- Regularly analyze your own performance against these Phillipsburg seasonality benchmarks and adjust your pricing and availability strategy accordingly.
Best Areas for Airbnb Investment in Phillipsburg (2025)
Exploring the top neighborhoods for short-term rentals in Phillipsburg? This section highlights key areas, outlining why they are attractive for hosts and guests, along with notable local attractions. Consider these locations based on your target guest profile and investment strategy.
| Neighborhood / Area | Why Host Here? (Target Guests & Appeal) | Key Attractions & Landmarks |
|---|---|---|
| Downtown Phillipsburg | The heart of Phillipsburg, offering access to restaurants, shopping, and cultural attractions. A bustling area with historic charm and proximity to the Delaware River. | Delaware River, Phillipsburg Railroad Historians, Historic Phillipsburg, Restaurants and shops along Main Street |
| South Main Street | A lively street known for local eateries, vintage shops, and easy access to the riverfront. An attractive spot for visitors wanting to experience local flavor. | Riverfront Park, Boulton Historic Site, Phillipsburg Fire Department Museum |
| Easton Border | Adjacent to Easton, PA, this area attracts those looking to explore both Phillipsburg and nearby Easton, with cultural, dining, and shopping options. | Easton Historic District, National Canal Museum, Easton Farmers' Market |
| Lopatcong Township | A suburban area close to Phillipsburg offering a quieter stay while still being a short drive from attractions, appealing to families and longer-term guests. | Lopatcong Park, Local wineries, Scenic countryside |
| River Road | A scenic road along the Delaware River with beautiful views, ideal for those looking to enjoy outdoor activities such as fishing and kayaking. | Delaware Canal State Park, Scenic river views, Outdoor recreational activities |
| Northampton Street | This area is known for its historic architecture and proximity to the bridge leading into PA, making it a good spot for travelers crossing between states. | Centenary Stage Company, Historic architecture, Local cafes |
| Phillipsburg Carting Company | An up-and-coming area focusing on development and revitalization, ideal for investors looking to attract young professionals and artists. | Local art scene, Newly developed spaces, Community events |
| Union Square | A community-focused area with parks and local markets, great for families and visitors wanting a neighborhood atmosphere with plenty to do. | Union Square Park, Farmers markets, Local dining options |
Understanding Airbnb License Requirements & STR Laws in Phillipsburg (2025)
While Phillipsburg, New Jersey, United States currently shows low STR regulations, specific Airbnb license requirements might still exist or change. Always verify the latest short term rental regulations and Airbnb license requirements directly with local government authorities for Phillipsburg to ensure full compliance before hosting.
(Source: AirROI data, 2025, finding no licensed listings among those analyzed)
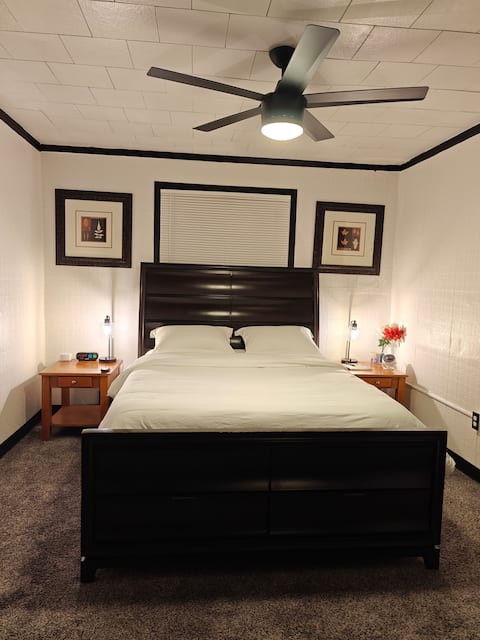
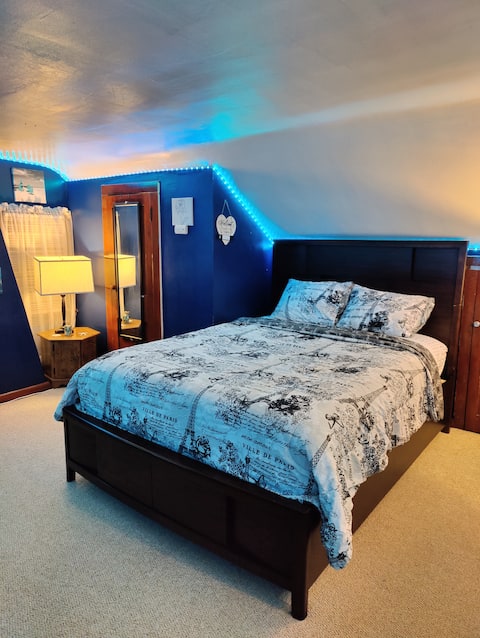
Top Performing Airbnb Properties in Phillipsburg (2025)
Benchmark your potential! Explore examples of top-performing Airbnb properties in Phillipsburgbased on Trailing Twelve Month (TTM) revenue. Analyze their characteristics, revenue, occupancy rate, and ADR to understand what drives success in this market.
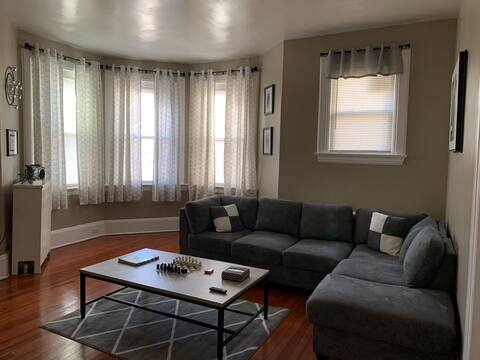
Spacious Victorian Historic Home
Entire Place • 3 bedrooms
Modern Private Suite w/ Self check-in & free wifi
Entire Place • 1 bedroom

Historic Dale Estate overlooking the Delaware
Entire Place • 4 bedrooms
Comfy Attic bedroom in Phillipsburg
Private Room • N/A

Little France - Room #2 (Queen)
Private Room • N/A

Cozy 1 br private Apt self check-in free Wi-Fi
Entire Place • 1 bedroom
Note: Performance varies based on location, size, amenities, seasonality, and management quality. Data reflects the past 12 months.
Top Performing Airbnb Hosts in Phillipsburg (2025)
Learn from the best! This table showcases top-performing Airbnb hosts in Phillipsburg based on the number of properties managed and estimated total revenue over the past year. Analyze their scale and performance metrics.
| Host Name | Properties | Grossing Revenue | Stay Reviews | Avg Rating |
|---|---|---|---|---|
| Shohn | 5 | $48,058 | 116 | 4.98/5.0 |
| Jermal | 2 | $38,100 | 259 | 4.95/5.0 |
| Gina | 1 | $32,938 | 22 | 4.86/5.0 |
| Yan Qing | 2 | $27,759 | 87 | 4.83/5.0 |
| Sophia | 2 | $18,314 | 31 | 4.95/5.0 |
| Host #121530569 | 1 | $11,651 | 57 | 4.61/5.0 |
| Eric | 3 | $8,383 | 11 | 4.90/5.0 |
| Alberto | 1 | $2,884 | 2 | Not Rated |
| Nicole | 1 | $1,293 | 17 | 4.35/5.0 |
Analyzing the strategies of top hosts, such as their property selection, pricing, and guest communication, can offer valuable lessons for optimizing your own Airbnb operations in Phillipsburg.
Dive Deeper: Advanced Phillipsburg STR Market Data (2025)
Ready to unlock more insights? AirROI provides access to advanced metrics and comprehensive Airbnb data for Phillipsburg. Explore detailed analytics beyond this report to refine your investment strategy, optimize pricing, and maximize your vacation rental profits.
Explore Advanced MetricsPhillipsburg Short-Term Rental Market Composition (2025): Property & Room Types
Room Type Distribution
Property Type Distribution
Market Composition Insights for Phillipsburg
- The Phillipsburg Airbnb market composition is heavily skewed towards Entire Home/Apt listings, which make up 66.7% of the 18 active rentals. This indicates strong guest preference for privacy and space.
- However, a notable 33.3% share for Private Rooms suggests opportunities for budget-conscious travelers or hosts renting out spare rooms.
- Looking at the property type distribution in Phillipsburg, House properties are the most common (55.6%), reflecting the local real estate landscape.
- Houses represent a significant 55.6% portion, catering likely to families or larger groups.
Phillipsburg Airbnb Room Capacity Analysis (2025): Bedroom Distribution
Distribution of Listings by Number of Bedrooms
Room Capacity Insights for Phillipsburg
- The dominant room capacity in Phillipsburg is 2 bedrooms listings, making up 38.9% of the market. This suggests a strong demand for properties suitable for couples or solo travelers.
- Together, 2 bedrooms and 1 bedroom properties represent 61.1% of the active Airbnb listings in Phillipsburg, indicating a high concentration in these sizes.
Phillipsburg Vacation Rental Guest Capacity Trends (2025)
Distribution of Listings by Guest Capacity
Guest Capacity Insights for Phillipsburg
- The most common guest capacity trend in Phillipsburg vacation rentals is listings accommodating 4 guests (22.2%). This suggests the primary traveler segment is likely small families or groups.
- Properties designed for 4 guests and 2 guests dominate the Phillipsburg STR market, accounting for 38.9% of listings.
- 16.7% of properties accommodate 6+ guests, serving the market segment for larger families or group travel in Phillipsburg.
- On average, properties in Phillipsburg are equipped to host 3.1 guests.
Phillipsburg Airbnb Booking Patterns (2025): Available vs. Booked Days
Available Days Distribution
Booked Days Distribution
Booking Pattern Insights for Phillipsburg
- The most common availability pattern in Phillipsburg falls within the 271-366 days range, representing 61.1% of listings. This suggests many properties have significant open periods on their calendars.
- Approximately 72.2% of listings show high availability (181+ days open annually), indicating potential for increased bookings or specific owner usage patterns.
- For booked days, the 1-30 days range is most frequent in Phillipsburg (38.9%), reflecting common guest stay durations or potential owner blocking patterns.
- A notable 27.8% of properties secure long booking periods (181+ days booked per year), highlighting successful long-term rental strategies or significant owner usage.
Phillipsburg Airbnb Minimum Stay Requirements Analysis
Distribution of Listings by Minimum Night Requirement
1 Night
11 listings
61.1% of total
3 Nights
1 listings
5.6% of total
4-6 Nights
3 listings
16.7% of total
7-29 Nights
2 listings
11.1% of total
30+ Nights
1 listings
5.6% of total
Key Insights
- The most prevalent minimum stay requirement in Phillipsburg is 1 Night, adopted by 61.1% of listings. This highlights the market's preference for shorter, flexible bookings.
- A strong majority (61.1%) of the Phillipsburg Airbnb data shows acceptance of very short stays (1-2 nights), indicating a dynamic, high-turnover market.
Recommendations
- Align with the market by considering a 1 Night minimum stay, as 61.1% of Phillipsburg hosts use this setting.
- Explore offering discounts for stays of 30+ nights to attract the 5.6% of the market seeking extended stays.
- Adjust minimum nights based on seasonality – potentially shorter during low season and longer during peak demand periods in Phillipsburg.
Phillipsburg Airbnb Cancellation Policy Trends Analysis (2025)
Flexible
6 listings
33.3% of total
Moderate
4 listings
22.2% of total
Firm
4 listings
22.2% of total
Strict
4 listings
22.2% of total
Cancellation Policy Insights for Phillipsburg
- The prevailing Airbnb cancellation policy trend in Phillipsburg is Flexible, used by 33.3% of listings.
- There's a relatively balanced mix between guest-friendly (55.5%) and stricter (44.4%) policies, offering choices for different guest needs.
Recommendations for Hosts
- Consider adopting a Flexible policy to align with the 33.3% market standard in Phillipsburg.
- Regularly review your cancellation policy against competitors and market demand shifts in Phillipsburg.
Phillipsburg STR Booking Lead Time Analysis (2025)
Average Booking Lead Time by Month
Booking Lead Time Insights for Phillipsburg
- The overall average booking lead time for vacation rentals in Phillipsburg is 23 days.
- Guests book furthest in advance for stays during May (average 63 days), likely coinciding with peak travel demand or local events.
- The shortest booking windows occur for stays in January (average 7 days), indicating more last-minute travel plans during this time.
- Seasonally, Spring (28 days avg.) sees the longest lead times, while Winter (11 days avg.) has the shortest, reflecting typical travel planning cycles.
Recommendations for Hosts
- Use the overall average lead time (23 days) as a baseline for your pricing and availability strategy in Phillipsburg.
- For May stays, consider implementing length-of-stay discounts or slightly higher rates for bookings made less than 63 days out to capitalize on advance planning.
- During January, focus on last-minute booking availability and promotions, as guests book with very short notice (7 days avg.).
- Target marketing efforts for the Spring season well in advance (at least 28 days) to capture early planners.
- Monitor your own booking lead times against these Phillipsburg averages to identify opportunities for dynamic pricing adjustments.
Popular & Essential Airbnb Amenities in Phillipsburg (2025)
Amenity Prevalence
Amenity Insights for Phillipsburg
- Essential amenities in Phillipsburg that guests expect include: Carbon monoxide alarm, Wifi, Air conditioning, TV, Smoke alarm. Lacking these (any) could significantly impact bookings.
- Popular amenities like Fire extinguisher, Heating, Refrigerator are common but not universal. Offering these can provide a competitive edge.
Recommendations for Hosts
- Ensure your listing includes all essential amenities for Phillipsburg: Carbon monoxide alarm, Wifi, Air conditioning, TV, Smoke alarm.
- Consider adding popular differentiators like Fire extinguisher or Heating to increase appeal.
- Highlight unique or less common amenities you offer (e.g., hot tub, dedicated workspace, EV charger) in your listing description and photos.
- Regularly check competitor amenities in Phillipsburg to stay competitive.
Phillipsburg Airbnb Guest Demographics & Profile Analysis (2025)
Guest Profile Summary for Phillipsburg
- The typical guest profile for Airbnb in Phillipsburg consists of primarily domestic travelers (95%), often arriving from nearby New York, typically belonging to the Post-2000s (Gen Z/Alpha) group (50%), primarily speaking English or Spanish.
- Domestic travelers account for 94.6% of guests.
- Key international markets include United States (94.6%) and Australia (2.2%).
- Top languages spoken are English (62.5%) followed by Spanish (15.3%).
- A significant demographic segment is the Post-2000s (Gen Z/Alpha) group, representing 50% of guests.
Recommendations for Hosts
- Target domestic marketing efforts towards travelers from New York and Philadelphia.
- Tailor amenities and listing descriptions to appeal to the dominant Post-2000s (Gen Z/Alpha) demographic (e.g., highlight fast WiFi, smart home features, local guides).
- Highlight unique local experiences or amenities relevant to the primary guest profile.
- Consider seasonal promotions aligned with peak travel times for key origin markets.
Nearby Short-Term Rental Market Comparison
How does the Phillipsburg Airbnb market stack up against its neighbors? Compare key performance metrics like average monthly revenue, ADR, and occupancy rates in surrounding areas to understand the broader regional STR landscape.
| Market | Active Properties | Monthly Revenue | Daily Rate | Avg. Occupancy |
|---|---|---|---|---|
| Freeland | 11 | $8,117 | $693.03 | 38% |
| Berlin Township | 16 | $7,496 | $684.68 | 33% |
| Polk Township | 15 | $6,512 | $496.02 | 40% |
| Centreville | 16 | $5,945 | $566.72 | 44% |
| Frankford Township | 12 | $5,609 | $556.39 | 43% |
| Foster Township | 21 | $5,593 | $502.82 | 38% |
| Town of Kingston | 13 | $5,277 | $444.51 | 46% |
| Stroud Township | 149 | $5,253 | $459.16 | 41% |
| Penn Estates | 55 | $5,109 | $402.21 | 45% |
| Knowlton Township | 13 | $5,036 | $352.41 | 47% |