North Wildwood Airbnb Market Analysis 2026: Short Term Rental Data & Vacation Rental Statistics in New Jersey, United States
Is Airbnb profitable in North Wildwood in 2026? Explore comprehensive Airbnb analytics for North Wildwood, New Jersey, United States to uncover income potential. This 2026 STR market report for North Wildwood, based on AirROI data from February 2025 to January 2026, reveals key trends in the market of 432 active listings.
Whether you're considering an Airbnb investment in North Wildwood, optimizing your existing vacation rental, or exploring rental arbitrage opportunities, understanding the North Wildwood Airbnb data is crucial. Leveraging the low regulation environment is key to maximizing your short term rental income potential. Let's dive into the specifics.
Key North Wildwood Airbnb Performance Metrics Overview
Monthly Airbnb Revenue Variations & Income Potential in North Wildwood (2026)
Understanding the monthly revenue variations for Airbnb listings in North Wildwood is key to maximizing your short term rental income potential. Seasonality significantly impacts earnings. Our analysis, based on data from the past 12 months, shows that the peak revenue month for STRs in North Wildwood is typically July, while February often presents the lowest earnings, highlighting opportunities for strategic pricing adjustments during shoulder and low seasons. Explore the typical Airbnb income in North Wildwood across different performance tiers:
- Best-in-class properties (Top 10%) achieve $6,832+ monthly, often utilizing dynamic pricing and superior guest experiences.
- Strong performing properties (Top 25%) earn $4,130 or more, indicating effective management and desirable locations/amenities.
- Typical properties (Median) generate around $2,477 per month, representing the average market performance.
- Entry-level properties (Bottom 25%) see earnings around $1,503, often with potential for optimization.
Average Monthly Airbnb Earnings Trend in North Wildwood
North Wildwood Airbnb Occupancy Rate Trends (2026)
Maximize your bookings by understanding the North Wildwood STR occupancy trends. Seasonal demand shifts significantly influence how often properties are booked. Typically, Julysees the highest demand (peak season occupancy), while February experiences the lowest (low season). Effective strategies, like adjusting minimum stays or offering promotions, can boost occupancy during slower periods. Here's how different property tiers perform in North Wildwood:
- Best-in-class properties (Top 10%) achieve 61%+ occupancy, indicating high desirability and potentially optimized availability.
- Strong performing properties (Top 25%) maintain 42% or higher occupancy, suggesting good market fit and guest satisfaction.
- Typical properties (Median) have an occupancy rate around 27%.
- Entry-level properties (Bottom 25%) average 16% occupancy, potentially facing higher vacancy.
Average Monthly Occupancy Rate Trend in North Wildwood
Average Daily Rate (ADR) Airbnb Trends in North Wildwood (2026)
Effective short term rental pricing strategy in North Wildwood involves understanding monthly ADR fluctuations. The Average Daily Rate (ADR) for Airbnb in North Wildwood typically peaks in July and dips lowest during March. Leveraging Airbnb dynamic pricing tools or strategies based on this seasonality can significantly boost revenue. Here's a look at the typical nightly rates achieved:
- Best-in-class properties (Top 10%) command rates of $593+ per night, often due to premium features or locations.
- Strong performing properties (Top 25%) achieve nightly rates of $417 or more.
- Typical properties (Median) charge around $307 per night.
- Entry-level properties (Bottom 25%) earn around $226 per night.
Average Daily Rate (ADR) Trend by Month in North Wildwood
Get Live North Wildwood Market Intelligence 👇

Explore Real-time Analytics
Airbnb Seasonality Analysis & Trends in North Wildwood (2026)
Peak Season (July, August, June)
- Revenue averages $7,176 per month
- Occupancy rates average 56.8%
- Daily rates average $380
Shoulder Season
- Revenue averages $2,317 per month
- Occupancy maintains around 23.5%
- Daily rates hold near $351
Low Season (February, March, November)
- Revenue drops to average $1,437 per month
- Occupancy decreases to average 18.7%
- Daily rates adjust to average $340
Seasonality Insights for North Wildwood
- The Airbnb seasonality in North Wildwood shows highly seasonal trends requiring careful strategy. While the sections above show seasonal averages, it's also insightful to look at the extremes:
- During the high season, the absolute peak month showcases North Wildwood's highest earning potential, with monthly revenues capable of climbing to $8,437, occupancy reaching a high of 63.0%, and ADRs peaking at $383.
- Conversely, the slowest single month of the year, typically falling within the low season, marks the market's lowest point. In this month, revenue might dip to $1,023, occupancy could drop to 16.3%, and ADRs may adjust down to $333.
- Understanding both the seasonal averages and these monthly peaks and troughs in revenue, occupancy, and ADR is crucial for maximizing your Airbnb profit potential in North Wildwood.
Seasonal Strategies for Maximizing Profit
- Peak Season: Maximize revenue through premium pricing and potentially longer minimum stays. Ensure high availability.
- Low Season: Offer competitive pricing, special promotions (e.g., extended stay discounts), and flexible cancellation policies. Target off-season travelers like remote workers or budget-conscious guests.
- Shoulder Seasons: Implement dynamic pricing that balances peak and low rates. Target weekend travelers or specific events. Offer slightly more flexible terms than peak season.
- Regularly analyze your own performance against these North Wildwood seasonality benchmarks and adjust your pricing and availability strategy accordingly.
Best Areas for Airbnb Investment in North Wildwood (2026)
Exploring the top neighborhoods for short-term rentals in North Wildwood? This section highlights key areas, outlining why they are attractive for hosts and guests, along with notable local attractions. Consider these locations based on your target guest profile and investment strategy.
| Neighborhood / Area | Why Host Here? (Target Guests & Appeal) | Key Attractions & Landmarks |
|---|---|---|
| North Wildwood Beach | A popular beach destination known for its beautiful sandy shores and family-friendly atmosphere. Attracts tourists looking for a classic Jersey Shore beach experience with various activities for all ages. | Jersey Shore, Morey's Piers, North Wildwood Historical Society, Wildwood Boardwalk, Anglesea Beer Garden |
| Seaside Heights | Famous for its boardwalk and vibrant nightlife, ideal for younger travelers seeking entertainment and beach activities. A hotspot for summer vacationers looking for fun and excitement. | Seaside Heights Boardwalk, Jenkinson's Aquarium, fishing and water sports, nightclubs and bars, amusement parks |
| Cape May | Known for its Victorian architecture and historic charm, Cape May attracts visitors seeking a more upscale, quieter beach experience with fine dining and boutique shopping. | Washington Street Mall, Cape May Lighthouse, Emlen Physick Estate, Victorian House Tours, Cape May Beach |
| Wildwood Crest | A quieter alternative to its neighboring Wildwood, perfect for families with children. Offers a laid-back beach atmosphere with ample amenities and recreational activities. | Wildwood Crest Beach, Sunset Lake, Crest Pier, free beach events, biking paths |
| Avalon | Desirable for its upscale beach homes and family-oriented vibe. Ideal for guests looking to relax in a more tranquil environment away from the bustling boardwalks. | Avalon Beach, Avalon History Center, Bird Sanctuary, Water Sports, Family friendly events |
| Stone Harbor | A picturesque beach town that offers a quaint shopping district and beautiful beaches. Popular among families and couples looking for a romantic getaway. | Stone Harbor Beach, Shopping district, Wetlands Institute, Nature trails, Bird watching |
| Ocean City | Family-friendly with a charming boardwalk and numerous attractions. Offers a mix of fun and relaxation, making it a popular choice for vacationers of all ages. | Ocean City Boardwalk, Playland's Castaway Cove, Ocean City Beach, mini-golf courses, Water sports |
| Wildwood | Known for its exciting boardwalk and amusement parks, Wildwood attracts thrill-seekers and families looking for a vibrant summer getaway full of activities. | Morey's Piers, Wildwood Boardwalk, Splash Zone Waterpark, Wilderness Lodge, Beachfront events |
Understanding Airbnb License Requirements & STR Laws in North Wildwood (2026)
While North Wildwood, New Jersey, United States currently shows low STR regulations, specific Airbnb license requirements might still exist or change. Always verify the latest short term rental regulations and Airbnb license requirements directly with local government authorities for North Wildwood to ensure full compliance before hosting.
(Source: AirROI data, 2026, finding no licensed listings among those analyzed)
Top Performing Airbnb Properties in North Wildwood (2026)
Benchmark your potential! Explore examples of top-performing Airbnb properties in North Wildwoodbased on Trailing Twelve Month (TTM) revenue. Analyze their characteristics, revenue, occupancy rate, and ADR to understand what drives success in this market.
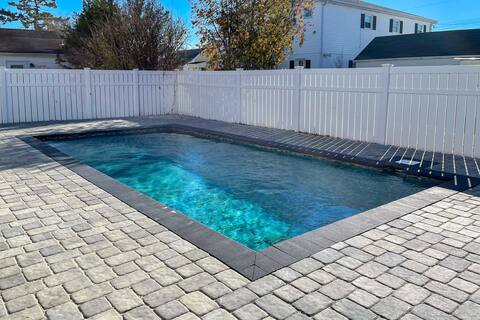
New-Build North Wildwood Home w/ Private Pool
Entire Place • 5 bedrooms
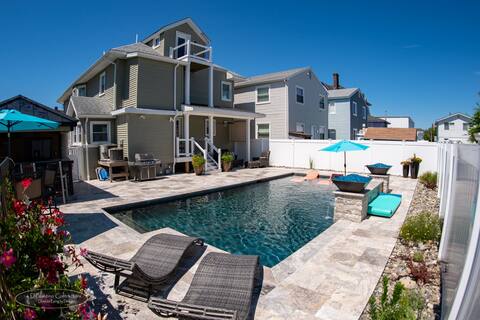
North Wildwood Sea Unicorn-6B w private pool oasis
Entire Place • 6 bedrooms

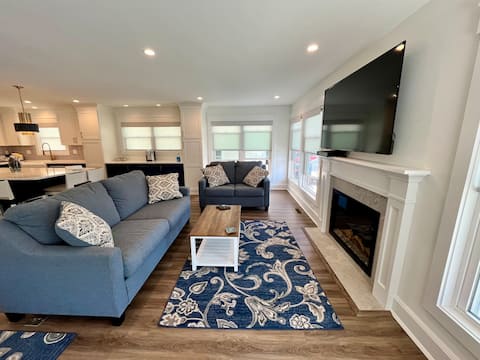
5br Home in N. Wildwood w/ Pool
Entire Place • 5 bedrooms
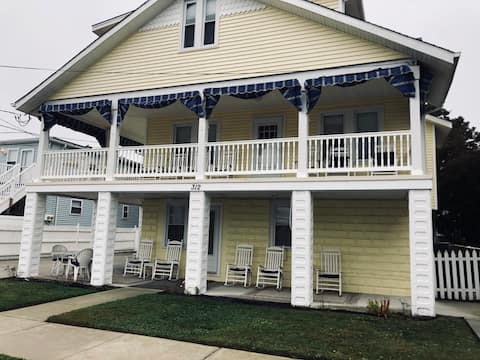
Spacious Family Friendly Home
Entire Place • 6 bedrooms

Beachfront condominium with a view
Entire Place • 4 bedrooms
Inlet Beach View
Entire Place • 4 bedrooms
Note: Performance varies based on location, size, amenities, seasonality, and management quality. Data reflects the past 12 months.
Top Performing Airbnb Hosts in North Wildwood (2026)
Learn from the best! This table showcases top-performing Airbnb hosts in North Wildwood based on the number of properties managed and estimated total revenue over the past year. Analyze their scale and performance metrics.
| Host Name | Properties | Grossing Revenue | Stay Reviews | Avg Rating |
|---|---|---|---|---|
| Experience Vacation Rentals | 51 | $1,204,750 | 178 | 4.47/5.0 |
| Don Martin Vacation Rentals | 35 | $874,877 | 208 | 4.64/5.0 |
| Evolve | 20 | $707,476 | 274 | 4.75/5.0 |
| Kevin | 11 | $450,055 | 225 | 4.95/5.0 |
| Alfred | 2 | $183,657 | 46 | 4.98/5.0 |
| Denise | 5 | $176,940 | 54 | 4.96/5.0 |
| Zijadin | 3 | $136,709 | 148 | 4.90/5.0 |
| Lisa | 3 | $129,551 | 42 | 5.00/5.0 |
| Steacy | 1 | $129,274 | 3 | 5.00/5.0 |
| Carideon | 10 | $125,916 | 40 | 4.32/5.0 |
Analyzing the strategies of top hosts, such as their property selection, pricing, and guest communication, can offer valuable lessons for optimizing your own Airbnb operations in North Wildwood.
Dive Deeper: Advanced North Wildwood STR Market Data (2026)
Ready to unlock more insights? AirROI provides access to advanced metrics and comprehensive Airbnb data for North Wildwood. Explore detailed analytics beyond this report to refine your investment strategy, optimize pricing, and maximize your vacation rental profits.
Explore Advanced MetricsNorth Wildwood Short-Term Rental Market Composition (2026): Property & Room Types
Room Type Distribution
Property Type Distribution
Market Composition Insights for North Wildwood
- The North Wildwood Airbnb market composition is heavily skewed towards Entire Home/Apt listings, which make up 95.8% of the 432 active rentals. This indicates strong guest preference for privacy and space.
- Looking at the property type distribution in North Wildwood, Apartment/Condo properties are the most common (66.7%), reflecting the local real estate landscape.
- Houses represent a significant 27.8% portion, catering likely to families or larger groups.
- Smaller segments like hotel/boutique, others (combined 5.6%) offer potential for unique stay experiences.
North Wildwood Airbnb Room Capacity Analysis (2026): Bedroom Distribution
Distribution of Listings by Number of Bedrooms
Room Capacity Insights for North Wildwood
- The dominant room capacity in North Wildwood is 2 bedrooms listings, making up 31.3% of the market. This suggests a strong demand for properties suitable for couples or solo travelers.
- Together, 2 bedrooms and 1 bedroom properties represent 59.5% of the active Airbnb listings in North Wildwood, indicating a high concentration in these sizes.
- A significant 36.5% of listings offer 3+ bedrooms, catering to larger groups and families seeking more space in North Wildwood.
North Wildwood Vacation Rental Guest Capacity Trends (2026)
Distribution of Listings by Guest Capacity
Guest Capacity Insights for North Wildwood
- The most common guest capacity trend in North Wildwood vacation rentals is listings accommodating 8+ guests (34.7%). This suggests the primary traveler segment is likely larger groups.
- Properties designed for 8+ guests and 6 guests dominate the North Wildwood STR market, accounting for 66.2% of listings.
- 73.4% of properties accommodate 6+ guests, serving the market segment for larger families or group travel in North Wildwood.
- On average, properties in North Wildwood are equipped to host 6.2 guests.
North Wildwood Airbnb Booking Patterns (2026): Available vs. Booked Days
Available Days Distribution
Booked Days Distribution
Booking Pattern Insights for North Wildwood
- The most common availability pattern in North Wildwood falls within the 271-366 days range, representing 75% of listings. This suggests many properties have significant open periods on their calendars.
- Approximately 98.6% of listings show high availability (181+ days open annually), indicating potential for increased bookings or specific owner usage patterns.
- For booked days, the 31-90 days range is most frequent in North Wildwood (53%), reflecting common guest stay durations or potential owner blocking patterns.
- A notable 1.6% of properties secure long booking periods (181+ days booked per year), highlighting successful long-term rental strategies or significant owner usage.
North Wildwood Airbnb Minimum Stay Requirements Analysis
Distribution of Listings by Minimum Night Requirement
1 Night
23 listings
5.3% of total
2 Nights
52 listings
12% of total
3 Nights
44 listings
10.2% of total
4-6 Nights
52 listings
12% of total
7-29 Nights
28 listings
6.5% of total
30+ Nights
233 listings
53.9% of total
Key Insights
- The most prevalent minimum stay requirement in North Wildwood is 30+ Nights, adopted by 53.9% of listings. This highlights the market's preference for longer commitments.
- Very short stays (1-2 nights) are less common (17.3%), suggesting hosts prefer slightly longer bookings to optimize turnover.
- A significant segment (53.9%) caters to monthly stays (30+ nights) in North Wildwood, pointing to opportunities in the extended-stay market.
Recommendations
- Align with the market by considering a 30+ Nights minimum stay, as 53.9% of North Wildwood hosts use this setting.
- If feasible, allowing 1-night stays, especially midweek or during low season, could capture last-minute bookings, as only 5.3% currently do.
- Explore offering discounts for stays of 30+ nights to attract the 53.9% of the market seeking extended stays.
- Adjust minimum nights based on seasonality – potentially shorter during low season and longer during peak demand periods in North Wildwood.
North Wildwood Airbnb Cancellation Policy Trends Analysis (2026)
Super Strict 60 Days
56 listings
13% of total
Super Strict 30 Days
7 listings
1.6% of total
Flexible
22 listings
5.1% of total
Moderate
30 listings
6.9% of total
Firm
191 listings
44.2% of total
Strict
126 listings
29.2% of total
Cancellation Policy Insights for North Wildwood
- The prevailing Airbnb cancellation policy trend in North Wildwood is Firm, used by 44.2% of listings.
- A majority (73.4%) of hosts in North Wildwood utilize Firm or Strict policies, indicating a market where hosts prioritize booking security.
Recommendations for Hosts
- Consider adopting a Firm policy to align with the 44.2% market standard in North Wildwood.
- Regularly review your cancellation policy against competitors and market demand shifts in North Wildwood.
North Wildwood STR Booking Lead Time Analysis (2026)
Average Booking Lead Time by Month
Booking Lead Time Insights for North Wildwood
- The overall average booking lead time for vacation rentals in North Wildwood is 78 days.
- Guests book furthest in advance for stays during June (average 103 days), likely coinciding with peak travel demand or local events.
- The shortest booking windows occur for stays in January (average 22 days), indicating more last-minute travel plans during this time.
- Seasonally, Summer (95 days avg.) sees the longest lead times, while Winter (25 days avg.) has the shortest, reflecting typical travel planning cycles.
Recommendations for Hosts
- Use the overall average lead time (78 days) as a baseline for your pricing and availability strategy in North Wildwood.
- For June stays, consider implementing length-of-stay discounts or slightly higher rates for bookings made less than 103 days out to capitalize on advance planning.
- Target marketing efforts for the Summer season well in advance (at least 95 days) to capture early planners.
- Monitor your own booking lead times against these North Wildwood averages to identify opportunities for dynamic pricing adjustments.
Popular & Essential Airbnb Amenities in North Wildwood (2026)
Amenity Prevalence
Amenity Insights for North Wildwood
- Essential amenities in North Wildwood that guests expect include: Air conditioning, TV, Smoke alarm, Wifi. Lacking these (any) could significantly impact bookings.
- Popular amenities like Fire extinguisher, Kitchen, Carbon monoxide alarm are common but not universal. Offering these can provide a competitive edge.
Recommendations for Hosts
- Ensure your listing includes all essential amenities for North Wildwood: Air conditioning, TV, Smoke alarm, Wifi.
- Prioritize adding missing essentials: Air conditioning, TV, Smoke alarm, Wifi.
- Consider adding popular differentiators like Fire extinguisher or Kitchen to increase appeal.
- Highlight unique or less common amenities you offer (e.g., hot tub, dedicated workspace, EV charger) in your listing description and photos.
- Regularly check competitor amenities in North Wildwood to stay competitive.
North Wildwood Airbnb Guest Demographics & Profile Analysis (2026)
Guest Profile Summary for North Wildwood
- The typical guest profile for Airbnb in North Wildwood consists of primarily domestic travelers (98%), often arriving from nearby Philadelphia, typically belonging to the Post-2000s (Gen Z/Alpha) group (50%), primarily speaking English or Spanish.
- Domestic travelers account for 97.7% of guests.
- Key international markets include United States (97.7%) and Canada (1.1%).
- Top languages spoken are English (78.8%) followed by Spanish (9.9%).
- A significant demographic segment is the Post-2000s (Gen Z/Alpha) group, representing 50% of guests.
Recommendations for Hosts
- Target domestic marketing efforts towards travelers from Philadelphia and New York.
- Tailor amenities and listing descriptions to appeal to the dominant Post-2000s (Gen Z/Alpha) demographic (e.g., highlight fast WiFi, smart home features, local guides).
- Highlight unique local experiences or amenities relevant to the primary guest profile.
- Consider seasonal promotions aligned with peak travel times for key origin markets.
Nearby Short-Term Rental Market Comparison
How does the North Wildwood Airbnb market stack up against its neighbors? Compare key performance metrics like average monthly revenue, ADR, and occupancy rates in surrounding areas to understand the broader regional STR landscape.
| Market | Active Properties | Monthly Revenue | Daily Rate | Avg. Occupancy |
|---|---|---|---|---|
| Cape May Point | 23 | $5,479 | $542.19 | 46% |
| Stone Harbor | 42 | $5,467 | $785.22 | 39% |
| Cape May | 334 | $5,029 | $553.79 | 42% |
| Surf City | 47 | $5,004 | $715.29 | 44% |
| Avalon | 84 | $4,853 | $699.96 | 38% |
| Ship Bottom | 64 | $4,794 | $534.91 | 41% |
| Long Beach Township | 163 | $4,763 | $777.82 | 37% |
| West Cape May | 100 | $4,700 | $480.79 | 46% |
| Harvey Cedars | 25 | $4,567 | $915.05 | 27% |
| Barnegat Light | 20 | $4,499 | $613.05 | 43% |