Linden Airbnb Market Analysis 2026: Short Term Rental Data & Vacation Rental Statistics in New Jersey, United States
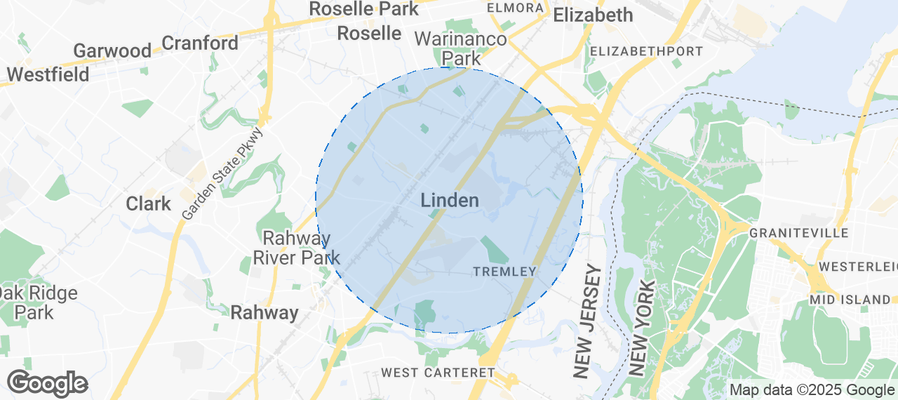
Is Airbnb profitable in Linden in 2026? Explore comprehensive Airbnb analytics for Linden, New Jersey, United States to uncover income potential. This 2026 STR market report for Linden, based on AirROI data from February 2025 to January 2026, reveals key trends in the niche market of 62 active listings.
Whether you're considering an Airbnb investment in Linden, optimizing your existing vacation rental, or exploring rental arbitrage opportunities, understanding the Linden Airbnb data is crucial. Leveraging the low regulation environment is key to maximizing your short term rental income potential. Let's dive into the specifics.
Key Linden Airbnb Performance Metrics Overview
Monthly Airbnb Revenue Variations & Income Potential in Linden (2026)
Understanding the monthly revenue variations for Airbnb listings in Linden is key to maximizing your short term rental income potential. Seasonality significantly impacts earnings. Our analysis, based on data from the past 12 months, shows that the peak revenue month for STRs in Linden is typically December, while February often presents the lowest earnings, highlighting opportunities for strategic pricing adjustments during shoulder and low seasons. Explore the typical Airbnb income in Linden across different performance tiers:
- Best-in-class properties (Top 10%) achieve $4,356+ monthly, often utilizing dynamic pricing and superior guest experiences.
- Strong performing properties (Top 25%) earn $2,990 or more, indicating effective management and desirable locations/amenities.
- Typical properties (Median) generate around $1,358 per month, representing the average market performance.
- Entry-level properties (Bottom 25%) see earnings around $613, often with potential for optimization.
Average Monthly Airbnb Earnings Trend in Linden
Linden Airbnb Occupancy Rate Trends (2026)
Maximize your bookings by understanding the Linden STR occupancy trends. Seasonal demand shifts significantly influence how often properties are booked. Typically, Decembersees the highest demand (peak season occupancy), while January experiences the lowest (low season). Effective strategies, like adjusting minimum stays or offering promotions, can boost occupancy during slower periods. Here's how different property tiers perform in Linden:
- Best-in-class properties (Top 10%) achieve 85%+ occupancy, indicating high desirability and potentially optimized availability.
- Strong performing properties (Top 25%) maintain 69% or higher occupancy, suggesting good market fit and guest satisfaction.
- Typical properties (Median) have an occupancy rate around 44%.
- Entry-level properties (Bottom 25%) average 20% occupancy, potentially facing higher vacancy.
Average Monthly Occupancy Rate Trend in Linden
Average Daily Rate (ADR) Airbnb Trends in Linden (2026)
Effective short term rental pricing strategy in Linden involves understanding monthly ADR fluctuations. The Average Daily Rate (ADR) for Airbnb in Linden typically peaks in December and dips lowest during February. Leveraging Airbnb dynamic pricing tools or strategies based on this seasonality can significantly boost revenue. Here's a look at the typical nightly rates achieved:
- Best-in-class properties (Top 10%) command rates of $228+ per night, often due to premium features or locations.
- Strong performing properties (Top 25%) achieve nightly rates of $148 or more.
- Typical properties (Median) charge around $66 per night.
- Entry-level properties (Bottom 25%) earn around $34 per night.
Average Daily Rate (ADR) Trend by Month in Linden
Get Live Linden Market Intelligence 👇
Explore Real-time Analytics
Airbnb Seasonality Analysis & Trends in Linden (2026)
Peak Season (December, October, November)
- Revenue averages $3,234 per month
- Occupancy rates average 51.6%
- Daily rates average $124
Shoulder Season
- Revenue averages $2,234 per month
- Occupancy maintains around 43.8%
- Daily rates hold near $111
Low Season (February, March, April)
- Revenue drops to average $1,296 per month
- Occupancy decreases to average 45.5%
- Daily rates adjust to average $103
Seasonality Insights for Linden
- The Airbnb seasonality in Linden shows highly seasonal trends requiring careful strategy. While the sections above show seasonal averages, it's also insightful to look at the extremes:
- During the high season, the absolute peak month showcases Linden's highest earning potential, with monthly revenues capable of climbing to $4,057, occupancy reaching a high of 55.5%, and ADRs peaking at $132.
- Conversely, the slowest single month of the year, typically falling within the low season, marks the market's lowest point. In this month, revenue might dip to $1,175, occupancy could drop to 36.4%, and ADRs may adjust down to $102.
- Understanding both the seasonal averages and these monthly peaks and troughs in revenue, occupancy, and ADR is crucial for maximizing your Airbnb profit potential in Linden.
Seasonal Strategies for Maximizing Profit
- Peak Season: Maximize revenue through premium pricing and potentially longer minimum stays. Ensure high availability.
- Low Season: Offer competitive pricing, special promotions (e.g., extended stay discounts), and flexible cancellation policies. Target off-season travelers like remote workers or budget-conscious guests.
- Shoulder Seasons: Implement dynamic pricing that balances peak and low rates. Target weekend travelers or specific events. Offer slightly more flexible terms than peak season.
- Regularly analyze your own performance against these Linden seasonality benchmarks and adjust your pricing and availability strategy accordingly.
Best Areas for Airbnb Investment in Linden (2026)
Exploring the top neighborhoods for short-term rentals in Linden? This section highlights key areas, outlining why they are attractive for hosts and guests, along with notable local attractions. Consider these locations based on your target guest profile and investment strategy.
| Neighborhood / Area | Why Host Here? (Target Guests & Appeal) | Key Attractions & Landmarks |
|---|---|---|
| Downtown Linden | A vibrant area with easy access to public transportation, shopping, and dining, making it popular with visitors looking for convenience and amenities. | Linden Historical Society, John Marsh Park, Linden Library, Linden Plaza, Culver Park |
| Linden Train Station Area | Close proximity to the NJ Transit train station, attracting commuters and travelers who need quick access to New York City and nearby areas. | Linden Train Station, Plaza Restaurant, Crown Fried Chicken, QuickChek Convenience Store, Mason Park |
| Roselle Park | Adjacent to Linden, this area offers a suburban feel with parks and local eateries, appealing to families and long-term guests. | Roselle Park Recreation Center, Warinanco Park, Roselle Park Historical Society, Local diners and cafes |
| Cranford | A picturesque town known for its charming shops and restaurants, offering a peaceful retreat for guests looking for local culture. | Cranford Canoe Club, Nomahegan Park, Cranford Theatre, Downtown Cranford Shopping District |
| Bayway | An industrial area that attracts workers during the week, offering affordable housing close to employment opportunities, making it ideal for long-term stays. | Bayway Refinery, Local bars and eateries, Recreation sites nearby |
| Elizabeth Avenue | A busy commercial corridor with diverse dining options and shops, attracting both tourists and locals alike all year round. | Elizabeth Shopping Center, Local food markets, Parks and recreational areas |
| Linden Park | Home to several local parks, this area is perfect for families and those looking for outdoor activities near Linden. | Linden Park, Recreation fields, Playgrounds, Family-friendly eateries |
| South Linden | A quieter community with a strong local culture and access to nearby amenities, appealing to those seeking a local living experience. | Local parks, Community events, Cafes and small businesses |
Understanding Airbnb License Requirements & STR Laws in Linden (2026)
While Linden, New Jersey, United States currently shows low STR regulations, specific Airbnb license requirements might still exist or change. Always verify the latest short term rental regulations and Airbnb license requirements directly with local government authorities for Linden to ensure full compliance before hosting.
(Source: AirROI data, 2026, based on 2% licensed listings)
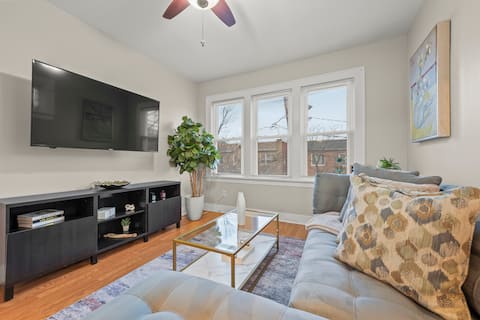
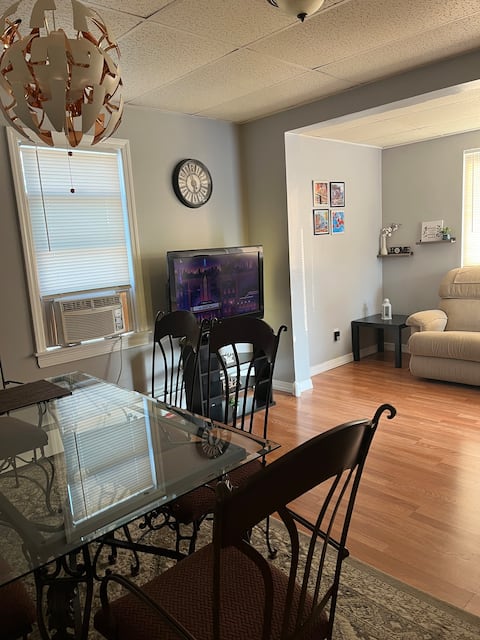
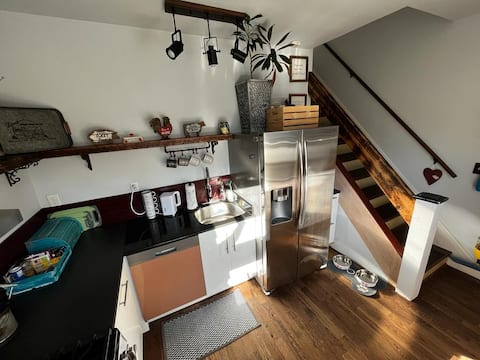
Top Performing Airbnb Properties in Linden (2026)
Benchmark your potential! Explore examples of top-performing Airbnb properties in Lindenbased on Trailing Twelve Month (TTM) revenue. Analyze their characteristics, revenue, occupancy rate, and ADR to understand what drives success in this market.

Fire & Fun | Luxe Stay w Pool, Hot Tub & Game Room
Entire Place • 7 bedrooms
2-Story Getaway w/ Game Room · 5 Min to NYC Train
Entire Place • 4 bedrooms
Cozy Apartment with free parking near EWR/NYC
Entire Place • 3 bedrooms

Spacious 2BR 10min to EWR, 30 min to NYC
Entire Place • 2 bedrooms
1bdr Apt w/yard in the ❤ of Linden NJ close to EWR
Entire Place • 1 bedroom

4 bedroom 2bath Spacious Apartment near Newyork
Entire Place • 4 bedrooms
Note: Performance varies based on location, size, amenities, seasonality, and management quality. Data reflects the past 12 months.
Top Performing Airbnb Hosts in Linden (2026)
Learn from the best! This table showcases top-performing Airbnb hosts in Linden based on the number of properties managed and estimated total revenue over the past year. Analyze their scale and performance metrics.
| Host Name | Properties | Grossing Revenue | Stay Reviews | Avg Rating |
|---|---|---|---|---|
| Pinny And Ushey | 1 | $155,240 | 30 | 4.73/5.0 |
| Sadath | 3 | $106,091 | 141 | 4.47/5.0 |
| Patrick | 4 | $84,485 | 107 | 4.87/5.0 |
| Victor | 1 | $66,863 | 49 | 4.88/5.0 |
| Therman | 1 | $39,219 | 139 | 4.93/5.0 |
| Michael | 3 | $39,188 | 798 | 4.66/5.0 |
| Karina | 1 | $38,304 | 126 | 5.00/5.0 |
| Sam | 9 | $37,738 | 63 | 4.05/5.0 |
| Milena | 1 | $37,384 | 171 | 4.91/5.0 |
| Natasha | 1 | $33,101 | 76 | 4.86/5.0 |
Analyzing the strategies of top hosts, such as their property selection, pricing, and guest communication, can offer valuable lessons for optimizing your own Airbnb operations in Linden.
Dive Deeper: Advanced Linden STR Market Data (2026)
Ready to unlock more insights? AirROI provides access to advanced metrics and comprehensive Airbnb data for Linden. Explore detailed analytics beyond this report to refine your investment strategy, optimize pricing, and maximize your vacation rental profits.
Explore Advanced MetricsLinden Short-Term Rental Market Composition (2026): Property & Room Types
Room Type Distribution
Property Type Distribution
Market Composition Insights for Linden
- The Linden Airbnb market composition is heavily skewed towards Entire Home/Apt listings, which make up 41.9% of the 62 active rentals. This indicates strong guest preference for privacy and space.
- However, a notable 25.8% share for Private Rooms suggests opportunities for budget-conscious travelers or hosts renting out spare rooms.
- Looking at the property type distribution in Linden, House properties are the most common (66.1%), reflecting the local real estate landscape.
- Houses represent a significant 66.1% portion, catering likely to families or larger groups.
- Smaller segments like others, hotel/boutique (combined 3.2%) offer potential for unique stay experiences.
Linden Airbnb Room Capacity Analysis (2026): Bedroom Distribution
Distribution of Listings by Number of Bedrooms
Room Capacity Insights for Linden
- The dominant room capacity in Linden is 2 bedrooms listings, making up 16.1% of the market. This suggests a strong demand for properties suitable for couples or solo travelers.
- Together, 2 bedrooms and 1 bedroom properties represent 27.4% of the active Airbnb listings in Linden, indicating a high concentration in these sizes.
Linden Vacation Rental Guest Capacity Trends (2026)
Distribution of Listings by Guest Capacity
Guest Capacity Insights for Linden
- The most common guest capacity trend in Linden vacation rentals is listings accommodating 4 guests (17.7%). This suggests the primary traveler segment is likely small families or groups.
- Properties designed for 4 guests and 6 guests dominate the Linden STR market, accounting for 25.8% of listings.
- 16.2% of properties accommodate 6+ guests, serving the market segment for larger families or group travel in Linden.
- On average, properties in Linden are equipped to host 2.1 guests.
Linden Airbnb Booking Patterns (2026): Available vs. Booked Days
Available Days Distribution
Booked Days Distribution
Booking Pattern Insights for Linden
- The most common availability pattern in Linden falls within the 271-366 days range, representing 67.7% of listings. This suggests many properties have significant open periods on their calendars.
- Approximately 82.2% of listings show high availability (181+ days open annually), indicating potential for increased bookings or specific owner usage patterns.
- For booked days, the 31-90 days range is most frequent in Linden (37.1%), reflecting common guest stay durations or potential owner blocking patterns.
- A notable 19.4% of properties secure long booking periods (181+ days booked per year), highlighting successful long-term rental strategies or significant owner usage.
Linden Airbnb Minimum Stay Requirements Analysis
Distribution of Listings by Minimum Night Requirement
1 Night
41 listings
66.1% of total
2 Nights
2 listings
3.2% of total
3 Nights
4 listings
6.5% of total
4-6 Nights
1 listings
1.6% of total
7-29 Nights
5 listings
8.1% of total
30+ Nights
9 listings
14.5% of total
Key Insights
- The most prevalent minimum stay requirement in Linden is 1 Night, adopted by 66.1% of listings. This highlights the market's preference for shorter, flexible bookings.
- A strong majority (69.3%) of the Linden Airbnb data shows acceptance of very short stays (1-2 nights), indicating a dynamic, high-turnover market.
- A significant segment (14.5%) caters to monthly stays (30+ nights) in Linden, pointing to opportunities in the extended-stay market.
Recommendations
- Align with the market by considering a 1 Night minimum stay, as 66.1% of Linden hosts use this setting.
- Explore offering discounts for stays of 30+ nights to attract the 14.5% of the market seeking extended stays.
- Adjust minimum nights based on seasonality – potentially shorter during low season and longer during peak demand periods in Linden.
Linden Airbnb Cancellation Policy Trends Analysis (2026)
Super Strict 60 Days
1 listings
1.6% of total
Limited
1 listings
1.6% of total
Super Strict 30 Days
1 listings
1.6% of total
Flexible
8 listings
12.9% of total
Moderate
12 listings
19.4% of total
Firm
5 listings
8.1% of total
Strict
34 listings
54.8% of total
Cancellation Policy Insights for Linden
- The prevailing Airbnb cancellation policy trend in Linden is Strict, used by 54.8% of listings.
- A majority (62.9%) of hosts in Linden utilize Firm or Strict policies, indicating a market where hosts prioritize booking security.
Recommendations for Hosts
- Consider adopting a Strict policy to align with the 54.8% market standard in Linden.
- With 54.8% using Strict terms, this is a viable option in Linden, particularly for high-value properties or during peak demand periods.
- Regularly review your cancellation policy against competitors and market demand shifts in Linden.
Linden STR Booking Lead Time Analysis (2026)
Average Booking Lead Time by Month
Booking Lead Time Insights for Linden
- The overall average booking lead time for vacation rentals in Linden is 19 days.
- Guests book furthest in advance for stays during October (average 50 days), likely coinciding with peak travel demand or local events.
- The shortest booking windows occur for stays in March (average 11 days), indicating more last-minute travel plans during this time.
- Seasonally, Fall (35 days avg.) sees the longest lead times, while Spring (16 days avg.) has the shortest, reflecting typical travel planning cycles.
Recommendations for Hosts
- Use the overall average lead time (19 days) as a baseline for your pricing and availability strategy in Linden.
- For October stays, consider implementing length-of-stay discounts or slightly higher rates for bookings made less than 50 days out to capitalize on advance planning.
- During March, focus on last-minute booking availability and promotions, as guests book with very short notice (11 days avg.).
- Target marketing efforts for the Fall season well in advance (at least 35 days) to capture early planners.
- Monitor your own booking lead times against these Linden averages to identify opportunities for dynamic pricing adjustments.
Popular & Essential Airbnb Amenities in Linden (2026)
Amenity Prevalence
Amenity Insights for Linden
- Essential amenities in Linden that guests expect include: Wifi, Carbon monoxide alarm, Smoke alarm, Heating, Kitchen, Air conditioning, Dishes and silverware, Hot water. Lacking these (any) could significantly impact bookings.
- Popular amenities like Refrigerator, Fire extinguisher are common but not universal. Offering these can provide a competitive edge.
Recommendations for Hosts
- Ensure your listing includes all essential amenities for Linden: Wifi, Carbon monoxide alarm, Smoke alarm, Heating, Kitchen, Air conditioning, Dishes and silverware, Hot water.
- Prioritize adding missing essentials: Smoke alarm, Heating, Kitchen, Air conditioning, Dishes and silverware, Hot water.
- Consider adding popular differentiators like Refrigerator or Fire extinguisher to increase appeal.
- Highlight unique or less common amenities you offer (e.g., hot tub, dedicated workspace, EV charger) in your listing description and photos.
- Regularly check competitor amenities in Linden to stay competitive.
Linden Airbnb Guest Demographics & Profile Analysis (2026)
Guest Profile Summary for Linden
- The typical guest profile for Airbnb in Linden consists of primarily domestic travelers (79%), often arriving from nearby New York, typically belonging to the Post-2000s (Gen Z/Alpha) group (50%), primarily speaking English or Spanish.
- Domestic travelers account for 78.7% of guests.
- Key international markets include United States (78.7%) and Canada (2.8%).
- Top languages spoken are English (57.7%) followed by Spanish (19.1%).
- A significant demographic segment is the Post-2000s (Gen Z/Alpha) group, representing 50% of guests.
Recommendations for Hosts
- Target domestic marketing efforts towards travelers from New York and Atlanta.
- Tailor amenities and listing descriptions to appeal to the dominant Post-2000s (Gen Z/Alpha) demographic (e.g., highlight fast WiFi, smart home features, local guides).
- Highlight unique local experiences or amenities relevant to the primary guest profile.
- Consider seasonal promotions aligned with peak travel times for key origin markets.
Nearby Short-Term Rental Market Comparison
How does the Linden Airbnb market stack up against its neighbors? Compare key performance metrics like average monthly revenue, ADR, and occupancy rates in surrounding areas to understand the broader regional STR landscape.
| Market | Active Properties | Monthly Revenue | Daily Rate | Avg. Occupancy |
|---|---|---|---|---|
| Freeland | 11 | $8,436 | $684.29 | 42% |
| Berlin Township | 15 | $7,208 | $729.10 | 35% |
| Town of Kingston | 10 | $6,470 | $473.76 | 49% |
| Frankford Township | 11 | $6,329 | $505.19 | 41% |
| Spring Lake Heights | 16 | $5,785 | $725.20 | 40% |
| Stroud Township | 137 | $5,728 | $478.40 | 40% |
| Town of Monroe | 22 | $5,690 | $720.52 | 37% |
| Hilltown Township | 11 | $5,557 | $578.96 | 40% |
| Stone Harbor | 42 | $5,467 | $785.22 | 39% |
| Mount Pocono | 22 | $5,346 | $485.18 | 45% |