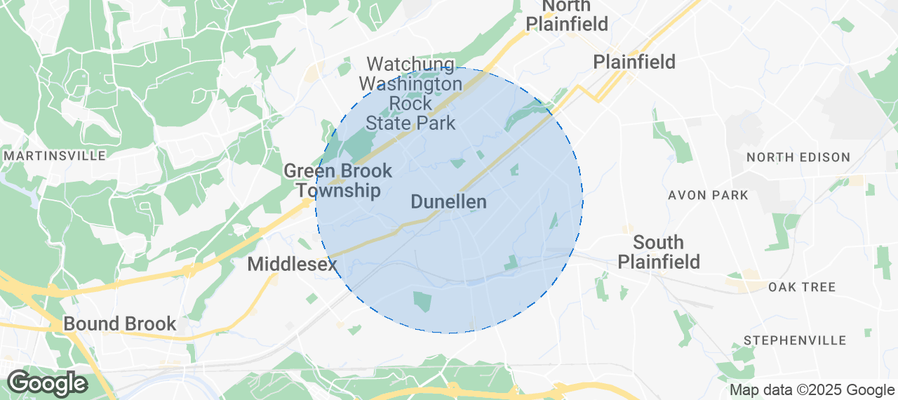
Dunellen Airbnb Market Analysis 2026: Short Term Rental Data & Vacation Rental Statistics in New Jersey, United States
Is Airbnb profitable in Dunellen in 2026? Explore comprehensive Airbnb analytics for Dunellen, New Jersey, United States to uncover income potential. This 2026 STR market report for Dunellen, based on AirROI data from February 2025 to January 2026, reveals key trends in the niche market of 20 active listings.
Whether you're considering an Airbnb investment in Dunellen, optimizing your existing vacation rental, or exploring rental arbitrage opportunities, understanding the Dunellen Airbnb data is crucial. Leveraging the low regulation environment is key to maximizing your short term rental income potential. Let's dive into the specifics.
Key Dunellen Airbnb Performance Metrics Overview
Monthly Airbnb Revenue Variations & Income Potential in Dunellen (2026)
Understanding the monthly revenue variations for Airbnb listings in Dunellen is key to maximizing your short term rental income potential. Seasonality significantly impacts earnings. Our analysis, based on data from the past 12 months, shows that the peak revenue month for STRs in Dunellen is typically May, while January often presents the lowest earnings, highlighting opportunities for strategic pricing adjustments during shoulder and low seasons. Explore the typical Airbnb income in Dunellen across different performance tiers:
- Best-in-class properties (Top 10%) achieve $5,783+ monthly, often utilizing dynamic pricing and superior guest experiences.
- Strong performing properties (Top 25%) earn $4,039 or more, indicating effective management and desirable locations/amenities.
- Typical properties (Median) generate around $2,225 per month, representing the average market performance.
- Entry-level properties (Bottom 25%) see earnings around $1,397, often with potential for optimization.
Average Monthly Airbnb Earnings Trend in Dunellen
Dunellen Airbnb Occupancy Rate Trends (2026)
Maximize your bookings by understanding the Dunellen STR occupancy trends. Seasonal demand shifts significantly influence how often properties are booked. Typically, Aprilsees the highest demand (peak season occupancy), while August experiences the lowest (low season). Effective strategies, like adjusting minimum stays or offering promotions, can boost occupancy during slower periods. Here's how different property tiers perform in Dunellen:
- Best-in-class properties (Top 10%) achieve 80%+ occupancy, indicating high desirability and potentially optimized availability.
- Strong performing properties (Top 25%) maintain 60% or higher occupancy, suggesting good market fit and guest satisfaction.
- Typical properties (Median) have an occupancy rate around 35%.
- Entry-level properties (Bottom 25%) average 17% occupancy, potentially facing higher vacancy.
Average Monthly Occupancy Rate Trend in Dunellen
Average Daily Rate (ADR) Airbnb Trends in Dunellen (2026)
Effective short term rental pricing strategy in Dunellen involves understanding monthly ADR fluctuations. The Average Daily Rate (ADR) for Airbnb in Dunellen typically peaks in August and dips lowest during February. Leveraging Airbnb dynamic pricing tools or strategies based on this seasonality can significantly boost revenue. Here's a look at the typical nightly rates achieved:
- Best-in-class properties (Top 10%) command rates of $256+ per night, often due to premium features or locations.
- Strong performing properties (Top 25%) achieve nightly rates of $217 or more.
- Typical properties (Median) charge around $197 per night.
- Entry-level properties (Bottom 25%) earn around $182 per night.
Average Daily Rate (ADR) Trend by Month in Dunellen
Get Live Dunellen Market Intelligence 👇
Explore Real-time Analytics
Airbnb Seasonality Analysis & Trends in Dunellen (2026)
Peak Season (May, July, September)
- Revenue averages $3,842 per month
- Occupancy rates average 45.3%
- Daily rates average $219
Shoulder Season
- Revenue averages $2,918 per month
- Occupancy maintains around 41.7%
- Daily rates hold near $198
Low Season (January, February, December)
- Revenue drops to average $1,989 per month
- Occupancy decreases to average 35.9%
- Daily rates adjust to average $171
Seasonality Insights for Dunellen
- The Airbnb seasonality in Dunellen shows highly seasonal trends requiring careful strategy. While the sections above show seasonal averages, it's also insightful to look at the extremes:
- During the high season, the absolute peak month showcases Dunellen's highest earning potential, with monthly revenues capable of climbing to $4,212, occupancy reaching a high of 55.8%, and ADRs peaking at $232.
- Conversely, the slowest single month of the year, typically falling within the low season, marks the market's lowest point. In this month, revenue might dip to $1,692, occupancy could drop to 26.9%, and ADRs may adjust down to $165.
- Understanding both the seasonal averages and these monthly peaks and troughs in revenue, occupancy, and ADR is crucial for maximizing your Airbnb profit potential in Dunellen.
Seasonal Strategies for Maximizing Profit
- Peak Season: Maximize revenue through premium pricing and potentially longer minimum stays. Ensure high availability.
- Low Season: Offer competitive pricing, special promotions (e.g., extended stay discounts), and flexible cancellation policies. Target off-season travelers like remote workers or budget-conscious guests.
- Shoulder Seasons: Implement dynamic pricing that balances peak and low rates. Target weekend travelers or specific events. Offer slightly more flexible terms than peak season.
- Regularly analyze your own performance against these Dunellen seasonality benchmarks and adjust your pricing and availability strategy accordingly.
Best Areas for Airbnb Investment in Dunellen (2026)
Exploring the top neighborhoods for short-term rentals in Dunellen? This section highlights key areas, outlining why they are attractive for hosts and guests, along with notable local attractions. Consider these locations based on your target guest profile and investment strategy.
| Neighborhood / Area | Why Host Here? (Target Guests & Appeal) | Key Attractions & Landmarks |
|---|---|---|
| Dunellen Downtown | A vibrant center with restaurants, cafes, and shops. Young professionals and families are drawn to its community spirit and access to NJ Transit, making it a great spot for short-term rentals. | Dunellen Theater, Dunellen Public Library, local eateries, Dunellen Farmers Market |
| Residential Dunellen | Quiet, family-friendly neighborhoods with parks and schools. This area is appealing to families visiting nearby relatives, ideal for longer stays. | Washington Park, Dunellen High School, local parks, community center |
| Green Brook Park Area | Located near nature and outdoor activities, this area is perfect for guests wanting a getaway from the city. It attracts outdoor enthusiasts and families who appreciate parks. | Green Brook Park, hiking trails, picnic areas |
| Bound Brook Nearby | Just a short drive away, this area attracts guests looking to explore the Bound Brook history and waterfront activities, offering a charming small-town experience. | Bound Brook Historic District, Riverside Park, local shops |
| Bridgewater Commons Area | Larger commercial area close to shopping and dining options, perfect for business travelers or guests looking for retail therapy in nearby Bridgewater. | Bridgewater Commons Mall, restaurants, business centers |
| Somerville Main St. | A charming downtown area with a rich history and lively events. This draws tourists and locals alike, especially during seasonal festivals. | Somerset County Courthouse, local restaurants, art galleries, festivals |
| Edison Train Station Area | Proximity to Edison and direct train services to New York City make this an attractive option for commuters and tourists visiting NYC. | Edison Train Station, Parks nearby, local dining options |
| Near Rutgers University | Attracts students, families visiting students, and alumni, making it a strong area for year-round rentals due to the university population. | Rutgers University campus, local cafes, sporting events |
Understanding Airbnb License Requirements & STR Laws in Dunellen (2026)
While Dunellen, New Jersey, United States currently shows low STR regulations, specific Airbnb license requirements might still exist or change. Always verify the latest short term rental regulations and Airbnb license requirements directly with local government authorities for Dunellen to ensure full compliance before hosting.
(Source: AirROI data, 2026, finding no licensed listings among those analyzed)
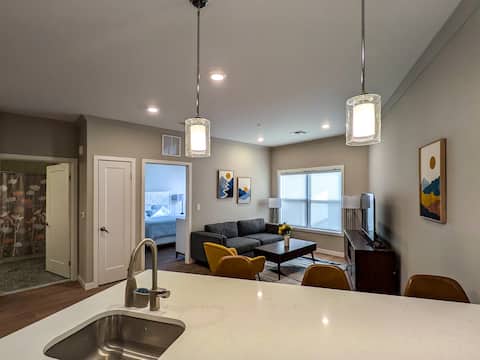
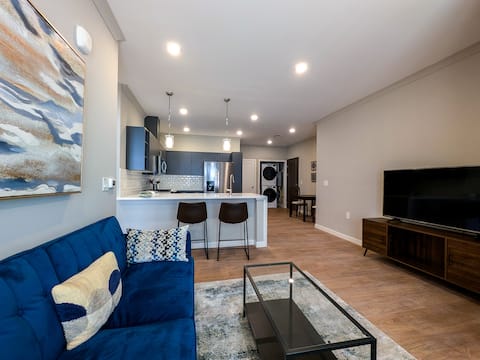
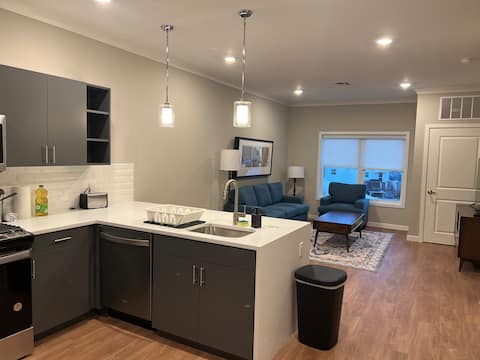
Top Performing Airbnb Properties in Dunellen (2026)
Benchmark your potential! Explore examples of top-performing Airbnb properties in Dunellenbased on Trailing Twelve Month (TTM) revenue. Analyze their characteristics, revenue, occupancy rate, and ADR to understand what drives success in this market.

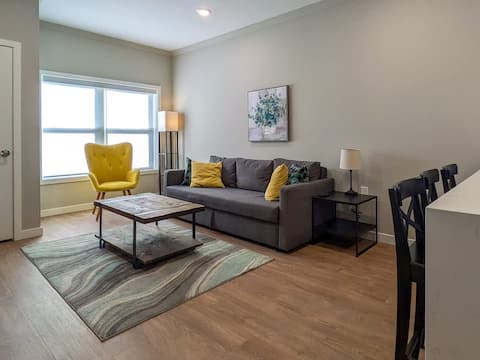
214 Modern 3BR | Walk to Train | Free Parking
Entire Place • 3 bedrooms
310 Sleek 1BR – Walk to Train |Free Parking.
Entire Place • 1 bedroom
222 Modern 2BR Apt - 2 Min to Train, Free Parking
Entire Place • 2 bedrooms
212 Modern 1BR | 2-Min Walk to Train |Free Parking
Entire Place • 1 bedroom
229 Modern 1BR – Steps to Train, Free Parking
Entire Place • 1 bedroom

227 Chic 1BR – 2-Min Walk to Train, Free Parking
Entire Place • 1 bedroom
Note: Performance varies based on location, size, amenities, seasonality, and management quality. Data reflects the past 12 months.
Top Performing Airbnb Hosts in Dunellen (2026)
Learn from the best! This table showcases top-performing Airbnb hosts in Dunellen based on the number of properties managed and estimated total revenue over the past year. Analyze their scale and performance metrics.
| Host Name | Properties | Grossing Revenue | Stay Reviews | Avg Rating |
|---|---|---|---|---|
| Andy | 19 | $297,962 | 263 | 4.94/5.0 |
| Shay | 1 | $1,537 | 8 | 5.00/5.0 |
Analyzing the strategies of top hosts, such as their property selection, pricing, and guest communication, can offer valuable lessons for optimizing your own Airbnb operations in Dunellen.
Dive Deeper: Advanced Dunellen STR Market Data (2026)
Ready to unlock more insights? AirROI provides access to advanced metrics and comprehensive Airbnb data for Dunellen. Explore detailed analytics beyond this report to refine your investment strategy, optimize pricing, and maximize your vacation rental profits.
Explore Advanced MetricsDunellen Short-Term Rental Market Composition (2026): Property & Room Types
Room Type Distribution
Property Type Distribution
Market Composition Insights for Dunellen
- The Dunellen Airbnb market composition is heavily skewed towards Entire Home/Apt listings, which make up 95% of the 20 active rentals. This indicates strong guest preference for privacy and space.
- Looking at the property type distribution in Dunellen, Apartment/Condo properties are the most common (95%), reflecting the local real estate landscape.
Dunellen Airbnb Room Capacity Analysis (2026): Bedroom Distribution
Distribution of Listings by Number of Bedrooms
Room Capacity Insights for Dunellen
- The dominant room capacity in Dunellen is 1 bedroom listings, making up 65% of the market. This suggests a strong demand for properties suitable for couples or solo travelers.
- Together, 1 bedroom and 2 bedrooms properties represent 80.0% of the active Airbnb listings in Dunellen, indicating a high concentration in these sizes.
- With over half the market (65%) consisting of studios or 1-bedroom units, Dunellen is particularly well-suited for individuals or couples.
Dunellen Vacation Rental Guest Capacity Trends (2026)
Distribution of Listings by Guest Capacity
Guest Capacity Insights for Dunellen
- The most common guest capacity trend in Dunellen vacation rentals is listings accommodating 3 guests (60%). This suggests the primary traveler segment is likely small families or groups.
- Properties designed for 3 guests and 5 guests dominate the Dunellen STR market, accounting for 75.0% of listings.
- 15.0% of properties accommodate 6+ guests, serving the market segment for larger families or group travel in Dunellen.
- On average, properties in Dunellen are equipped to host 4.0 guests.
Dunellen Airbnb Booking Patterns (2026): Available vs. Booked Days
Available Days Distribution
Booked Days Distribution
Booking Pattern Insights for Dunellen
- The most common availability pattern in Dunellen falls within the 271-366 days range, representing 65% of listings. This suggests many properties have significant open periods on their calendars.
- Approximately 95.0% of listings show high availability (181+ days open annually), indicating potential for increased bookings or specific owner usage patterns.
- For booked days, the 31-90 days range is most frequent in Dunellen (40%), reflecting common guest stay durations or potential owner blocking patterns.
- A notable 5.0% of properties secure long booking periods (181+ days booked per year), highlighting successful long-term rental strategies or significant owner usage.
Dunellen Airbnb Minimum Stay Requirements Analysis
Distribution of Listings by Minimum Night Requirement
7-29 Nights
19 listings
95% of total
30+ Nights
1 listings
5% of total
Key Insights
- The most prevalent minimum stay requirement in Dunellen is 7-29 Nights, adopted by 95% of listings. This highlights the market's preference for shorter, flexible bookings.
Recommendations
- Align with the market by considering a 7-29 Nights minimum stay, as 95% of Dunellen hosts use this setting.
- Adjust minimum nights based on seasonality – potentially shorter during low season and longer during peak demand periods in Dunellen.
Dunellen Airbnb Cancellation Policy Trends Analysis (2026)
Flexible
3 listings
15% of total
Moderate
13 listings
65% of total
Firm
4 listings
20% of total
Cancellation Policy Insights for Dunellen
- The prevailing Airbnb cancellation policy trend in Dunellen is Moderate, used by 65% of listings.
- The market strongly favors guest-friendly terms, with 80.0% of listings offering Flexible or Moderate policies. This suggests guests in Dunellen may expect booking flexibility.
Recommendations for Hosts
- Consider adopting a Moderate policy to align with the 65% market standard in Dunellen.
- Regularly review your cancellation policy against competitors and market demand shifts in Dunellen.
Dunellen STR Booking Lead Time Analysis (2026)
Average Booking Lead Time by Month
Booking Lead Time Insights for Dunellen
- The overall average booking lead time for vacation rentals in Dunellen is 6 days.
- Guests book furthest in advance for stays during August (average 18 days), likely coinciding with peak travel demand or local events.
- The shortest booking windows occur for stays in October (average 2 days), indicating more last-minute travel plans during this time.
- Seasonally, Summer (12 days avg.) sees the longest lead times, while Winter (6 days avg.) has the shortest, reflecting typical travel planning cycles.
Recommendations for Hosts
- Use the overall average lead time (6 days) as a baseline for your pricing and availability strategy in Dunellen.
- For August stays, consider implementing length-of-stay discounts or slightly higher rates for bookings made less than 18 days out to capitalize on advance planning.
- Target marketing efforts for the Summer season well in advance (at least 12 days) to capture early planners.
- Monitor your own booking lead times against these Dunellen averages to identify opportunities for dynamic pricing adjustments.
Popular & Essential Airbnb Amenities in Dunellen (2026)
Amenity Prevalence
No amenities with partial availability (less than 100%) were found to display in the chart. All essential amenities might be present in all listings. Check insights below.
Amenity Insights for Dunellen
- Essential amenities in Dunellen that guests expect include: Smoke alarm, Free parking on premises, Carbon monoxide alarm, Wifi, Heating, Cooking basics, TV, Washer, Air conditioning, Kitchen. Lacking these (any) could significantly impact bookings.
Recommendations for Hosts
- Ensure your listing includes all essential amenities for Dunellen: Smoke alarm, Free parking on premises, Carbon monoxide alarm, Wifi, Heating, Cooking basics, TV, Washer, Air conditioning, Kitchen.
- Highlight unique or less common amenities you offer (e.g., hot tub, dedicated workspace, EV charger) in your listing description and photos.
- Regularly check competitor amenities in Dunellen to stay competitive.
Dunellen Airbnb Guest Demographics & Profile Analysis (2026)
Guest Profile Summary for Dunellen
- The typical guest profile for Airbnb in Dunellen consists of primarily domestic travelers (91%), often arriving from nearby New York, typically belonging to the Post-2000s (Gen Z/Alpha) group (50%), primarily speaking English or Spanish.
- Domestic travelers account for 91.1% of guests.
- Key international markets include United States (91.1%) and Italy (2.2%).
- Top languages spoken are English (58.5%) followed by Spanish (14.6%).
- A significant demographic segment is the Post-2000s (Gen Z/Alpha) group, representing 50% of guests.
Recommendations for Hosts
- Target domestic marketing efforts towards travelers from New York and Rahway.
- Tailor amenities and listing descriptions to appeal to the dominant Post-2000s (Gen Z/Alpha) demographic (e.g., highlight fast WiFi, smart home features, local guides).
- Highlight unique local experiences or amenities relevant to the primary guest profile.
- Consider seasonal promotions aligned with peak travel times for key origin markets.
Nearby Short-Term Rental Market Comparison
How does the Dunellen Airbnb market stack up against its neighbors? Compare key performance metrics like average monthly revenue, ADR, and occupancy rates in surrounding areas to understand the broader regional STR landscape.
| Market | Active Properties | Monthly Revenue | Daily Rate | Avg. Occupancy |
|---|---|---|---|---|
| Freeland | 11 | $8,436 | $684.29 | 42% |
| Berlin Township | 15 | $7,208 | $729.10 | 35% |
| Town of Kingston | 10 | $6,470 | $473.76 | 49% |
| Frankford Township | 11 | $6,329 | $505.19 | 41% |
| Spring Lake Heights | 16 | $5,785 | $725.20 | 40% |
| Stroud Township | 137 | $5,728 | $478.40 | 40% |
| Town of Monroe | 22 | $5,690 | $720.52 | 37% |
| Hilltown Township | 11 | $5,557 | $578.96 | 40% |
| Stone Harbor | 42 | $5,467 | $785.22 | 39% |
| Mount Pocono | 22 | $5,346 | $485.18 | 45% |