Camden Airbnb Market Analysis 2026: Short Term Rental Data & Vacation Rental Statistics in New Jersey, United States
Is Airbnb profitable in Camden in 2026? Explore comprehensive Airbnb analytics for Camden, New Jersey, United States to uncover income potential. This 2026 STR market report for Camden, based on AirROI data from February 2025 to January 2026, reveals key trends in the niche market of 23 active listings.
Whether you're considering an Airbnb investment in Camden, optimizing your existing vacation rental, or exploring rental arbitrage opportunities, understanding the Camden Airbnb data is crucial. Leveraging the low regulation environment is key to maximizing your short term rental income potential. Let's dive into the specifics.
Key Camden Airbnb Performance Metrics Overview
Monthly Airbnb Revenue Variations & Income Potential in Camden (2026)
Understanding the monthly revenue variations for Airbnb listings in Camden is key to maximizing your short term rental income potential. Seasonality significantly impacts earnings. Our analysis, based on data from the past 12 months, shows that the peak revenue month for STRs in Camden is typically May, while January often presents the lowest earnings, highlighting opportunities for strategic pricing adjustments during shoulder and low seasons. Explore the typical Airbnb income in Camden across different performance tiers:
- Best-in-class properties (Top 10%) achieve $5,941+ monthly, often utilizing dynamic pricing and superior guest experiences.
- Strong performing properties (Top 25%) earn $3,162 or more, indicating effective management and desirable locations/amenities.
- Typical properties (Median) generate around $1,248 per month, representing the average market performance.
- Entry-level properties (Bottom 25%) see earnings around $517, often with potential for optimization.
Average Monthly Airbnb Earnings Trend in Camden
Camden Airbnb Occupancy Rate Trends (2026)
Maximize your bookings by understanding the Camden STR occupancy trends. Seasonal demand shifts significantly influence how often properties are booked. Typically, Februarysees the highest demand (peak season occupancy), while January experiences the lowest (low season). Effective strategies, like adjusting minimum stays or offering promotions, can boost occupancy during slower periods. Here's how different property tiers perform in Camden:
- Best-in-class properties (Top 10%) achieve 64%+ occupancy, indicating high desirability and potentially optimized availability.
- Strong performing properties (Top 25%) maintain 51% or higher occupancy, suggesting good market fit and guest satisfaction.
- Typical properties (Median) have an occupancy rate around 34%.
- Entry-level properties (Bottom 25%) average 15% occupancy, potentially facing higher vacancy.
Average Monthly Occupancy Rate Trend in Camden
Average Daily Rate (ADR) Airbnb Trends in Camden (2026)
Effective short term rental pricing strategy in Camden involves understanding monthly ADR fluctuations. The Average Daily Rate (ADR) for Airbnb in Camden typically peaks in November and dips lowest during February. Leveraging Airbnb dynamic pricing tools or strategies based on this seasonality can significantly boost revenue. Here's a look at the typical nightly rates achieved:
- Best-in-class properties (Top 10%) command rates of $268+ per night, often due to premium features or locations.
- Strong performing properties (Top 25%) achieve nightly rates of $206 or more.
- Typical properties (Median) charge around $136 per night.
- Entry-level properties (Bottom 25%) earn around $68 per night.
Average Daily Rate (ADR) Trend by Month in Camden
Get Live Camden Market Intelligence 👇

Explore Real-time Analytics
Airbnb Seasonality Analysis & Trends in Camden (2026)
Peak Season (May, November, April)
- Revenue averages $2,617 per month
- Occupancy rates average 36.8%
- Daily rates average $162
Shoulder Season
- Revenue averages $1,975 per month
- Occupancy maintains around 38.3%
- Daily rates hold near $152
Low Season (January, September, October)
- Revenue drops to average $1,689 per month
- Occupancy decreases to average 25.4%
- Daily rates adjust to average $172
Seasonality Insights for Camden
- The Airbnb seasonality in Camden shows moderate seasonality with distinct peak and low periods. While the sections above show seasonal averages, it's also insightful to look at the extremes:
- During the high season, the absolute peak month showcases Camden's highest earning potential, with monthly revenues capable of climbing to $2,635, occupancy reaching a high of 53.6%, and ADRs peaking at $189.
- Conversely, the slowest single month of the year, typically falling within the low season, marks the market's lowest point. In this month, revenue might dip to $1,459, occupancy could drop to 24.1%, and ADRs may adjust down to $133.
- Understanding both the seasonal averages and these monthly peaks and troughs in revenue, occupancy, and ADR is crucial for maximizing your Airbnb profit potential in Camden.
Seasonal Strategies for Maximizing Profit
- Peak Season: Maximize revenue through premium pricing and potentially longer minimum stays. Ensure high availability.
- Low Season: Offer competitive pricing, special promotions (e.g., extended stay discounts), and flexible cancellation policies. Target off-season travelers like remote workers or budget-conscious guests.
- Shoulder Seasons: Implement dynamic pricing that balances peak and low rates. Target weekend travelers or specific events. Offer slightly more flexible terms than peak season.
- Regularly analyze your own performance against these Camden seasonality benchmarks and adjust your pricing and availability strategy accordingly.
Best Areas for Airbnb Investment in Camden (2026)
Exploring the top neighborhoods for short-term rentals in Camden? This section highlights key areas, outlining why they are attractive for hosts and guests, along with notable local attractions. Consider these locations based on your target guest profile and investment strategy.
| Neighborhood / Area | Why Host Here? (Target Guests & Appeal) | Key Attractions & Landmarks |
|---|---|---|
| Camden Waterfront | A picturesque area along the Delaware River featuring parks, recreational activities, and views of the Philadelphia skyline. It's popular with tourists looking for scenic walks and family activities. | Adventure Aquarium, Camden Children's Garden, BB&T Pavilion, Wiggins Park, Campbell's Field |
| Borough of Camden Historic District | This historic area is rich in culture and history, attracting visitors interested in the local heritage and architecture. It's perfect for those who appreciate historical sites and artistic events. | Camden County Historical Society, The Walt Whitman Arts Center, Historic Camden County Courthouse, Camden's Waterfront South Theatre |
| Cramer Hill | A diverse neighborhood with a mix of residential and commercial spaces. Offers a unique local experience and is ideally located for guests wanting to explore Camden and nearby Philadelphia. | Cramer Hill Park, Camden's local eateries, Martin Luther King Jr. Park |
| East Camden | This neighborhood is undergoing revitalization, making it an interesting spot for investment. It's centrally located for easy access to Philadelphia and local amenities. | East Camden Shopping Center, Camden's Cultural District, local street art scenes |
| Fairview | Known for its residential appeal, Fairview is close to many local attractions and serves as a quiet retreat while still being within reach of the bustling city atmosphere. | Fairview Cemetery, local parks, Fairview Village |
| North Camden | This area offers historical significance and is a hub for cultural events, attracting guests who are interested in the local community life and deep history of the region. | North Camden Waterfront Park, Lanning Square Park, local festivals and community events |
| Parkside | A neighborhood with a rich history and strong community spirit, Parkside is filled with local charm and offers access to various parks and recreational facilities. | Riverside Park, Camden Park, local community events and gatherings |
| Whitman Park | This area is known for its family-friendly atmosphere and community vibe, making it appealing for those looking for longer stays with a home-like feel. | Whitman Park, local markets, community centers |
Understanding Airbnb License Requirements & STR Laws in Camden (2026)
While Camden, New Jersey, United States currently shows low STR regulations, specific Airbnb license requirements might still exist or change. Always verify the latest short term rental regulations and Airbnb license requirements directly with local government authorities for Camden to ensure full compliance before hosting.
(Source: AirROI data, 2026, finding no licensed listings among those analyzed)
Top Performing Airbnb Properties in Camden (2026)
Benchmark your potential! Explore examples of top-performing Airbnb properties in Camdenbased on Trailing Twelve Month (TTM) revenue. Analyze their characteristics, revenue, occupancy rate, and ADR to understand what drives success in this market.

Beautiful family home
Entire Place • 4 bedrooms

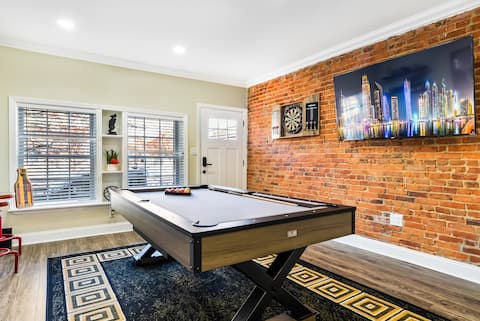
Fun, Stylish, Pool table, Darts
Entire Place • 4 bedrooms
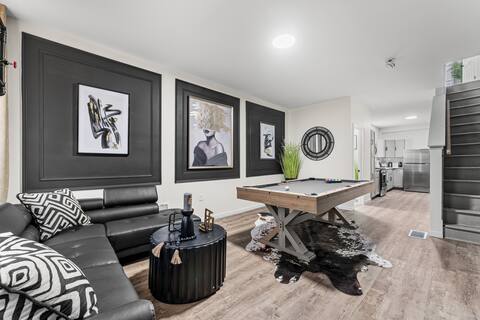
Cozy & Stylish/Pool Table & Fun
Entire Place • 4 bedrooms
Stylish, Fun and Cozy | Pool table, Darts & PKG
Entire Place • 3 bedrooms

The Prestige Get-Away 10 mins from DT philly
Entire Place • 1 bedroom

The Cozy Waldorf Experience
Entire Place • 2 bedrooms
Note: Performance varies based on location, size, amenities, seasonality, and management quality. Data reflects the past 12 months.
Top Performing Airbnb Hosts in Camden (2026)
Learn from the best! This table showcases top-performing Airbnb hosts in Camden based on the number of properties managed and estimated total revenue over the past year. Analyze their scale and performance metrics.
| Host Name | Properties | Grossing Revenue | Stay Reviews | Avg Rating |
|---|---|---|---|---|
| James | 3 | $156,320 | 379 | 4.80/5.0 |
| Gianna | 1 | $73,747 | 46 | 4.89/5.0 |
| Ibrahima S | 2 | $34,150 | 109 | 4.50/5.0 |
| Mkd | 2 | $31,641 | 26 | 4.37/5.0 |
| J R | 2 | $27,405 | 16 | 3.71/5.0 |
| Jodatur | 1 | $23,338 | 37 | 5.00/5.0 |
| Melissa | 2 | $13,521 | 110 | 4.76/5.0 |
| Kherra | 1 | $11,475 | 26 | 4.69/5.0 |
| Pasha | 1 | $6,377 | 84 | 4.65/5.0 |
| Budget BNB | 2 | $4,763 | 13 | 5.00/5.0 |
Analyzing the strategies of top hosts, such as their property selection, pricing, and guest communication, can offer valuable lessons for optimizing your own Airbnb operations in Camden.
Dive Deeper: Advanced Camden STR Market Data (2026)
Ready to unlock more insights? AirROI provides access to advanced metrics and comprehensive Airbnb data for Camden. Explore detailed analytics beyond this report to refine your investment strategy, optimize pricing, and maximize your vacation rental profits.
Explore Advanced MetricsCamden Short-Term Rental Market Composition (2026): Property & Room Types
Room Type Distribution
Property Type Distribution
Market Composition Insights for Camden
- The Camden Airbnb market composition is heavily skewed towards Entire Home/Apt listings, which make up 65.2% of the 23 active rentals. This indicates strong guest preference for privacy and space.
- However, a notable 34.8% share for Private Rooms suggests opportunities for budget-conscious travelers or hosts renting out spare rooms.
- Looking at the property type distribution in Camden, House properties are the most common (69.6%), reflecting the local real estate landscape.
- Houses represent a significant 69.6% portion, catering likely to families or larger groups.
- Smaller segments like others (combined 4.3%) offer potential for unique stay experiences.
Camden Airbnb Room Capacity Analysis (2026): Bedroom Distribution
Distribution of Listings by Number of Bedrooms
Room Capacity Insights for Camden
- The dominant room capacity in Camden is 1 bedroom listings, making up 39.1% of the market. This suggests a strong demand for properties suitable for couples or solo travelers.
- Together, 1 bedroom and 4 bedrooms properties represent 56.5% of the active Airbnb listings in Camden, indicating a high concentration in these sizes.
- A significant 26.1% of listings offer 3+ bedrooms, catering to larger groups and families seeking more space in Camden.
Camden Vacation Rental Guest Capacity Trends (2026)
Distribution of Listings by Guest Capacity
Guest Capacity Insights for Camden
- The most common guest capacity trend in Camden vacation rentals is listings accommodating 2 guests (21.7%). This suggests the primary traveler segment is likely couples or solo travelers.
- Properties designed for 2 guests and 4 guests dominate the Camden STR market, accounting for 39.1% of listings.
- 26.0% of properties accommodate 6+ guests, serving the market segment for larger families or group travel in Camden.
- On average, properties in Camden are equipped to host 3.3 guests.
Camden Airbnb Booking Patterns (2026): Available vs. Booked Days
Available Days Distribution
Booked Days Distribution
Booking Pattern Insights for Camden
- The most common availability pattern in Camden falls within the 271-366 days range, representing 60.9% of listings. This suggests many properties have significant open periods on their calendars.
- Approximately 87.0% of listings show high availability (181+ days open annually), indicating potential for increased bookings or specific owner usage patterns.
- For booked days, the 31-90 days range is most frequent in Camden (39.1%), reflecting common guest stay durations or potential owner blocking patterns.
- A notable 13.0% of properties secure long booking periods (181+ days booked per year), highlighting successful long-term rental strategies or significant owner usage.
Camden Airbnb Minimum Stay Requirements Analysis
Distribution of Listings by Minimum Night Requirement
1 Night
11 listings
47.8% of total
2 Nights
6 listings
26.1% of total
3 Nights
2 listings
8.7% of total
7-29 Nights
3 listings
13% of total
30+ Nights
1 listings
4.3% of total
Key Insights
- The most prevalent minimum stay requirement in Camden is 1 Night, adopted by 47.8% of listings. This highlights the market's preference for shorter, flexible bookings.
- A strong majority (73.9%) of the Camden Airbnb data shows acceptance of very short stays (1-2 nights), indicating a dynamic, high-turnover market.
Recommendations
- Align with the market by considering a 1 Night minimum stay, as 47.8% of Camden hosts use this setting.
- Adjust minimum nights based on seasonality – potentially shorter during low season and longer during peak demand periods in Camden.
Camden Airbnb Cancellation Policy Trends Analysis (2026)
Flexible
7 listings
30.4% of total
Moderate
5 listings
21.7% of total
Firm
10 listings
43.5% of total
Strict
1 listings
4.3% of total
Cancellation Policy Insights for Camden
- The prevailing Airbnb cancellation policy trend in Camden is Firm, used by 43.5% of listings.
- There's a relatively balanced mix between guest-friendly (52.1%) and stricter (47.8%) policies, offering choices for different guest needs.
- Strict cancellation policies are quite rare (4.3%), potentially making listings with this policy less competitive unless justified by high demand or property type.
Recommendations for Hosts
- Consider adopting a Firm policy to align with the 43.5% market standard in Camden.
- Using a Strict policy might deter some guests, as only 4.3% of listings use it. Evaluate if potential revenue protection outweighs possible lower booking rates.
- Regularly review your cancellation policy against competitors and market demand shifts in Camden.
Camden STR Booking Lead Time Analysis (2026)
Average Booking Lead Time by Month
Booking Lead Time Insights for Camden
- The overall average booking lead time for vacation rentals in Camden is 20 days.
- Guests book furthest in advance for stays during July (average 31 days), likely coinciding with peak travel demand or local events.
- The shortest booking windows occur for stays in February (average 5 days), indicating more last-minute travel plans during this time.
- Seasonally, Summer (27 days avg.) sees the longest lead times, while Spring (14 days avg.) has the shortest, reflecting typical travel planning cycles.
Recommendations for Hosts
- Use the overall average lead time (20 days) as a baseline for your pricing and availability strategy in Camden.
- For July stays, consider implementing length-of-stay discounts or slightly higher rates for bookings made less than 31 days out to capitalize on advance planning.
- During February, focus on last-minute booking availability and promotions, as guests book with very short notice (5 days avg.).
- Target marketing efforts for the Summer season well in advance (at least 27 days) to capture early planners.
- Monitor your own booking lead times against these Camden averages to identify opportunities for dynamic pricing adjustments.
Popular & Essential Airbnb Amenities in Camden (2026)
Amenity Prevalence
Amenity Insights for Camden
- Essential amenities in Camden that guests expect include: Wifi, Air conditioning, Heating, Smoke alarm. Lacking these (any) could significantly impact bookings.
- Popular amenities like Carbon monoxide alarm, TV, Kitchen are common but not universal. Offering these can provide a competitive edge.
Recommendations for Hosts
- Ensure your listing includes all essential amenities for Camden: Wifi, Air conditioning, Heating, Smoke alarm.
- Prioritize adding missing essentials: Air conditioning, Heating, Smoke alarm.
- Consider adding popular differentiators like Carbon monoxide alarm or TV to increase appeal.
- Highlight unique or less common amenities you offer (e.g., hot tub, dedicated workspace, EV charger) in your listing description and photos.
- Regularly check competitor amenities in Camden to stay competitive.
Camden Airbnb Guest Demographics & Profile Analysis (2026)
Guest Profile Summary for Camden
- The typical guest profile for Airbnb in Camden consists of primarily domestic travelers (95%), often arriving from nearby New York, typically belonging to the Post-2000s (Gen Z/Alpha) group (50%), primarily speaking English or Spanish.
- Domestic travelers account for 95.1% of guests.
- Key international markets include United States (95.1%) and DC (2.1%).
- Top languages spoken are English (68.1%) followed by Spanish (19.8%).
- A significant demographic segment is the Post-2000s (Gen Z/Alpha) group, representing 50% of guests.
Recommendations for Hosts
- Target domestic marketing efforts towards travelers from New York and Philadelphia.
- Tailor amenities and listing descriptions to appeal to the dominant Post-2000s (Gen Z/Alpha) demographic (e.g., highlight fast WiFi, smart home features, local guides).
- Highlight unique local experiences or amenities relevant to the primary guest profile.
- Consider seasonal promotions aligned with peak travel times for key origin markets.
Nearby Short-Term Rental Market Comparison
How does the Camden Airbnb market stack up against its neighbors? Compare key performance metrics like average monthly revenue, ADR, and occupancy rates in surrounding areas to understand the broader regional STR landscape.
| Market | Active Properties | Monthly Revenue | Daily Rate | Avg. Occupancy |
|---|---|---|---|---|
| Polk Township | 15 | $6,974 | $520.26 | 38% |
| Centreville | 17 | $6,298 | $565.66 | 45% |
| Mayo | 13 | $5,915 | $447.58 | 51% |
| Spring Lake Heights | 16 | $5,785 | $725.20 | 40% |
| Hilltown Township | 11 | $5,557 | $578.96 | 40% |
| Hellam Township | 24 | $5,496 | $386.69 | 45% |
| Cape May Point | 23 | $5,479 | $542.19 | 46% |
| Stone Harbor | 42 | $5,467 | $785.22 | 39% |
| Stevensville | 80 | $5,412 | $556.79 | 41% |
| Neptune City | 12 | $5,299 | $531.14 | 45% |