Avalon Airbnb Market Analysis 2026: Short Term Rental Data & Vacation Rental Statistics in New Jersey, United States
Is Airbnb profitable in Avalon in 2026? Explore comprehensive Airbnb analytics for Avalon, New Jersey, United States to uncover income potential. This 2026 STR market report for Avalon, based on AirROI data from February 2025 to January 2026, reveals key trends in the niche market of 84 active listings.
Whether you're considering an Airbnb investment in Avalon, optimizing your existing vacation rental, or exploring rental arbitrage opportunities, understanding the Avalon Airbnb data is crucial. Leveraging the low regulation environment is key to maximizing your short term rental income potential. Let's dive into the specifics.
Key Avalon Airbnb Performance Metrics Overview
Monthly Airbnb Revenue Variations & Income Potential in Avalon (2026)
Understanding the monthly revenue variations for Airbnb listings in Avalon is key to maximizing your short term rental income potential. Seasonality significantly impacts earnings. Our analysis, based on data from the past 12 months, shows that the peak revenue month for STRs in Avalon is typically July, while January often presents the lowest earnings, highlighting opportunities for strategic pricing adjustments during shoulder and low seasons. Explore the typical Airbnb income in Avalon across different performance tiers:
- Best-in-class properties (Top 10%) achieve $16,927+ monthly, often utilizing dynamic pricing and superior guest experiences.
- Strong performing properties (Top 25%) earn $9,376 or more, indicating effective management and desirable locations/amenities.
- Typical properties (Median) generate around $5,491 per month, representing the average market performance.
- Entry-level properties (Bottom 25%) see earnings around $2,759, often with potential for optimization.
Average Monthly Airbnb Earnings Trend in Avalon
Avalon Airbnb Occupancy Rate Trends (2026)
Maximize your bookings by understanding the Avalon STR occupancy trends. Seasonal demand shifts significantly influence how often properties are booked. Typically, Augustsees the highest demand (peak season occupancy), while January experiences the lowest (low season). Effective strategies, like adjusting minimum stays or offering promotions, can boost occupancy during slower periods. Here's how different property tiers perform in Avalon:
- Best-in-class properties (Top 10%) achieve 64%+ occupancy, indicating high desirability and potentially optimized availability.
- Strong performing properties (Top 25%) maintain 50% or higher occupancy, suggesting good market fit and guest satisfaction.
- Typical properties (Median) have an occupancy rate around 32%.
- Entry-level properties (Bottom 25%) average 20% occupancy, potentially facing higher vacancy.
Average Monthly Occupancy Rate Trend in Avalon
Average Daily Rate (ADR) Airbnb Trends in Avalon (2026)
Effective short term rental pricing strategy in Avalon involves understanding monthly ADR fluctuations. The Average Daily Rate (ADR) for Airbnb in Avalon typically peaks in July and dips lowest during February. Leveraging Airbnb dynamic pricing tools or strategies based on this seasonality can significantly boost revenue. Here's a look at the typical nightly rates achieved:
- Best-in-class properties (Top 10%) command rates of $1,329+ per night, often due to premium features or locations.
- Strong performing properties (Top 25%) achieve nightly rates of $891 or more.
- Typical properties (Median) charge around $583 per night.
- Entry-level properties (Bottom 25%) earn around $360 per night.
Average Daily Rate (ADR) Trend by Month in Avalon
Get Live Avalon Market Intelligence 👇

Explore Real-time Analytics
Airbnb Seasonality Analysis & Trends in Avalon (2026)
Peak Season (July, August, June)
- Revenue averages $15,235 per month
- Occupancy rates average 62.2%
- Daily rates average $782
Shoulder Season
- Revenue averages $5,775 per month
- Occupancy maintains around 29.0%
- Daily rates hold near $706
Low Season (January, February, March)
- Revenue drops to average $3,414 per month
- Occupancy decreases to average 20.0%
- Daily rates adjust to average $671
Seasonality Insights for Avalon
- The Airbnb seasonality in Avalon shows highly seasonal trends requiring careful strategy. While the sections above show seasonal averages, it's also insightful to look at the extremes:
- During the high season, the absolute peak month showcases Avalon's highest earning potential, with monthly revenues capable of climbing to $16,958, occupancy reaching a high of 67.9%, and ADRs peaking at $799.
- Conversely, the slowest single month of the year, typically falling within the low season, marks the market's lowest point. In this month, revenue might dip to $3,143, occupancy could drop to 15.0%, and ADRs may adjust down to $644.
- Understanding both the seasonal averages and these monthly peaks and troughs in revenue, occupancy, and ADR is crucial for maximizing your Airbnb profit potential in Avalon.
Seasonal Strategies for Maximizing Profit
- Peak Season: Maximize revenue through premium pricing and potentially longer minimum stays. Ensure high availability.
- Low Season: Offer competitive pricing, special promotions (e.g., extended stay discounts), and flexible cancellation policies. Target off-season travelers like remote workers or budget-conscious guests.
- Shoulder Seasons: Implement dynamic pricing that balances peak and low rates. Target weekend travelers or specific events. Offer slightly more flexible terms than peak season.
- Regularly analyze your own performance against these Avalon seasonality benchmarks and adjust your pricing and availability strategy accordingly.
Best Areas for Airbnb Investment in Avalon (2026)
Exploring the top neighborhoods for short-term rentals in Avalon? This section highlights key areas, outlining why they are attractive for hosts and guests, along with notable local attractions. Consider these locations based on your target guest profile and investment strategy.
| Neighborhood / Area | Why Host Here? (Target Guests & Appeal) | Key Attractions & Landmarks |
|---|---|---|
| Avalon Beach | A picturesque beach destination known for its family-friendly atmosphere and charming coastal beauty. Ideal for tourists looking for a relaxing beach getaway with plenty of outdoor activities. | Avalon Beach, Avalon Fishing Pier, Surfing, Kayaking, Dining at local seafood restaurants, Avalon History Center |
| Stone Harbor | Adjacent to Avalon, this quaint coastal town is known for its small shops and beautiful beaches. Popular with families and offers a more relaxed vibe. | Stone Harbor Beach, Wetlands Institute, Shopping at local boutiques, Dining options, Wildlife viewing opportunities |
| Seven Mile Island | Encompasses both Avalon and Stone Harbor, renowned for its beautiful beaches and upscale homes. A prime investment location for vacation rentals. | Avalon and Stone Harbor Beaches, Biking along the island, Beach clubs and social events, Marinas and boat rentals |
| The Avalon Links | A beautiful golf course area that attracts golfers and vacationers seeking a golfing experience combined with beach access. Ideal for sports enthusiasts. | Avalon Golf Club, Nearby beaches, Dining and events at the club, Tennis courts |
| Avalon Downtown | The vibrant downtown area with shops and eateries that cater to tourists and locals alike. A great place for short-term rentals. | Local shops and boutiques, Restaurants and cafes, Ice cream parlors, Events and festivals |
| National Wildlife Refuge | Offers nature enthusiasts the chance to explore the natural beauty of the area. Draws visitors interested in eco-tourism and outdoor activities. | Fishing, Birdwatching, Hiking trails, Photography opportunities |
| Historic District | Avalon’s historic district features charming architecture and a unique character that attracts visitors interested in local history and culture. | Historic homes, Museums, Cultural events, Guided tours |
| Cape May County Zoo | Located nearby, it’s a popular family attraction and draws a crowd that could benefit from short-term rentals during visits. | Cape May County Zoo, Picnic areas, Playgrounds, Educational programs |
Understanding Airbnb License Requirements & STR Laws in Avalon (2026)
While Avalon, New Jersey, United States currently shows low STR regulations, specific Airbnb license requirements might still exist or change. Always verify the latest short term rental regulations and Airbnb license requirements directly with local government authorities for Avalon to ensure full compliance before hosting.
(Source: AirROI data, 2026, finding no licensed listings among those analyzed)
Top Performing Airbnb Properties in Avalon (2026)
Benchmark your potential! Explore examples of top-performing Airbnb properties in Avalonbased on Trailing Twelve Month (TTM) revenue. Analyze their characteristics, revenue, occupancy rate, and ADR to understand what drives success in this market.

Avalon 5BR- enjoy a cozy winter getaway!
Entire Place • 5 bedrooms
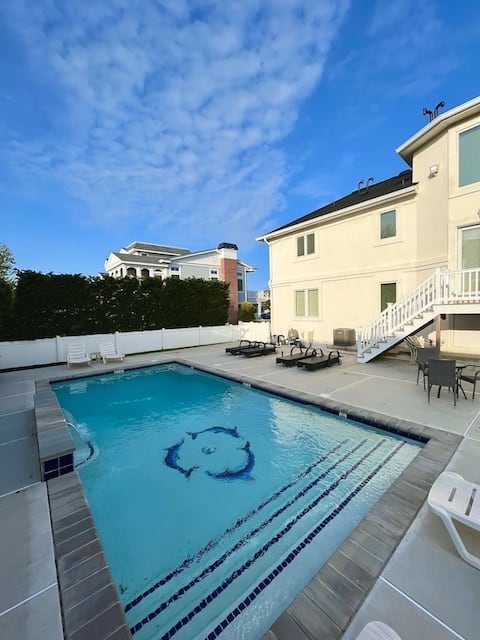
Beach Block Home & Private Pool for 14
Entire Place • 5 bedrooms

SeaLaVie in the heart of Avalon
Entire Place • 5 bedrooms
Luxury Home with Heated Pool, elevator & Steps to
Entire Place • 6 bedrooms

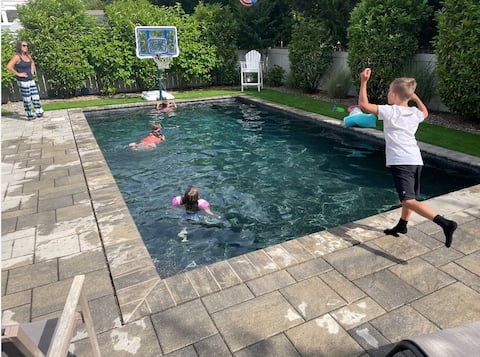
Spacious Custom Home: Beach, Pool and Tennis too!
Entire Place • 8 bedrooms
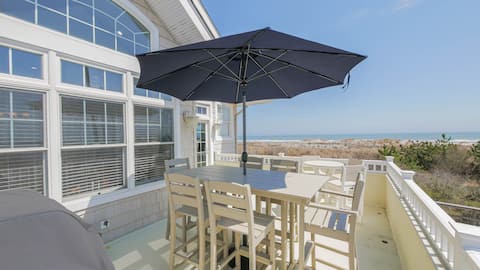
Avalon Oceanfront Perfect Views!
Entire Place • 4 bedrooms
Note: Performance varies based on location, size, amenities, seasonality, and management quality. Data reflects the past 12 months.
Top Performing Airbnb Hosts in Avalon (2026)
Learn from the best! This table showcases top-performing Airbnb hosts in Avalon based on the number of properties managed and estimated total revenue over the past year. Analyze their scale and performance metrics.
| Host Name | Properties | Grossing Revenue | Stay Reviews | Avg Rating |
|---|---|---|---|---|
| Carissa | 7 | $455,880 | 36 | 4.51/5.0 |
| Michael | 2 | $294,691 | 49 | 4.99/5.0 |
| Lauren | 1 | $261,990 | 16 | 5.00/5.0 |
| Nicole | 4 | $233,342 | 46 | 4.47/5.0 |
| Mara | 5 | $216,285 | 22 | 4.86/5.0 |
| Evolve | 2 | $177,504 | 37 | 4.99/5.0 |
| Michelle | 1 | $167,532 | 9 | 4.56/5.0 |
| Steven | 1 | $165,584 | 10 | 5.00/5.0 |
| Katie | 2 | $146,223 | 15 | 4.86/5.0 |
| Joseph | 1 | $116,742 | 16 | 5.00/5.0 |
Analyzing the strategies of top hosts, such as their property selection, pricing, and guest communication, can offer valuable lessons for optimizing your own Airbnb operations in Avalon.
Dive Deeper: Advanced Avalon STR Market Data (2026)
Ready to unlock more insights? AirROI provides access to advanced metrics and comprehensive Airbnb data for Avalon. Explore detailed analytics beyond this report to refine your investment strategy, optimize pricing, and maximize your vacation rental profits.
Explore Advanced MetricsAvalon Short-Term Rental Market Composition (2026): Property & Room Types
Room Type Distribution
Property Type Distribution
Market Composition Insights for Avalon
- The Avalon Airbnb market composition is heavily skewed towards Entire Home/Apt listings, which make up 90.5% of the 84 active rentals. This indicates strong guest preference for privacy and space.
- Looking at the property type distribution in Avalon, House properties are the most common (72.6%), reflecting the local real estate landscape.
- Houses represent a significant 72.6% portion, catering likely to families or larger groups.
- The presence of 8.3% Hotel/Boutique listings indicates integration with traditional hospitality.
- Smaller segments like others (combined 1.2%) offer potential for unique stay experiences.
Avalon Airbnb Room Capacity Analysis (2026): Bedroom Distribution
Distribution of Listings by Number of Bedrooms
Room Capacity Insights for Avalon
- The dominant room capacity in Avalon is 5+ bedrooms listings, making up 33.3% of the market. This suggests a strong demand for properties suitable for families or small groups.
- Together, 5+ bedrooms and 1 bedroom properties represent 53.5% of the active Airbnb listings in Avalon, indicating a high concentration in these sizes.
- A significant 71.3% of listings offer 3+ bedrooms, catering to larger groups and families seeking more space in Avalon.
Avalon Vacation Rental Guest Capacity Trends (2026)
Distribution of Listings by Guest Capacity
Guest Capacity Insights for Avalon
- The most common guest capacity trend in Avalon vacation rentals is listings accommodating 8+ guests (64.3%). This suggests the primary traveler segment is likely larger groups.
- Properties designed for 8+ guests and 6 guests dominate the Avalon STR market, accounting for 83.3% of listings.
- 84.5% of properties accommodate 6+ guests, serving the market segment for larger families or group travel in Avalon.
- On average, properties in Avalon are equipped to host 7.0 guests.
Avalon Airbnb Booking Patterns (2026): Available vs. Booked Days
Available Days Distribution
Booked Days Distribution
Booking Pattern Insights for Avalon
- The most common availability pattern in Avalon falls within the 271-366 days range, representing 61.9% of listings. This suggests many properties have significant open periods on their calendars.
- Approximately 94.0% of listings show high availability (181+ days open annually), indicating potential for increased bookings or specific owner usage patterns.
- For booked days, the 31-90 days range is most frequent in Avalon (40.5%), reflecting common guest stay durations or potential owner blocking patterns.
- A notable 6.0% of properties secure long booking periods (181+ days booked per year), highlighting successful long-term rental strategies or significant owner usage.
Avalon Airbnb Minimum Stay Requirements Analysis
Distribution of Listings by Minimum Night Requirement
1 Night
1 listings
1.2% of total
2 Nights
15 listings
17.9% of total
3 Nights
6 listings
7.1% of total
4-6 Nights
13 listings
15.5% of total
7-29 Nights
7 listings
8.3% of total
30+ Nights
42 listings
50% of total
Key Insights
- The most prevalent minimum stay requirement in Avalon is 30+ Nights, adopted by 50% of listings. This highlights the market's preference for longer commitments.
- Very short stays (1-2 nights) are less common (19.1%), suggesting hosts prefer slightly longer bookings to optimize turnover.
- A significant segment (50%) caters to monthly stays (30+ nights) in Avalon, pointing to opportunities in the extended-stay market.
Recommendations
- Align with the market by considering a 30+ Nights minimum stay, as 50% of Avalon hosts use this setting.
- If feasible, allowing 1-night stays, especially midweek or during low season, could capture last-minute bookings, as only 1.2% currently do.
- Explore offering discounts for stays of 30+ nights to attract the 50% of the market seeking extended stays.
- Adjust minimum nights based on seasonality – potentially shorter during low season and longer during peak demand periods in Avalon.
Avalon Airbnb Cancellation Policy Trends Analysis (2026)
Super Strict 60 Days
7 listings
8.3% of total
Flexible
6 listings
7.1% of total
Moderate
5 listings
6% of total
Firm
39 listings
46.4% of total
Strict
27 listings
32.1% of total
Cancellation Policy Insights for Avalon
- The prevailing Airbnb cancellation policy trend in Avalon is Firm, used by 46.4% of listings.
- A majority (78.5%) of hosts in Avalon utilize Firm or Strict policies, indicating a market where hosts prioritize booking security.
Recommendations for Hosts
- Consider adopting a Firm policy to align with the 46.4% market standard in Avalon.
- With 32.1% using Strict terms, this is a viable option in Avalon, particularly for high-value properties or during peak demand periods.
- Regularly review your cancellation policy against competitors and market demand shifts in Avalon.
Avalon STR Booking Lead Time Analysis (2026)
Average Booking Lead Time by Month
Booking Lead Time Insights for Avalon
- The overall average booking lead time for vacation rentals in Avalon is 86 days.
- Guests book furthest in advance for stays during August (average 130 days), likely coinciding with peak travel demand or local events.
- The shortest booking windows occur for stays in January (average 2 days), indicating more last-minute travel plans during this time.
- Seasonally, Summer (120 days avg.) sees the longest lead times, while Winter (20 days avg.) has the shortest, reflecting typical travel planning cycles.
Recommendations for Hosts
- Use the overall average lead time (86 days) as a baseline for your pricing and availability strategy in Avalon.
- For August stays, consider implementing length-of-stay discounts or slightly higher rates for bookings made less than 130 days out to capitalize on advance planning.
- During January, focus on last-minute booking availability and promotions, as guests book with very short notice (2 days avg.).
- Target marketing efforts for the Summer season well in advance (at least 120 days) to capture early planners.
- Monitor your own booking lead times against these Avalon averages to identify opportunities for dynamic pricing adjustments.
Popular & Essential Airbnb Amenities in Avalon (2026)
Amenity Prevalence
Amenity Insights for Avalon
- Essential amenities in Avalon that guests expect include: Smoke alarm, Wifi, Air conditioning, Fire extinguisher, TV, Kitchen. Lacking these (any) could significantly impact bookings.
- Popular amenities like Free parking on premises, Heating, Washer are common but not universal. Offering these can provide a competitive edge.
Recommendations for Hosts
- Ensure your listing includes all essential amenities for Avalon: Smoke alarm, Wifi, Air conditioning, Fire extinguisher, TV, Kitchen.
- Prioritize adding missing essentials: Fire extinguisher, TV, Kitchen.
- Consider adding popular differentiators like Free parking on premises or Heating to increase appeal.
- Highlight unique or less common amenities you offer (e.g., hot tub, dedicated workspace, EV charger) in your listing description and photos.
- Regularly check competitor amenities in Avalon to stay competitive.
Avalon Airbnb Guest Demographics & Profile Analysis (2026)
Guest Profile Summary for Avalon
- The typical guest profile for Airbnb in Avalon consists of primarily domestic travelers (97%), often arriving from nearby Philadelphia, typically belonging to the Post-2000s (Gen Z/Alpha) group (50%), primarily speaking English or Spanish.
- Domestic travelers account for 97.3% of guests.
- Key international markets include United States (97.3%) and DC (1.3%).
- Top languages spoken are English (76.1%) followed by Spanish (9.4%).
- A significant demographic segment is the Post-2000s (Gen Z/Alpha) group, representing 50% of guests.
Recommendations for Hosts
- Target domestic marketing efforts towards travelers from Philadelphia and New York.
- Tailor amenities and listing descriptions to appeal to the dominant Post-2000s (Gen Z/Alpha) demographic (e.g., highlight fast WiFi, smart home features, local guides).
- Highlight unique local experiences or amenities relevant to the primary guest profile.
- Consider seasonal promotions aligned with peak travel times for key origin markets.
Nearby Short-Term Rental Market Comparison
How does the Avalon Airbnb market stack up against its neighbors? Compare key performance metrics like average monthly revenue, ADR, and occupancy rates in surrounding areas to understand the broader regional STR landscape.
| Market | Active Properties | Monthly Revenue | Daily Rate | Avg. Occupancy |
|---|---|---|---|---|
| Spring Lake Heights | 16 | $5,785 | $725.20 | 40% |
| Hilltown Township | 11 | $5,557 | $578.96 | 40% |
| Cape May Point | 23 | $5,479 | $542.19 | 46% |
| Stone Harbor | 42 | $5,467 | $785.22 | 39% |
| Neptune City | 12 | $5,299 | $531.14 | 45% |
| Monmouth Beach | 12 | $5,209 | $794.91 | 38% |
| Cape May | 334 | $5,029 | $553.79 | 42% |
| Surf City | 47 | $5,004 | $715.29 | 44% |
| Lambertville | 54 | $4,849 | $359.53 | 50% |
| Ship Bottom | 64 | $4,794 | $534.91 | 41% |