Woodstock Airbnb Market Analysis 2026: Short Term Rental Data & Vacation Rental Statistics in New Hampshire, United States
Is Airbnb profitable in Woodstock in 2026? Explore comprehensive Airbnb analytics for Woodstock, New Hampshire, United States to uncover income potential. This 2026 STR market report for Woodstock, based on AirROI data from February 2025 to January 2026, reveals key trends in the market of 224 active listings.
Whether you're considering an Airbnb investment in Woodstock, optimizing your existing vacation rental, or exploring rental arbitrage opportunities, understanding the Woodstock Airbnb data is crucial. Leveraging the low regulation environment is key to maximizing your short term rental income potential. Let's dive into the specifics.
Key Woodstock Airbnb Performance Metrics Overview
Monthly Airbnb Revenue Variations & Income Potential in Woodstock (2026)
Understanding the monthly revenue variations for Airbnb listings in Woodstock is key to maximizing your short term rental income potential. Seasonality significantly impacts earnings. Our analysis, based on data from the past 12 months, shows that the peak revenue month for STRs in Woodstock is typically August, while April often presents the lowest earnings, highlighting opportunities for strategic pricing adjustments during shoulder and low seasons. Explore the typical Airbnb income in Woodstock across different performance tiers:
- Best-in-class properties (Top 10%) achieve $7,437+ monthly, often utilizing dynamic pricing and superior guest experiences.
- Strong performing properties (Top 25%) earn $4,974 or more, indicating effective management and desirable locations/amenities.
- Typical properties (Median) generate around $3,206 per month, representing the average market performance.
- Entry-level properties (Bottom 25%) see earnings around $1,634, often with potential for optimization.
Average Monthly Airbnb Earnings Trend in Woodstock
Woodstock Airbnb Occupancy Rate Trends (2026)
Maximize your bookings by understanding the Woodstock STR occupancy trends. Seasonal demand shifts significantly influence how often properties are booked. Typically, Februarysees the highest demand (peak season occupancy), while May experiences the lowest (low season). Effective strategies, like adjusting minimum stays or offering promotions, can boost occupancy during slower periods. Here's how different property tiers perform in Woodstock:
- Best-in-class properties (Top 10%) achieve 83%+ occupancy, indicating high desirability and potentially optimized availability.
- Strong performing properties (Top 25%) maintain 66% or higher occupancy, suggesting good market fit and guest satisfaction.
- Typical properties (Median) have an occupancy rate around 41%.
- Entry-level properties (Bottom 25%) average 22% occupancy, potentially facing higher vacancy.
Average Monthly Occupancy Rate Trend in Woodstock
Average Daily Rate (ADR) Airbnb Trends in Woodstock (2026)
Effective short term rental pricing strategy in Woodstock involves understanding monthly ADR fluctuations. The Average Daily Rate (ADR) for Airbnb in Woodstock typically peaks in October and dips lowest during April. Leveraging Airbnb dynamic pricing tools or strategies based on this seasonality can significantly boost revenue. Here's a look at the typical nightly rates achieved:
- Best-in-class properties (Top 10%) command rates of $447+ per night, often due to premium features or locations.
- Strong performing properties (Top 25%) achieve nightly rates of $321 or more.
- Typical properties (Median) charge around $242 per night.
- Entry-level properties (Bottom 25%) earn around $180 per night.
Average Daily Rate (ADR) Trend by Month in Woodstock
Get Live Woodstock Market Intelligence 👇

Explore Real-time Analytics
Airbnb Seasonality Analysis & Trends in Woodstock (2026)
Peak Season (August, July, February)
- Revenue averages $5,203 per month
- Occupancy rates average 55.2%
- Daily rates average $290
Shoulder Season
- Revenue averages $3,760 per month
- Occupancy maintains around 41.4%
- Daily rates hold near $289
Low Season (April, May, November)
- Revenue drops to average $2,773 per month
- Occupancy decreases to average 39.8%
- Daily rates adjust to average $262
Seasonality Insights for Woodstock
- The Airbnb seasonality in Woodstock shows highly seasonal trends requiring careful strategy. While the sections above show seasonal averages, it's also insightful to look at the extremes:
- During the high season, the absolute peak month showcases Woodstock's highest earning potential, with monthly revenues capable of climbing to $5,272, occupancy reaching a high of 58.9%, and ADRs peaking at $308.
- Conversely, the slowest single month of the year, typically falling within the low season, marks the market's lowest point. In this month, revenue might dip to $2,532, occupancy could drop to 37.1%, and ADRs may adjust down to $246.
- Understanding both the seasonal averages and these monthly peaks and troughs in revenue, occupancy, and ADR is crucial for maximizing your Airbnb profit potential in Woodstock.
Seasonal Strategies for Maximizing Profit
- Peak Season: Maximize revenue through premium pricing and potentially longer minimum stays. Ensure high availability.
- Low Season: Offer competitive pricing, special promotions (e.g., extended stay discounts), and flexible cancellation policies. Target off-season travelers like remote workers or budget-conscious guests.
- Shoulder Seasons: Implement dynamic pricing that balances peak and low rates. Target weekend travelers or specific events. Offer slightly more flexible terms than peak season.
- Regularly analyze your own performance against these Woodstock seasonality benchmarks and adjust your pricing and availability strategy accordingly.
Best Areas for Airbnb Investment in Woodstock (2026)
Exploring the top neighborhoods for short-term rentals in Woodstock? This section highlights key areas, outlining why they are attractive for hosts and guests, along with notable local attractions. Consider these locations based on your target guest profile and investment strategy.
| Neighborhood / Area | Why Host Here? (Target Guests & Appeal) | Key Attractions & Landmarks |
|---|---|---|
| White Mountain National Forest | A stunning natural park that attracts outdoor enthusiasts year-round with activities like hiking, skiing, and camping. Ideal for guests seeking nature and adventure. | Mount Washington, Franconia Notch State Park, Crawford Notch, Kancamagus Highway, Echo Lake State Park |
| Lincoln | A neighboring town offering access to ski resorts and attractions like Loon Mountain. Popular for families and adventure seekers during all seasons. | Loon Mountain Resort, Clark's Trading Post, Kancamagus Scenic Byway, Whales Tale Waterpark, Beloit College |
| North Conway | Known for its adorable New England charm and outdoor activities. A hub for shoppers and those looking to explore the White Mountains. | Settlers Green Outlet Village, North Conway Village, Mount Cranmore, Diana's Baths, Story Land |
| Waterville Valley | A quaint village with a focus on skiing and recreation, making it perfect for winter sports enthusiasts as well as summer activities like mountain biking. | Waterville Valley Ski Area, Corcoran Pond, Waterville Valley Golf Course, The Valley Train, Wellington State Park |
| Plymouth | A college town with a vibrant community and close proximity to outdoor activities. Provides a lively atmosphere year-round. | Plymouth State University, Squam Lake, White Mountain National Forest, Rhodes Farm, Plymouth Farmer’s Market |
| Franconia | A small town steeped in history and natural beauty, offering access to scenic trails and views, great for relaxing getaways. | Franconia Notch State Park, Cannon Mountain, Fadden's General Store, Falling Waters Trail, Profile Lake |
| Sugar Hill | Known for its picturesque landscapes and views of the White Mountains. A perfect escape for those looking for tranquility and nature. | Bretton Woods, Sunset Hill, The Sugar Hill Sampler, The Flume Gorge, The Mount Washington Hotel |
| Jackson | A charming village known for its covered bridges and stunning scenery. Popular among couples for romantic getaways and outdoor recreation. | Jackson Falls, The Wentworth Hotel, Mount Washington Valley, Black Mountain Ski Area, J-Town Deli |
Understanding Airbnb License Requirements & STR Laws in Woodstock (2026)
While Woodstock, New Hampshire, United States currently shows low STR regulations, specific Airbnb license requirements might still exist or change. Always verify the latest short term rental regulations and Airbnb license requirements directly with local government authorities for Woodstock to ensure full compliance before hosting.
(Source: AirROI data, 2026, finding no licensed listings among those analyzed)
Top Performing Airbnb Properties in Woodstock (2026)
Benchmark your potential! Explore examples of top-performing Airbnb properties in Woodstockbased on Trailing Twelve Month (TTM) revenue. Analyze their characteristics, revenue, occupancy rate, and ADR to understand what drives success in this market.

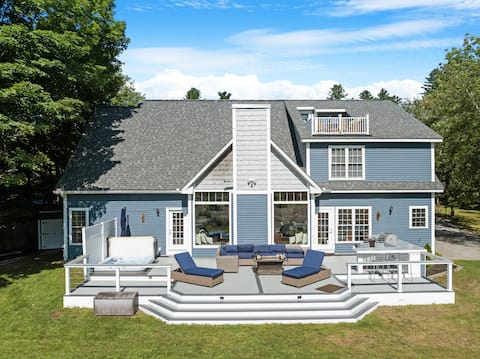
Ultimate 9 BD: Game Rm, Theater, Fire pits, River!
Entire Place • 9 bedrooms
Luxury Riverfront Retreat: Hot Tub, Game Room, Gym
Entire Place • 5 bedrooms

6 BR | EV Charger | No Pet Fee | Pool Table
Entire Place • 6 bedrooms
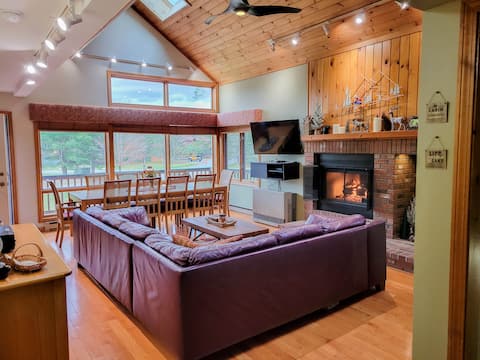
White Mountain Retreat/4 Bdrm/Breathtaking Views
Entire Place • 4 bedrooms
4 Bed 3.5 Bath Luxury Home at base of Loon
Entire Place • 4 bedrooms

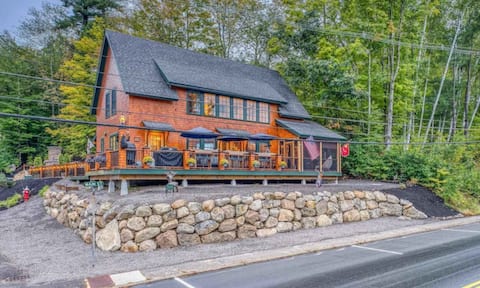
Cozy Lodge w/ Hot Tub: 15 min to Ice Castles, Loon
Entire Place • 6 bedrooms
Note: Performance varies based on location, size, amenities, seasonality, and management quality. Data reflects the past 12 months.
Top Performing Airbnb Hosts in Woodstock (2026)
Learn from the best! This table showcases top-performing Airbnb hosts in Woodstock based on the number of properties managed and estimated total revenue over the past year. Analyze their scale and performance metrics.
| Host Name | Properties | Grossing Revenue | Stay Reviews | Avg Rating |
|---|---|---|---|---|
| Lumen | 35 | $1,794,926 | 2182 | 4.89/5.0 |
| Jenna | 16 | $536,309 | 618 | 4.82/5.0 |
| Tory | 2 | $298,462 | 50 | 4.98/5.0 |
| Patrick | 1 | $232,377 | 21 | 4.76/5.0 |
| Keegan | 3 | $171,711 | 71 | 4.87/5.0 |
| Samuel | 1 | $146,056 | 65 | 4.91/5.0 |
| Deanna | 3 | $139,735 | 107 | 4.99/5.0 |
| Deanna | 1 | $133,487 | 55 | 4.95/5.0 |
| Evolve | 2 | $133,183 | 65 | 4.82/5.0 |
| Joseph | 1 | $108,108 | 39 | 5.00/5.0 |
Analyzing the strategies of top hosts, such as their property selection, pricing, and guest communication, can offer valuable lessons for optimizing your own Airbnb operations in Woodstock.
Dive Deeper: Advanced Woodstock STR Market Data (2026)
Ready to unlock more insights? AirROI provides access to advanced metrics and comprehensive Airbnb data for Woodstock. Explore detailed analytics beyond this report to refine your investment strategy, optimize pricing, and maximize your vacation rental profits.
Explore Advanced MetricsWoodstock Short-Term Rental Market Composition (2026): Property & Room Types
Room Type Distribution
Property Type Distribution
Market Composition Insights for Woodstock
- The Woodstock Airbnb market composition is heavily skewed towards Entire Home/Apt listings, which make up 96% of the 224 active rentals. This indicates strong guest preference for privacy and space.
- Looking at the property type distribution in Woodstock, House properties are the most common (44.2%), reflecting the local real estate landscape.
- Houses represent a significant 44.2% portion, catering likely to families or larger groups.
- Smaller segments like hotel/boutique, others, unique stays (combined 7.6%) offer potential for unique stay experiences.
Woodstock Airbnb Room Capacity Analysis (2026): Bedroom Distribution
Distribution of Listings by Number of Bedrooms
Room Capacity Insights for Woodstock
- The dominant room capacity in Woodstock is 3 bedrooms listings, making up 31.3% of the market. This suggests a strong demand for properties suitable for families or small groups.
- Together, 3 bedrooms and 1 bedroom properties represent 61.2% of the active Airbnb listings in Woodstock, indicating a high concentration in these sizes.
- A significant 48.7% of listings offer 3+ bedrooms, catering to larger groups and families seeking more space in Woodstock.
Woodstock Vacation Rental Guest Capacity Trends (2026)
Distribution of Listings by Guest Capacity
Guest Capacity Insights for Woodstock
- The most common guest capacity trend in Woodstock vacation rentals is listings accommodating 8+ guests (43.3%). This suggests the primary traveler segment is likely larger groups.
- Properties designed for 8+ guests and 4 guests dominate the Woodstock STR market, accounting for 60.7% of listings.
- 60.8% of properties accommodate 6+ guests, serving the market segment for larger families or group travel in Woodstock.
- On average, properties in Woodstock are equipped to host 5.7 guests.
Woodstock Airbnb Booking Patterns (2026): Available vs. Booked Days
Available Days Distribution
Booked Days Distribution
Booking Pattern Insights for Woodstock
- The most common availability pattern in Woodstock falls within the 271-366 days range, representing 42.4% of listings. This suggests many properties have significant open periods on their calendars.
- Approximately 78.1% of listings show high availability (181+ days open annually), indicating potential for increased bookings or specific owner usage patterns.
- For booked days, the 91-180 days range is most frequent in Woodstock (37.5%), reflecting common guest stay durations or potential owner blocking patterns.
- A notable 23.2% of properties secure long booking periods (181+ days booked per year), highlighting successful long-term rental strategies or significant owner usage.
Woodstock Airbnb Minimum Stay Requirements Analysis
Distribution of Listings by Minimum Night Requirement
1 Night
60 listings
26.8% of total
2 Nights
80 listings
35.7% of total
3 Nights
7 listings
3.1% of total
4-6 Nights
2 listings
0.9% of total
7-29 Nights
2 listings
0.9% of total
30+ Nights
73 listings
32.6% of total
Key Insights
- The most prevalent minimum stay requirement in Woodstock is 2 Nights, adopted by 35.7% of listings. This highlights the market's preference for shorter, flexible bookings.
- A strong majority (62.5%) of the Woodstock Airbnb data shows acceptance of very short stays (1-2 nights), indicating a dynamic, high-turnover market.
- A significant segment (32.6%) caters to monthly stays (30+ nights) in Woodstock, pointing to opportunities in the extended-stay market.
Recommendations
- Align with the market by considering a 2 Nights minimum stay, as 35.7% of Woodstock hosts use this setting.
- If feasible, allowing 1-night stays, especially midweek or during low season, could capture last-minute bookings, as only 26.8% currently do.
- Explore offering discounts for stays of 30+ nights to attract the 32.6% of the market seeking extended stays.
- Adjust minimum nights based on seasonality – potentially shorter during low season and longer during peak demand periods in Woodstock.
Woodstock Airbnb Cancellation Policy Trends Analysis (2026)
Limited
1 listings
0.4% of total
Super Strict 60 Days
1 listings
0.4% of total
Super Strict 30 Days
13 listings
5.8% of total
Flexible
31 listings
13.8% of total
Moderate
50 listings
22.3% of total
Firm
64 listings
28.6% of total
Strict
64 listings
28.6% of total
Cancellation Policy Insights for Woodstock
- The prevailing Airbnb cancellation policy trend in Woodstock is Firm, used by 28.6% of listings.
- A majority (57.2%) of hosts in Woodstock utilize Firm or Strict policies, indicating a market where hosts prioritize booking security.
Recommendations for Hosts
- Consider adopting a Firm policy to align with the 28.6% market standard in Woodstock.
- Regularly review your cancellation policy against competitors and market demand shifts in Woodstock.
Woodstock STR Booking Lead Time Analysis (2026)
Average Booking Lead Time by Month
Booking Lead Time Insights for Woodstock
- The overall average booking lead time for vacation rentals in Woodstock is 64 days.
- Guests book furthest in advance for stays during July (average 75 days), likely coinciding with peak travel demand or local events.
- The shortest booking windows occur for stays in December (average 55 days), indicating more last-minute travel plans during this time.
- Seasonally, Summer (70 days avg.) sees the longest lead times, while Winter (57 days avg.) has the shortest, reflecting typical travel planning cycles.
Recommendations for Hosts
- Use the overall average lead time (64 days) as a baseline for your pricing and availability strategy in Woodstock.
- For July stays, consider implementing length-of-stay discounts or slightly higher rates for bookings made less than 75 days out to capitalize on advance planning.
- Target marketing efforts for the Summer season well in advance (at least 70 days) to capture early planners.
- Monitor your own booking lead times against these Woodstock averages to identify opportunities for dynamic pricing adjustments.
Popular & Essential Airbnb Amenities in Woodstock (2026)
Amenity Prevalence
Amenity Insights for Woodstock
- Essential amenities in Woodstock that guests expect include: Wifi, Free parking on premises, Heating. Lacking these (any) could significantly impact bookings.
- Popular amenities like Smoke alarm, Hot water, Coffee maker are common but not universal. Offering these can provide a competitive edge.
Recommendations for Hosts
- Ensure your listing includes all essential amenities for Woodstock: Wifi, Free parking on premises, Heating.
- Prioritize adding missing essentials: Wifi, Free parking on premises, Heating.
- Consider adding popular differentiators like Smoke alarm or Hot water to increase appeal.
- Highlight unique or less common amenities you offer (e.g., hot tub, dedicated workspace, EV charger) in your listing description and photos.
- Regularly check competitor amenities in Woodstock to stay competitive.
Woodstock Airbnb Guest Demographics & Profile Analysis (2026)
Guest Profile Summary for Woodstock
- The typical guest profile for Airbnb in Woodstock consists of primarily domestic travelers (93%), often arriving from nearby Boston, typically belonging to the Post-2000s (Gen Z/Alpha) group (50%), primarily speaking English or Spanish.
- Domestic travelers account for 92.6% of guests.
- Key international markets include United States (92.6%) and Canada (1.4%).
- Top languages spoken are English (65.8%) followed by Spanish (11.5%).
- A significant demographic segment is the Post-2000s (Gen Z/Alpha) group, representing 50% of guests.
Recommendations for Hosts
- Target domestic marketing efforts towards travelers from Boston and New York.
- Tailor amenities and listing descriptions to appeal to the dominant Post-2000s (Gen Z/Alpha) demographic (e.g., highlight fast WiFi, smart home features, local guides).
- Highlight unique local experiences or amenities relevant to the primary guest profile.
- Consider seasonal promotions aligned with peak travel times for key origin markets.
Nearby Short-Term Rental Market Comparison
How does the Woodstock Airbnb market stack up against its neighbors? Compare key performance metrics like average monthly revenue, ADR, and occupancy rates in surrounding areas to understand the broader regional STR landscape.
| Market | Active Properties | Monthly Revenue | Daily Rate | Avg. Occupancy |
|---|---|---|---|---|
| Pomfret | 15 | $6,549 | $502.74 | 45% |
| Hanover | 33 | $5,826 | $1189.51 | 41% |
| South Berwick | 12 | $5,351 | $228.88 | 58% |
| Kennebunkport | 152 | $5,309 | $669.87 | 43% |
| Barnstead | 36 | $5,090 | $477.12 | 42% |
| Goffstown | 13 | $5,066 | $343.72 | 53% |
| Kennebunk | 228 | $4,794 | $523.86 | 45% |
| Jefferson | 28 | $4,793 | $474.72 | 40% |
| Falmouth | 63 | $4,691 | $450.26 | 51% |
| Wilmot | 11 | $4,667 | $334.67 | 51% |