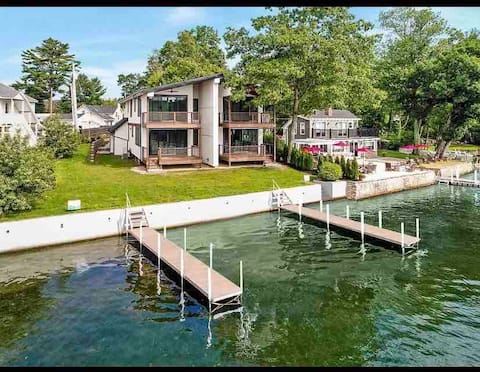
Tilton Airbnb Market Analysis 2026: Short Term Rental Data & Vacation Rental Statistics in New Hampshire, United States
Is Airbnb profitable in Tilton in 2026? Explore comprehensive Airbnb analytics for Tilton, New Hampshire, United States to uncover income potential. This 2026 STR market report for Tilton, based on AirROI data from February 2025 to January 2026, reveals key trends in the niche market of 52 active listings.
Whether you're considering an Airbnb investment in Tilton, optimizing your existing vacation rental, or exploring rental arbitrage opportunities, understanding the Tilton Airbnb data is crucial. Leveraging the low regulation environment is key to maximizing your short term rental income potential. Let's dive into the specifics.
Key Tilton Airbnb Performance Metrics Overview
Monthly Airbnb Revenue Variations & Income Potential in Tilton (2026)
Understanding the monthly revenue variations for Airbnb listings in Tilton is key to maximizing your short term rental income potential. Seasonality significantly impacts earnings. Our analysis, based on data from the past 12 months, shows that the peak revenue month for STRs in Tilton is typically July, while November often presents the lowest earnings, highlighting opportunities for strategic pricing adjustments during shoulder and low seasons. Explore the typical Airbnb income in Tilton across different performance tiers:
- Best-in-class properties (Top 10%) achieve $5,934+ monthly, often utilizing dynamic pricing and superior guest experiences.
- Strong performing properties (Top 25%) earn $3,893 or more, indicating effective management and desirable locations/amenities.
- Typical properties (Median) generate around $2,177 per month, representing the average market performance.
- Entry-level properties (Bottom 25%) see earnings around $1,179, often with potential for optimization.
Average Monthly Airbnb Earnings Trend in Tilton
Tilton Airbnb Occupancy Rate Trends (2026)
Maximize your bookings by understanding the Tilton STR occupancy trends. Seasonal demand shifts significantly influence how often properties are booked. Typically, Julysees the highest demand (peak season occupancy), while November experiences the lowest (low season). Effective strategies, like adjusting minimum stays or offering promotions, can boost occupancy during slower periods. Here's how different property tiers perform in Tilton:
- Best-in-class properties (Top 10%) achieve 72%+ occupancy, indicating high desirability and potentially optimized availability.
- Strong performing properties (Top 25%) maintain 53% or higher occupancy, suggesting good market fit and guest satisfaction.
- Typical properties (Median) have an occupancy rate around 30%.
- Entry-level properties (Bottom 25%) average 17% occupancy, potentially facing higher vacancy.
Average Monthly Occupancy Rate Trend in Tilton
Average Daily Rate (ADR) Airbnb Trends in Tilton (2026)
Effective short term rental pricing strategy in Tilton involves understanding monthly ADR fluctuations. The Average Daily Rate (ADR) for Airbnb in Tilton typically peaks in June and dips lowest during November. Leveraging Airbnb dynamic pricing tools or strategies based on this seasonality can significantly boost revenue. Here's a look at the typical nightly rates achieved:
- Best-in-class properties (Top 10%) command rates of $584+ per night, often due to premium features or locations.
- Strong performing properties (Top 25%) achieve nightly rates of $325 or more.
- Typical properties (Median) charge around $210 per night.
- Entry-level properties (Bottom 25%) earn around $168 per night.
Average Daily Rate (ADR) Trend by Month in Tilton
Get Live Tilton Market Intelligence 👇

Explore Real-time Analytics
Airbnb Seasonality Analysis & Trends in Tilton (2026)
Peak Season (July, August, June)
- Revenue averages $5,080 per month
- Occupancy rates average 49.5%
- Daily rates average $318
Shoulder Season
- Revenue averages $2,701 per month
- Occupancy maintains around 35.1%
- Daily rates hold near $288
Low Season (January, November, December)
- Revenue drops to average $1,841 per month
- Occupancy decreases to average 28.1%
- Daily rates adjust to average $282
Seasonality Insights for Tilton
- The Airbnb seasonality in Tilton shows highly seasonal trends requiring careful strategy. While the sections above show seasonal averages, it's also insightful to look at the extremes:
- During the high season, the absolute peak month showcases Tilton's highest earning potential, with monthly revenues capable of climbing to $6,053, occupancy reaching a high of 55.4%, and ADRs peaking at $327.
- Conversely, the slowest single month of the year, typically falling within the low season, marks the market's lowest point. In this month, revenue might dip to $1,598, occupancy could drop to 23.6%, and ADRs may adjust down to $279.
- Understanding both the seasonal averages and these monthly peaks and troughs in revenue, occupancy, and ADR is crucial for maximizing your Airbnb profit potential in Tilton.
Seasonal Strategies for Maximizing Profit
- Peak Season: Maximize revenue through premium pricing and potentially longer minimum stays. Ensure high availability.
- Low Season: Offer competitive pricing, special promotions (e.g., extended stay discounts), and flexible cancellation policies. Target off-season travelers like remote workers or budget-conscious guests.
- Shoulder Seasons: Implement dynamic pricing that balances peak and low rates. Target weekend travelers or specific events. Offer slightly more flexible terms than peak season.
- Regularly analyze your own performance against these Tilton seasonality benchmarks and adjust your pricing and availability strategy accordingly.
Best Areas for Airbnb Investment in Tilton (2026)
Exploring the top neighborhoods for short-term rentals in Tilton? This section highlights key areas, outlining why they are attractive for hosts and guests, along with notable local attractions. Consider these locations based on your target guest profile and investment strategy.
| Neighborhood / Area | Why Host Here? (Target Guests & Appeal) | Key Attractions & Landmarks |
|---|---|---|
| Lake Winnipesaukee | The largest lake in New Hampshire offers stunning views and a plethora of water activities, making it an ideal destination for tourists looking for both relaxation and adventure. | Weirs Beach, Marge Piercy Park, Lake Winnipesaukee Scenic Railroad, Mount Major, Funspot, Stamp Act Fine Art Gallery |
| Gunstock Mountain Resort | A popular year-round destination for skiing in winter and hiking/mountain biking in summer. Ideal for those looking to enjoy outdoor adventures. | Gunstock Ski Resort, Gilford Village, Stone Gate Vineyard, Barnacle Bill's, Gunstock Mountain Resort Ziplining |
| Bristol | A charming small town on the shores of Newfound Lake, known for its beautiful beaches and family-friendly atmosphere, attracting families during the summer months. | Newfound Lake, Profile Falls, Venture Outdoor Education, Bristol Town Park, Kelly's Market, Bristol Historical Society |
| Meredith | This charming lakeside town features boutique shops, fine dining, and access to Lake Winnipesaukee, making it a favorite among vacationers. | Meredith Village, Lake Waukewan, Tobey Pond, Blue Water Farm, Winnipesaukee Scenic Railroad, Church Landing |
| Concord | The state capital with rich history and culture. A hub for travelers visiting government sites and nearby natural attractions. | New Hampshire State House, McAuliffe-Shepard Discovery Center, Christa McAuliffe Planetarium, Kimball-Jenkins Estate, Concord Museum |
| Franklin | A small and quaint town that serves as a gateway to the northern part of the Lakes Region. A great place for those seeking peace and nature. | Franklin Falls Dam, Sunnyside Park, Odell Park, Pine Hill Park, Franklin Historical Museum |
| Tilton | Home to the popular Tanger Outlets, this town draws shoppers as well as those looking to explore the surrounding beauty of Lakes Region. | Tanger Outlets Tilton, Silver Lake, Northfield Mountain, Tilton School, The Baking Room |
| Alton Bay | A peaceful lakeside destination that offers beautiful views and outdoor activities. Popular for weekend getaways from nearby urban centers. | Alton Bay Village, Mount Major Trail, Alton Town Beach, Dockside Grill, Winnipesaukee Pier |
Understanding Airbnb License Requirements & STR Laws in Tilton (2026)
While Tilton, New Hampshire, United States currently shows low STR regulations, specific Airbnb license requirements might still exist or change. Always verify the latest short term rental regulations and Airbnb license requirements directly with local government authorities for Tilton to ensure full compliance before hosting.
(Source: AirROI data, 2026, finding no licensed listings among those analyzed)
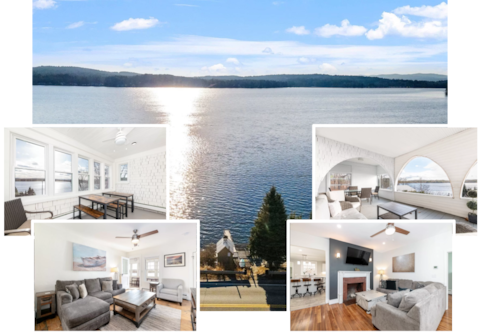
Top Performing Airbnb Properties in Tilton (2026)
Benchmark your potential! Explore examples of top-performing Airbnb properties in Tiltonbased on Trailing Twelve Month (TTM) revenue. Analyze their characteristics, revenue, occupancy rate, and ADR to understand what drives success in this market.

Pleasant Waters - Lakefront w/dock 3500sqft House
Entire Place • 4 bedrooms
Cheerful 4 bedroom, lake-front vacation home
Entire Place • 4 bedrooms
2-Unit House, big Lake Winnisquam views
Entire Place • 5 bedrooms
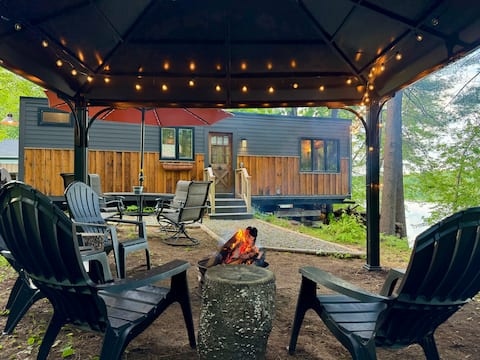
Tiny Pine Cabin Lakefront, Dock, Kayaks & Fire Pit
Entire Place • 1 bedroom

Timothy House
Entire Place • 4 bedrooms
Big Pine Cottage Lakefront, Dock, Kayaks & Firepit
Entire Place • 2 bedrooms
Note: Performance varies based on location, size, amenities, seasonality, and management quality. Data reflects the past 12 months.
Top Performing Airbnb Hosts in Tilton (2026)
Learn from the best! This table showcases top-performing Airbnb hosts in Tilton based on the number of properties managed and estimated total revenue over the past year. Analyze their scale and performance metrics.
| Host Name | Properties | Grossing Revenue | Stay Reviews | Avg Rating |
|---|---|---|---|---|
| Christine | 3 | $156,196 | 220 | 4.90/5.0 |
| Christopher | 1 | $141,845 | 19 | 5.00/5.0 |
| Alyssa | 2 | $100,476 | 163 | 4.99/5.0 |
| Tricia | 1 | $91,633 | 67 | 5.00/5.0 |
| Break Away | 3 | $78,237 | 8 | 4.00/5.0 |
| Rahna | 2 | $76,423 | 198 | 4.89/5.0 |
| Patricia | 8 | $63,153 | 29 | 4.90/5.0 |
| Cozy Homes | 3 | $62,015 | 16 | 4.96/5.0 |
| David | 1 | $54,699 | 505 | 4.93/5.0 |
| Jeffrey & Idena | 3 | $48,970 | 40 | 4.98/5.0 |
Analyzing the strategies of top hosts, such as their property selection, pricing, and guest communication, can offer valuable lessons for optimizing your own Airbnb operations in Tilton.
Dive Deeper: Advanced Tilton STR Market Data (2026)
Ready to unlock more insights? AirROI provides access to advanced metrics and comprehensive Airbnb data for Tilton. Explore detailed analytics beyond this report to refine your investment strategy, optimize pricing, and maximize your vacation rental profits.
Explore Advanced MetricsTilton Short-Term Rental Market Composition (2026): Property & Room Types
Room Type Distribution
Property Type Distribution
Market Composition Insights for Tilton
- The Tilton Airbnb market composition is heavily skewed towards Entire Home/Apt listings, which make up 84.6% of the 52 active rentals. This indicates strong guest preference for privacy and space.
- Looking at the property type distribution in Tilton, Apartment/Condo properties are the most common (40.4%), reflecting the local real estate landscape.
- Houses represent a significant 34.6% portion, catering likely to families or larger groups.
- The presence of 15.4% Hotel/Boutique listings indicates integration with traditional hospitality.
- Smaller segments like others (combined 3.8%) offer potential for unique stay experiences.
Tilton Airbnb Room Capacity Analysis (2026): Bedroom Distribution
Distribution of Listings by Number of Bedrooms
Room Capacity Insights for Tilton
- The dominant room capacity in Tilton is 2 bedrooms listings, making up 21.2% of the market. This suggests a strong demand for properties suitable for couples or solo travelers.
- Together, 2 bedrooms and 1 bedroom properties represent 42.4% of the active Airbnb listings in Tilton, indicating a high concentration in these sizes.
- A significant 32.7% of listings offer 3+ bedrooms, catering to larger groups and families seeking more space in Tilton.
Tilton Vacation Rental Guest Capacity Trends (2026)
Distribution of Listings by Guest Capacity
Guest Capacity Insights for Tilton
- The most common guest capacity trend in Tilton vacation rentals is listings accommodating 8+ guests (23.1%). This suggests the primary traveler segment is likely larger groups.
- Properties designed for 8+ guests and 2 guests dominate the Tilton STR market, accounting for 44.3% of listings.
- 36.6% of properties accommodate 6+ guests, serving the market segment for larger families or group travel in Tilton.
- On average, properties in Tilton are equipped to host 4.3 guests.
Tilton Airbnb Booking Patterns (2026): Available vs. Booked Days
Available Days Distribution
Booked Days Distribution
Booking Pattern Insights for Tilton
- The most common availability pattern in Tilton falls within the 271-366 days range, representing 59.6% of listings. This suggests many properties have significant open periods on their calendars.
- Approximately 92.3% of listings show high availability (181+ days open annually), indicating potential for increased bookings or specific owner usage patterns.
- For booked days, the 31-90 days range is most frequent in Tilton (38.5%), reflecting common guest stay durations or potential owner blocking patterns.
- A notable 7.7% of properties secure long booking periods (181+ days booked per year), highlighting successful long-term rental strategies or significant owner usage.
Tilton Airbnb Minimum Stay Requirements Analysis
Distribution of Listings by Minimum Night Requirement
1 Night
13 listings
25% of total
2 Nights
10 listings
19.2% of total
3 Nights
3 listings
5.8% of total
4-6 Nights
7 listings
13.5% of total
7-29 Nights
1 listings
1.9% of total
30+ Nights
18 listings
34.6% of total
Key Insights
- The most prevalent minimum stay requirement in Tilton is 30+ Nights, adopted by 34.6% of listings. This highlights the market's preference for longer commitments.
- A significant segment (34.6%) caters to monthly stays (30+ nights) in Tilton, pointing to opportunities in the extended-stay market.
Recommendations
- Align with the market by considering a 30+ Nights minimum stay, as 34.6% of Tilton hosts use this setting.
- If feasible, allowing 1-night stays, especially midweek or during low season, could capture last-minute bookings, as only 25% currently do.
- Explore offering discounts for stays of 30+ nights to attract the 34.6% of the market seeking extended stays.
- Adjust minimum nights based on seasonality – potentially shorter during low season and longer during peak demand periods in Tilton.
Tilton Airbnb Cancellation Policy Trends Analysis (2026)
Super Strict 60 Days
3 listings
5.8% of total
Super Strict 30 Days
1 listings
1.9% of total
Flexible
6 listings
11.5% of total
Moderate
10 listings
19.2% of total
Firm
27 listings
51.9% of total
Strict
5 listings
9.6% of total
Cancellation Policy Insights for Tilton
- The prevailing Airbnb cancellation policy trend in Tilton is Firm, used by 51.9% of listings.
- A majority (61.5%) of hosts in Tilton utilize Firm or Strict policies, indicating a market where hosts prioritize booking security.
- Strict cancellation policies are quite rare (9.6%), potentially making listings with this policy less competitive unless justified by high demand or property type.
Recommendations for Hosts
- Consider adopting a Firm policy to align with the 51.9% market standard in Tilton.
- Using a Strict policy might deter some guests, as only 9.6% of listings use it. Evaluate if potential revenue protection outweighs possible lower booking rates.
- Regularly review your cancellation policy against competitors and market demand shifts in Tilton.
Tilton STR Booking Lead Time Analysis (2026)
Average Booking Lead Time by Month
Booking Lead Time Insights for Tilton
- The overall average booking lead time for vacation rentals in Tilton is 65 days.
- Guests book furthest in advance for stays during September (average 105 days), likely coinciding with peak travel demand or local events.
- The shortest booking windows occur for stays in March (average 16 days), indicating more last-minute travel plans during this time.
- Seasonally, Fall (79 days avg.) sees the longest lead times, while Winter (32 days avg.) has the shortest, reflecting typical travel planning cycles.
Recommendations for Hosts
- Use the overall average lead time (65 days) as a baseline for your pricing and availability strategy in Tilton.
- For September stays, consider implementing length-of-stay discounts or slightly higher rates for bookings made less than 105 days out to capitalize on advance planning.
- Target marketing efforts for the Fall season well in advance (at least 79 days) to capture early planners.
- Monitor your own booking lead times against these Tilton averages to identify opportunities for dynamic pricing adjustments.
Popular & Essential Airbnb Amenities in Tilton (2026)
Amenity Prevalence
Amenity Insights for Tilton
- Essential amenities in Tilton that guests expect include: Wifi, Smoke alarm, Free parking on premises, TV, Hot water, Air conditioning. Lacking these (any) could significantly impact bookings.
- Popular amenities like Heating, Carbon monoxide alarm, Hair dryer are common but not universal. Offering these can provide a competitive edge.
Recommendations for Hosts
- Ensure your listing includes all essential amenities for Tilton: Wifi, Smoke alarm, Free parking on premises, TV, Hot water, Air conditioning.
- Prioritize adding missing essentials: Hot water, Air conditioning.
- Consider adding popular differentiators like Heating or Carbon monoxide alarm to increase appeal.
- Highlight unique or less common amenities you offer (e.g., hot tub, dedicated workspace, EV charger) in your listing description and photos.
- Regularly check competitor amenities in Tilton to stay competitive.
Tilton Airbnb Guest Demographics & Profile Analysis (2026)
Guest Profile Summary for Tilton
- The typical guest profile for Airbnb in Tilton consists of primarily domestic travelers (95%), often arriving from nearby Boston, typically belonging to the Post-2000s (Gen Z/Alpha) group (50%), primarily speaking English or Spanish.
- Domestic travelers account for 94.8% of guests.
- Key international markets include United States (94.8%) and Canada (2.2%).
- Top languages spoken are English (72.4%) followed by Spanish (7.1%).
- A significant demographic segment is the Post-2000s (Gen Z/Alpha) group, representing 50% of guests.
Recommendations for Hosts
- Target domestic marketing efforts towards travelers from Boston and New York.
- Tailor amenities and listing descriptions to appeal to the dominant Post-2000s (Gen Z/Alpha) demographic (e.g., highlight fast WiFi, smart home features, local guides).
- Highlight unique local experiences or amenities relevant to the primary guest profile.
- Consider seasonal promotions aligned with peak travel times for key origin markets.
Nearby Short-Term Rental Market Comparison
How does the Tilton Airbnb market stack up against its neighbors? Compare key performance metrics like average monthly revenue, ADR, and occupancy rates in surrounding areas to understand the broader regional STR landscape.
| Market | Active Properties | Monthly Revenue | Daily Rate | Avg. Occupancy |
|---|---|---|---|---|
| Pomfret | 15 | $6,549 | $502.74 | 45% |
| Hanover | 33 | $5,826 | $1189.51 | 41% |
| North Andover | 12 | $5,625 | $440.84 | 45% |
| Nahant | 13 | $5,564 | $602.44 | 42% |
| South Berwick | 12 | $5,351 | $228.88 | 58% |
| Wellesley | 22 | $5,310 | $520.90 | 50% |
| Kennebunkport | 152 | $5,309 | $669.87 | 43% |
| Barnstead | 36 | $5,090 | $477.12 | 42% |
| Goffstown | 13 | $5,066 | $343.72 | 53% |
| Amherst | 10 | $5,003 | $366.01 | 44% |