Seabrook Airbnb Market Analysis 2026: Short Term Rental Data & Vacation Rental Statistics in New Hampshire, United States
Is Airbnb profitable in Seabrook in 2026? Explore comprehensive Airbnb analytics for Seabrook, New Hampshire, United States to uncover income potential. This 2026 STR market report for Seabrook, based on AirROI data from February 2025 to January 2026, reveals key trends in the niche market of 47 active listings.
Whether you're considering an Airbnb investment in Seabrook, optimizing your existing vacation rental, or exploring rental arbitrage opportunities, understanding the Seabrook Airbnb data is crucial. Leveraging the low regulation environment is key to maximizing your short term rental income potential. Let's dive into the specifics.
Key Seabrook Airbnb Performance Metrics Overview
Monthly Airbnb Revenue Variations & Income Potential in Seabrook (2026)
Understanding the monthly revenue variations for Airbnb listings in Seabrook is key to maximizing your short term rental income potential. Seasonality significantly impacts earnings. Our analysis, based on data from the past 12 months, shows that the peak revenue month for STRs in Seabrook is typically July, while January often presents the lowest earnings, highlighting opportunities for strategic pricing adjustments during shoulder and low seasons. Explore the typical Airbnb income in Seabrook across different performance tiers:
- Best-in-class properties (Top 10%) achieve $9,076+ monthly, often utilizing dynamic pricing and superior guest experiences.
- Strong performing properties (Top 25%) earn $5,919 or more, indicating effective management and desirable locations/amenities.
- Typical properties (Median) generate around $3,347 per month, representing the average market performance.
- Entry-level properties (Bottom 25%) see earnings around $1,777, often with potential for optimization.
Average Monthly Airbnb Earnings Trend in Seabrook
Seabrook Airbnb Occupancy Rate Trends (2026)
Maximize your bookings by understanding the Seabrook STR occupancy trends. Seasonal demand shifts significantly influence how often properties are booked. Typically, Augustsees the highest demand (peak season occupancy), while January experiences the lowest (low season). Effective strategies, like adjusting minimum stays or offering promotions, can boost occupancy during slower periods. Here's how different property tiers perform in Seabrook:
- Best-in-class properties (Top 10%) achieve 74%+ occupancy, indicating high desirability and potentially optimized availability.
- Strong performing properties (Top 25%) maintain 57% or higher occupancy, suggesting good market fit and guest satisfaction.
- Typical properties (Median) have an occupancy rate around 36%.
- Entry-level properties (Bottom 25%) average 19% occupancy, potentially facing higher vacancy.
Average Monthly Occupancy Rate Trend in Seabrook
Average Daily Rate (ADR) Airbnb Trends in Seabrook (2026)
Effective short term rental pricing strategy in Seabrook involves understanding monthly ADR fluctuations. The Average Daily Rate (ADR) for Airbnb in Seabrook typically peaks in August and dips lowest during March. Leveraging Airbnb dynamic pricing tools or strategies based on this seasonality can significantly boost revenue. Here's a look at the typical nightly rates achieved:
- Best-in-class properties (Top 10%) command rates of $594+ per night, often due to premium features or locations.
- Strong performing properties (Top 25%) achieve nightly rates of $401 or more.
- Typical properties (Median) charge around $322 per night.
- Entry-level properties (Bottom 25%) earn around $229 per night.
Average Daily Rate (ADR) Trend by Month in Seabrook
Get Live Seabrook Market Intelligence 👇

Explore Real-time Analytics
Airbnb Seasonality Analysis & Trends in Seabrook (2026)
Peak Season (July, August, June)
- Revenue averages $7,774 per month
- Occupancy rates average 58.8%
- Daily rates average $377
Shoulder Season
- Revenue averages $3,697 per month
- Occupancy maintains around 36.7%
- Daily rates hold near $349
Low Season (January, February, April)
- Revenue drops to average $2,101 per month
- Occupancy decreases to average 28.0%
- Daily rates adjust to average $321
Seasonality Insights for Seabrook
- The Airbnb seasonality in Seabrook shows highly seasonal trends requiring careful strategy. While the sections above show seasonal averages, it's also insightful to look at the extremes:
- During the high season, the absolute peak month showcases Seabrook's highest earning potential, with monthly revenues capable of climbing to $9,232, occupancy reaching a high of 65.8%, and ADRs peaking at $382.
- Conversely, the slowest single month of the year, typically falling within the low season, marks the market's lowest point. In this month, revenue might dip to $2,010, occupancy could drop to 19.6%, and ADRs may adjust down to $306.
- Understanding both the seasonal averages and these monthly peaks and troughs in revenue, occupancy, and ADR is crucial for maximizing your Airbnb profit potential in Seabrook.
Seasonal Strategies for Maximizing Profit
- Peak Season: Maximize revenue through premium pricing and potentially longer minimum stays. Ensure high availability.
- Low Season: Offer competitive pricing, special promotions (e.g., extended stay discounts), and flexible cancellation policies. Target off-season travelers like remote workers or budget-conscious guests.
- Shoulder Seasons: Implement dynamic pricing that balances peak and low rates. Target weekend travelers or specific events. Offer slightly more flexible terms than peak season.
- Regularly analyze your own performance against these Seabrook seasonality benchmarks and adjust your pricing and availability strategy accordingly.
Best Areas for Airbnb Investment in Seabrook (2026)
Exploring the top neighborhoods for short-term rentals in Seabrook? This section highlights key areas, outlining why they are attractive for hosts and guests, along with notable local attractions. Consider these locations based on your target guest profile and investment strategy.
| Neighborhood / Area | Why Host Here? (Target Guests & Appeal) | Key Attractions & Landmarks |
|---|---|---|
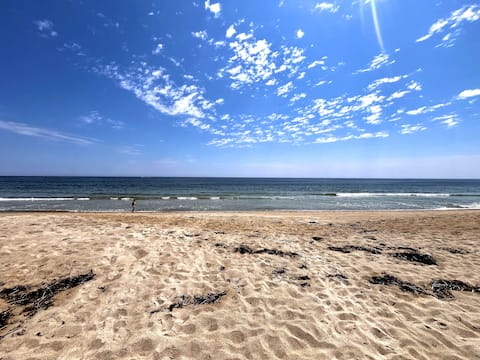
| Seabrook Beach | A popular destination for its sandy beaches and family-friendly atmosphere. Visitors can enjoy a variety of water activities and proximity to nearby attractions. | Seabrook Beach, Hampton Beach, Odiorne Point State Park, Water Country, Rye Harbor State Park, Massachusetts North Shore |
| Newburyport | Just a short drive from Seabrook, this charming town features historic architecture, unique shops, and close access to the Merrimack River, attracting visitors year-round. | Newburyport Harbor, Maudslay State Park, Plum Island, Custom House Maritime Museum, Tannery Marketplace, Newburyport Rail Trail |
| Hampton | Known for its vibrant beach scene, Hampton attracts visitors looking for lively nightlife and summer events, making it an excellent option for short-term rentals. | Hampton Beach, Hampton Beach State Park, Casino Ballroom, Seabrook NH State Park, The Ocean Gaming Casino, Beachfront Boardwalk |
| Rye | A serene coastal town with beautiful beaches and scenic views, Rye appeals to visitors looking for relaxation and nature, perfect for a quieter Airbnb experience. | Rye Harbor State Park, Wallis Sands State Beach, Odiorne Point State Park, The Appalachian Mountain Club, Explorica, Rye Town Forest |
| Cape Ann | A bit further south, Cape Ann offers picturesque coastal views and charming small towns like Rockport and Gloucester, attracting tourists interested in art and, seafood. | Rockport's Bearskin Neck, Cape Ann Museum, Good Harbor Beach, Gloucester Fishermen's Memorial, Annisquam Lighthouse, Halibut Point State Park |
| Portsmouth | Known for its historic sites, vibrant cultural scene, and great dining options, Portsmouth draws a diverse crowd looking for both relaxation and cultural experiences. | Strawbery Banke Museum, Portsmouth Harbor Lighthouse, Market Square, Prescott Park, Isles of Shoals, The Music Hall |
| Salem | Famous for its witch trials history, Salem attracts visitors for its cultural and historical festivals, making it a great option for Airbnb accommodations. | Salem Witch Museum, The House of the Seven Gables, Peabody Essex Museum, Salem Maritime National Historic Site, Salem Willows, Charming historic downtown |
| Kennebunkport | This picturesque village is known for its beautiful coast, charming shops, and family-friendly activities, making it an ideal location for Airbnb hosting. | Dock Square, Goose Rocks Beach, Walker’s Point, Cape Porpoise, Kennebunkport Historical Society, First Families Kennebunkport Museum |
Understanding Airbnb License Requirements & STR Laws in Seabrook (2026)
While Seabrook, New Hampshire, United States currently shows low STR regulations, specific Airbnb license requirements might still exist or change. Always verify the latest short term rental regulations and Airbnb license requirements directly with local government authorities for Seabrook to ensure full compliance before hosting.
(Source: AirROI data, 2026, finding no licensed listings among those analyzed)
Top Performing Airbnb Properties in Seabrook (2026)
Benchmark your potential! Explore examples of top-performing Airbnb properties in Seabrookbased on Trailing Twelve Month (TTM) revenue. Analyze their characteristics, revenue, occupancy rate, and ADR to understand what drives success in this market.
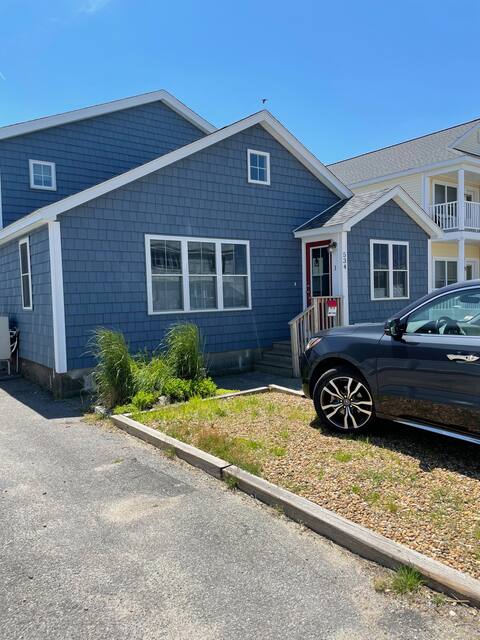
Seabrook Beach - 2 mins to path. 7+BR/4 Baths -AC
Entire Place • 8 bedrooms
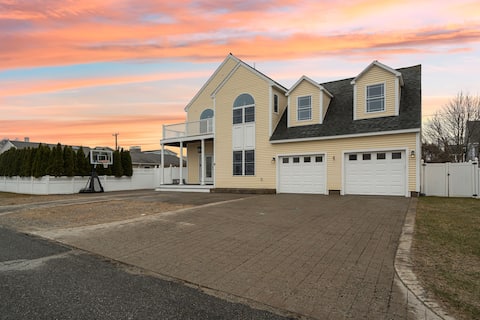
Sandy Toes | Ocean Views | Steps to Beach | Deck
Entire Place • 4 bedrooms
Newly Renovated Beach Bums' House *Sleeps 15*
Entire Place • 5 bedrooms

New stunning 3 bedroom condo with private patio !
Entire Place • 3 bedrooms

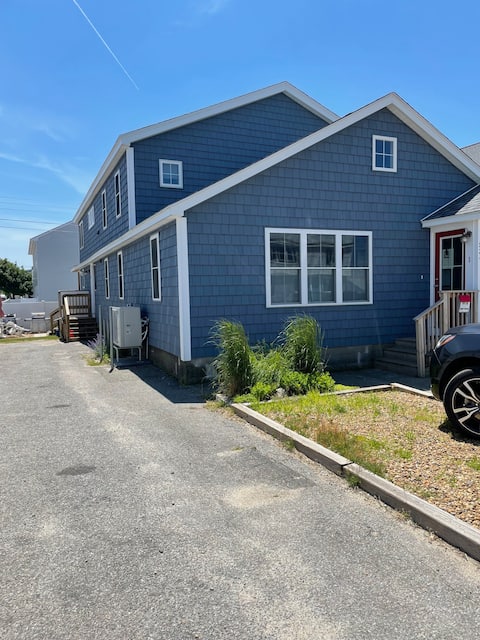
Bright, Spacious, Seabrook Beach Getaway
Entire Place • 4 bedrooms
Seabrook Beach - 2 min walk to path.4+BR 2Bth AC
Entire Place • 4 bedrooms
Note: Performance varies based on location, size, amenities, seasonality, and management quality. Data reflects the past 12 months.
Top Performing Airbnb Hosts in Seabrook (2026)
Learn from the best! This table showcases top-performing Airbnb hosts in Seabrook based on the number of properties managed and estimated total revenue over the past year. Analyze their scale and performance metrics.
| Host Name | Properties | Grossing Revenue | Stay Reviews | Avg Rating |
|---|---|---|---|---|
| Kristen | 3 | $247,063 | 202 | 4.82/5.0 |
| Coast To Creek | 5 | $185,255 | 150 | 4.90/5.0 |
| Justine | 2 | $154,377 | 134 | 4.83/5.0 |
| Sean | 1 | $105,032 | 44 | 4.91/5.0 |
| Lisa | 2 | $103,200 | 106 | 4.97/5.0 |
| Brian | 3 | $72,949 | 43 | 4.93/5.0 |
| Kelly | 1 | $68,909 | 21 | 5.00/5.0 |
| Marzeno | 1 | $66,357 | 17 | 4.88/5.0 |
| Deb And Joe | 1 | $65,475 | 11 | 5.00/5.0 |
| Justin | 1 | $50,431 | 20 | 4.95/5.0 |
Analyzing the strategies of top hosts, such as their property selection, pricing, and guest communication, can offer valuable lessons for optimizing your own Airbnb operations in Seabrook.
Dive Deeper: Advanced Seabrook STR Market Data (2026)
Ready to unlock more insights? AirROI provides access to advanced metrics and comprehensive Airbnb data for Seabrook. Explore detailed analytics beyond this report to refine your investment strategy, optimize pricing, and maximize your vacation rental profits.
Explore Advanced MetricsSeabrook Short-Term Rental Market Composition (2026): Property & Room Types
Room Type Distribution
Property Type Distribution
Market Composition Insights for Seabrook
- The Seabrook Airbnb market composition is heavily skewed towards Entire Home/Apt listings, which make up 97.9% of the 47 active rentals. This indicates strong guest preference for privacy and space.
- Looking at the property type distribution in Seabrook, Apartment/Condo properties are the most common (53.2%), reflecting the local real estate landscape.
- Houses represent a significant 44.7% portion, catering likely to families or larger groups.
- Smaller segments like outdoor/unique (combined 2.1%) offer potential for unique stay experiences.
Seabrook Airbnb Room Capacity Analysis (2026): Bedroom Distribution
Distribution of Listings by Number of Bedrooms
Room Capacity Insights for Seabrook
- The dominant room capacity in Seabrook is 2 bedrooms listings, making up 29.8% of the market. This suggests a strong demand for properties suitable for couples or solo travelers.
- Together, 2 bedrooms and 3 bedrooms properties represent 59.6% of the active Airbnb listings in Seabrook, indicating a high concentration in these sizes.
- A significant 49.0% of listings offer 3+ bedrooms, catering to larger groups and families seeking more space in Seabrook.
Seabrook Vacation Rental Guest Capacity Trends (2026)
Distribution of Listings by Guest Capacity
Guest Capacity Insights for Seabrook
- The most common guest capacity trend in Seabrook vacation rentals is listings accommodating 6 guests (29.8%). This suggests the primary traveler segment is likely larger groups.
- Properties designed for 6 guests and 8+ guests dominate the Seabrook STR market, accounting for 53.2% of listings.
- 63.8% of properties accommodate 6+ guests, serving the market segment for larger families or group travel in Seabrook.
- On average, properties in Seabrook are equipped to host 5.5 guests.
Seabrook Airbnb Booking Patterns (2026): Available vs. Booked Days
Available Days Distribution
Booked Days Distribution
Booking Pattern Insights for Seabrook
- The most common availability pattern in Seabrook falls within the 271-366 days range, representing 48.9% of listings. This suggests many properties have significant open periods on their calendars.
- Approximately 91.5% of listings show high availability (181+ days open annually), indicating potential for increased bookings or specific owner usage patterns.
- For booked days, the 91-180 days range is most frequent in Seabrook (40.4%), reflecting common guest stay durations or potential owner blocking patterns.
- A notable 10.6% of properties secure long booking periods (181+ days booked per year), highlighting successful long-term rental strategies or significant owner usage.
Seabrook Airbnb Minimum Stay Requirements Analysis
Distribution of Listings by Minimum Night Requirement
1 Night
8 listings
17% of total
2 Nights
7 listings
14.9% of total
3 Nights
2 listings
4.3% of total
4-6 Nights
7 listings
14.9% of total
7-29 Nights
5 listings
10.6% of total
30+ Nights
18 listings
38.3% of total
Key Insights
- The most prevalent minimum stay requirement in Seabrook is 30+ Nights, adopted by 38.3% of listings. This highlights the market's preference for longer commitments.
- A significant segment (38.3%) caters to monthly stays (30+ nights) in Seabrook, pointing to opportunities in the extended-stay market.
Recommendations
- Align with the market by considering a 30+ Nights minimum stay, as 38.3% of Seabrook hosts use this setting.
- If feasible, allowing 1-night stays, especially midweek or during low season, could capture last-minute bookings, as only 17% currently do.
- Explore offering discounts for stays of 30+ nights to attract the 38.3% of the market seeking extended stays.
- Adjust minimum nights based on seasonality – potentially shorter during low season and longer during peak demand periods in Seabrook.
Seabrook Airbnb Cancellation Policy Trends Analysis (2026)
Super Strict 30 Days
1 listings
2.1% of total
Flexible
7 listings
14.9% of total
Moderate
5 listings
10.6% of total
Firm
24 listings
51.1% of total
Strict
10 listings
21.3% of total
Cancellation Policy Insights for Seabrook
- The prevailing Airbnb cancellation policy trend in Seabrook is Firm, used by 51.1% of listings.
- A majority (72.4%) of hosts in Seabrook utilize Firm or Strict policies, indicating a market where hosts prioritize booking security.
Recommendations for Hosts
- Consider adopting a Firm policy to align with the 51.1% market standard in Seabrook.
- Regularly review your cancellation policy against competitors and market demand shifts in Seabrook.
Seabrook STR Booking Lead Time Analysis (2026)
Average Booking Lead Time by Month
Booking Lead Time Insights for Seabrook
- The overall average booking lead time for vacation rentals in Seabrook is 77 days.
- Guests book furthest in advance for stays during August (average 106 days), likely coinciding with peak travel demand or local events.
- The shortest booking windows occur for stays in February (average 23 days), indicating more last-minute travel plans during this time.
- Seasonally, Summer (98 days avg.) sees the longest lead times, while Winter (32 days avg.) has the shortest, reflecting typical travel planning cycles.
Recommendations for Hosts
- Use the overall average lead time (77 days) as a baseline for your pricing and availability strategy in Seabrook.
- For August stays, consider implementing length-of-stay discounts or slightly higher rates for bookings made less than 106 days out to capitalize on advance planning.
- Target marketing efforts for the Summer season well in advance (at least 98 days) to capture early planners.
- Monitor your own booking lead times against these Seabrook averages to identify opportunities for dynamic pricing adjustments.
Popular & Essential Airbnb Amenities in Seabrook (2026)
Amenity Prevalence
Amenity Insights for Seabrook
- Essential amenities in Seabrook that guests expect include: Heating, Free parking on premises, TV, Smoke alarm, Air conditioning, Wifi. Lacking these (any) could significantly impact bookings.
- Popular amenities like Dishes and silverware, Kitchen, Coffee maker are common but not universal. Offering these can provide a competitive edge.
Recommendations for Hosts
- Ensure your listing includes all essential amenities for Seabrook: Heating, Free parking on premises, TV, Smoke alarm, Air conditioning, Wifi.
- Prioritize adding missing essentials: Heating, Free parking on premises, TV, Smoke alarm, Air conditioning, Wifi.
- Consider adding popular differentiators like Dishes and silverware or Kitchen to increase appeal.
- Highlight unique or less common amenities you offer (e.g., hot tub, dedicated workspace, EV charger) in your listing description and photos.
- Regularly check competitor amenities in Seabrook to stay competitive.
Seabrook Airbnb Guest Demographics & Profile Analysis (2026)
Guest Profile Summary for Seabrook
- The typical guest profile for Airbnb in Seabrook consists of primarily domestic travelers (97%), often arriving from nearby Boston, typically belonging to the Post-2000s (Gen Z/Alpha) group (50%), primarily speaking English or Spanish.
- Domestic travelers account for 96.6% of guests.
- Key international markets include United States (96.6%) and Canada (1.4%).
- Top languages spoken are English (80.4%) followed by Spanish (11.8%).
- A significant demographic segment is the Post-2000s (Gen Z/Alpha) group, representing 50% of guests.
Recommendations for Hosts
- Target domestic marketing efforts towards travelers from Boston and New York.
- Tailor amenities and listing descriptions to appeal to the dominant Post-2000s (Gen Z/Alpha) demographic (e.g., highlight fast WiFi, smart home features, local guides).
- Highlight unique local experiences or amenities relevant to the primary guest profile.
- Consider seasonal promotions aligned with peak travel times for key origin markets.
Nearby Short-Term Rental Market Comparison
How does the Seabrook Airbnb market stack up against its neighbors? Compare key performance metrics like average monthly revenue, ADR, and occupancy rates in surrounding areas to understand the broader regional STR landscape.
| Market | Active Properties | Monthly Revenue | Daily Rate | Avg. Occupancy |
|---|---|---|---|---|
| Nantucket | 539 | $7,748 | $1045.40 | 41% |
| Middletown | 395 | $5,781 | $589.01 | 45% |
| North Andover | 12 | $5,625 | $440.84 | 45% |
| Nahant | 13 | $5,564 | $602.44 | 42% |
| New Shoreham | 120 | $5,359 | $637.79 | 45% |
| South Berwick | 12 | $5,351 | $228.88 | 58% |
| Wellesley | 22 | $5,310 | $520.90 | 50% |
| Kennebunkport | 152 | $5,309 | $669.87 | 43% |
| Edgartown | 255 | $5,250 | $818.21 | 40% |
| Mattapoisett | 34 | $5,105 | $476.61 | 52% |