Plymouth Airbnb Market Analysis 2026: Short Term Rental Data & Vacation Rental Statistics in New Hampshire, United States
Is Airbnb profitable in Plymouth in 2026? Explore comprehensive Airbnb analytics for Plymouth, New Hampshire, United States to uncover income potential. This 2026 STR market report for Plymouth, based on AirROI data from February 2025 to January 2026, reveals key trends in the niche market of 33 active listings.
Whether you're considering an Airbnb investment in Plymouth, optimizing your existing vacation rental, or exploring rental arbitrage opportunities, understanding the Plymouth Airbnb data is crucial. Leveraging the low regulation environment is key to maximizing your short term rental income potential. Let's dive into the specifics.
Key Plymouth Airbnb Performance Metrics Overview
Monthly Airbnb Revenue Variations & Income Potential in Plymouth (2026)
Understanding the monthly revenue variations for Airbnb listings in Plymouth is key to maximizing your short term rental income potential. Seasonality significantly impacts earnings. Our analysis, based on data from the past 12 months, shows that the peak revenue month for STRs in Plymouth is typically July, while November often presents the lowest earnings, highlighting opportunities for strategic pricing adjustments during shoulder and low seasons. Explore the typical Airbnb income in Plymouth across different performance tiers:
- Best-in-class properties (Top 10%) achieve $6,232+ monthly, often utilizing dynamic pricing and superior guest experiences.
- Strong performing properties (Top 25%) earn $4,273 or more, indicating effective management and desirable locations/amenities.
- Typical properties (Median) generate around $2,768 per month, representing the average market performance.
- Entry-level properties (Bottom 25%) see earnings around $1,473, often with potential for optimization.
Average Monthly Airbnb Earnings Trend in Plymouth
Plymouth Airbnb Occupancy Rate Trends (2026)
Maximize your bookings by understanding the Plymouth STR occupancy trends. Seasonal demand shifts significantly influence how often properties are booked. Typically, Octobersees the highest demand (peak season occupancy), while April experiences the lowest (low season). Effective strategies, like adjusting minimum stays or offering promotions, can boost occupancy during slower periods. Here's how different property tiers perform in Plymouth:
- Best-in-class properties (Top 10%) achieve 75%+ occupancy, indicating high desirability and potentially optimized availability.
- Strong performing properties (Top 25%) maintain 57% or higher occupancy, suggesting good market fit and guest satisfaction.
- Typical properties (Median) have an occupancy rate around 38%.
- Entry-level properties (Bottom 25%) average 21% occupancy, potentially facing higher vacancy.
Average Monthly Occupancy Rate Trend in Plymouth
Average Daily Rate (ADR) Airbnb Trends in Plymouth (2026)
Effective short term rental pricing strategy in Plymouth involves understanding monthly ADR fluctuations. The Average Daily Rate (ADR) for Airbnb in Plymouth typically peaks in October and dips lowest during April. Leveraging Airbnb dynamic pricing tools or strategies based on this seasonality can significantly boost revenue. Here's a look at the typical nightly rates achieved:
- Best-in-class properties (Top 10%) command rates of $383+ per night, often due to premium features or locations.
- Strong performing properties (Top 25%) achieve nightly rates of $298 or more.
- Typical properties (Median) charge around $221 per night.
- Entry-level properties (Bottom 25%) earn around $175 per night.
Average Daily Rate (ADR) Trend by Month in Plymouth
Get Live Plymouth Market Intelligence 👇

Explore Real-time Analytics
Airbnb Seasonality Analysis & Trends in Plymouth (2026)
Peak Season (July, August, October)
- Revenue averages $4,480 per month
- Occupancy rates average 52.0%
- Daily rates average $257
Shoulder Season
- Revenue averages $3,269 per month
- Occupancy maintains around 40.3%
- Daily rates hold near $245
Low Season (April, May, November)
- Revenue drops to average $2,617 per month
- Occupancy decreases to average 32.4%
- Daily rates adjust to average $243
Seasonality Insights for Plymouth
- The Airbnb seasonality in Plymouth shows moderate seasonality with distinct peak and low periods. While the sections above show seasonal averages, it's also insightful to look at the extremes:
- During the high season, the absolute peak month showcases Plymouth's highest earning potential, with monthly revenues capable of climbing to $4,622, occupancy reaching a high of 55.2%, and ADRs peaking at $258.
- Conversely, the slowest single month of the year, typically falling within the low season, marks the market's lowest point. In this month, revenue might dip to $2,408, occupancy could drop to 28.9%, and ADRs may adjust down to $236.
- Understanding both the seasonal averages and these monthly peaks and troughs in revenue, occupancy, and ADR is crucial for maximizing your Airbnb profit potential in Plymouth.
Seasonal Strategies for Maximizing Profit
- Peak Season: Maximize revenue through premium pricing and potentially longer minimum stays. Ensure high availability.
- Low Season: Offer competitive pricing, special promotions (e.g., extended stay discounts), and flexible cancellation policies. Target off-season travelers like remote workers or budget-conscious guests.
- Shoulder Seasons: Implement dynamic pricing that balances peak and low rates. Target weekend travelers or specific events. Offer slightly more flexible terms than peak season.
- Regularly analyze your own performance against these Plymouth seasonality benchmarks and adjust your pricing and availability strategy accordingly.
Best Areas for Airbnb Investment in Plymouth (2026)
Exploring the top neighborhoods for short-term rentals in Plymouth? This section highlights key areas, outlining why they are attractive for hosts and guests, along with notable local attractions. Consider these locations based on your target guest profile and investment strategy.
| Neighborhood / Area | Why Host Here? (Target Guests & Appeal) | Key Attractions & Landmarks |
|---|---|---|
| Plymouth Center | The downtown area is vibrant with shops, restaurants, and historical sites. It attracts tourists exploring the rich history of Plymouth and Lake Winnipesaukee. | Plymouth State University, Plymouth Historical Society, White Mountain National Forest, Pemigewasset River, Frost Place Museum |
| Lake Winnipesaukee | One of the largest lakes in New Hampshire, known for its recreational activities and stunning views. Ideal for summer vacationers and outdoor enthusiasts. | Winnipesaukee Scenic Railroad, Weirs Beach, Moultonborough Falls, Meredith Village, Alton Bay |
| Waterville Valley | A picturesque village famous for skiing and outdoor activities. A great destination for winter sports enthusiasts and summer hiking. | Waterville Valley Resort, Corcoran Pond, Sandwich Range, Valley Snow Dogz, Tioga River |
| Rumney | Close to the White Mountain National Forest, it offers outdoor adventure and is a popular spot for rock climbing and hiking. | Rumney Rocks, Squam Lake, Stinson Lake, Angela's Pizza, Plymouth State University |
| Holderness | Home to scenic views and a peaceful atmosphere, it's perfect for families looking for a getaway by the lake. | Squam Lake Natural Science Center, Pawtuckaway State Park, Holderness Historical Society, Loon Mountain, Plymouth State University |
| Bristol | A charming town by Newfound Lake, loved for its recreational activities and proximity to hiking trails and water sports. | Newfound Lake, Bristol Historical Society, Profile Falls, Paddleboarding and kayaking, The Mount Cardigan area |
| Ashland | A small town with access to both the Pemigewasset River and Squam Lake. Good for various outdoor activities and a quiet retreat. | Squam Lake, Pemigewasset Valley, Lakes Region, Breton Woods, Bald Mountain |
| Campton | Nestled in the White Mountains, Campton is ideal for those looking for a more secluded retreat with a strong local community focus. | Welton Falls, Campton Mountain, Lost River Gorge and Boulder Caves, The White Mountain National Forest, Loon Mountain Resort |
Understanding Airbnb License Requirements & STR Laws in Plymouth (2026)
While Plymouth, New Hampshire, United States currently shows low STR regulations, specific Airbnb license requirements might still exist or change. Always verify the latest short term rental regulations and Airbnb license requirements directly with local government authorities for Plymouth to ensure full compliance before hosting.
(Source: AirROI data, 2026, finding no licensed listings among those analyzed)
Top Performing Airbnb Properties in Plymouth (2026)
Benchmark your potential! Explore examples of top-performing Airbnb properties in Plymouthbased on Trailing Twelve Month (TTM) revenue. Analyze their characteristics, revenue, occupancy rate, and ADR to understand what drives success in this market.

Frontenac Lodge (former ski camp)
Private Room • 7 bedrooms
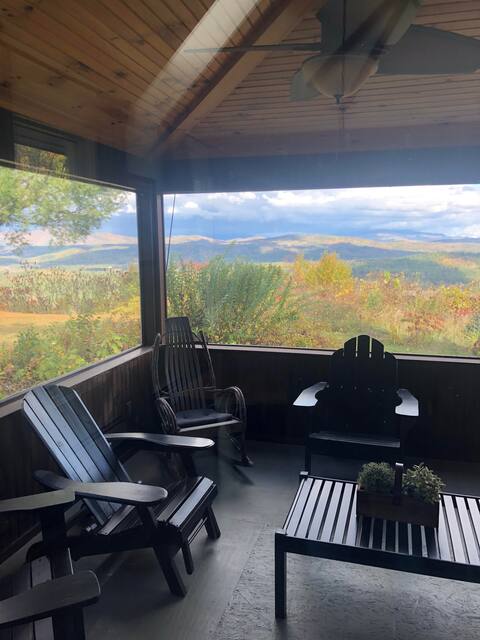
Mountain View House in NH White Mountains
Entire Place • 5 bedrooms
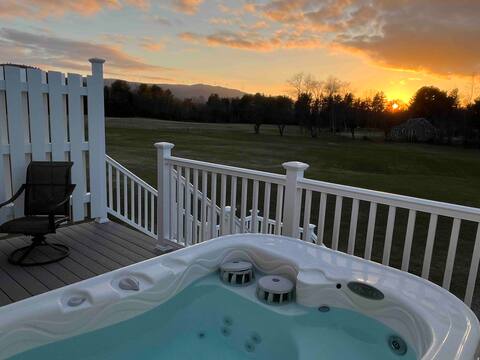
Hot Tub At Sunset View Farm (2 adults and 3 kids)
Entire Place • 2 bedrooms

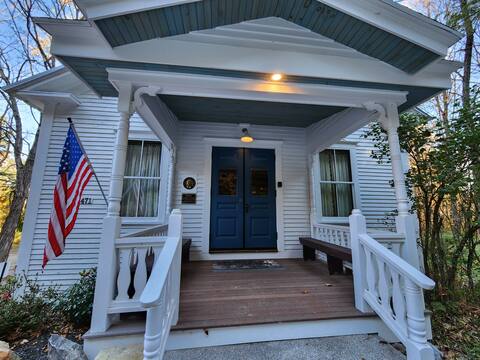
Tenney Mountain Retreat, Plymouth & Rumney, NH
Entire Place • 2 bedrooms

Tenney/Rumney Ski Townhouse, White Mountains, NH
Entire Place • 2 bedrooms
Lower Intervale Grange; Nat'l Register Hist. Site
Entire Place • 3 bedrooms
Note: Performance varies based on location, size, amenities, seasonality, and management quality. Data reflects the past 12 months.
Top Performing Airbnb Hosts in Plymouth (2026)
Learn from the best! This table showcases top-performing Airbnb hosts in Plymouth based on the number of properties managed and estimated total revenue over the past year. Analyze their scale and performance metrics.
| Host Name | Properties | Grossing Revenue | Stay Reviews | Avg Rating |
|---|---|---|---|---|
| Michael | 1 | $174,538 | 226 | 4.97/5.0 |
| Justin | 2 | $103,553 | 928 | 4.80/5.0 |
| Susan | 2 | $85,424 | 580 | 4.92/5.0 |
| Patricia | 1 | $61,485 | 42 | 5.00/5.0 |
| Dave And Amy | 1 | $61,310 | 163 | 4.94/5.0 |
| Jessica | 1 | $48,116 | 67 | 4.93/5.0 |
| Ryan Scott | 2 | $44,614 | 64 | 4.67/5.0 |
| Adrian | 1 | $43,298 | 301 | 4.95/5.0 |
| Dustin | 1 | $43,281 | 246 | 4.93/5.0 |
| Jennifer | 1 | $43,097 | 34 | 5.00/5.0 |
Analyzing the strategies of top hosts, such as their property selection, pricing, and guest communication, can offer valuable lessons for optimizing your own Airbnb operations in Plymouth.
Dive Deeper: Advanced Plymouth STR Market Data (2026)
Ready to unlock more insights? AirROI provides access to advanced metrics and comprehensive Airbnb data for Plymouth. Explore detailed analytics beyond this report to refine your investment strategy, optimize pricing, and maximize your vacation rental profits.
Explore Advanced MetricsPlymouth Short-Term Rental Market Composition (2026): Property & Room Types
Room Type Distribution
Property Type Distribution
Market Composition Insights for Plymouth
- The Plymouth Airbnb market composition is heavily skewed towards Entire Home/Apt listings, which make up 93.9% of the 33 active rentals. This indicates strong guest preference for privacy and space.
- Looking at the property type distribution in Plymouth, House properties are the most common (57.6%), reflecting the local real estate landscape.
- Houses represent a significant 57.6% portion, catering likely to families or larger groups.
- Smaller segments like hotel/boutique (combined 3.0%) offer potential for unique stay experiences.
Plymouth Airbnb Room Capacity Analysis (2026): Bedroom Distribution
Distribution of Listings by Number of Bedrooms
Room Capacity Insights for Plymouth
- The dominant room capacity in Plymouth is 3 bedrooms listings, making up 30.3% of the market. This suggests a strong demand for properties suitable for families or small groups.
- Together, 3 bedrooms and 2 bedrooms properties represent 60.6% of the active Airbnb listings in Plymouth, indicating a high concentration in these sizes.
- A significant 45.5% of listings offer 3+ bedrooms, catering to larger groups and families seeking more space in Plymouth.
Plymouth Vacation Rental Guest Capacity Trends (2026)
Distribution of Listings by Guest Capacity
Guest Capacity Insights for Plymouth
- The most common guest capacity trend in Plymouth vacation rentals is listings accommodating 8+ guests (27.3%). This suggests the primary traveler segment is likely larger groups.
- Properties designed for 8+ guests and 6 guests dominate the Plymouth STR market, accounting for 51.5% of listings.
- 60.6% of properties accommodate 6+ guests, serving the market segment for larger families or group travel in Plymouth.
- On average, properties in Plymouth are equipped to host 5.7 guests.
Plymouth Airbnb Booking Patterns (2026): Available vs. Booked Days
Available Days Distribution
Booked Days Distribution
Booking Pattern Insights for Plymouth
- The most common availability pattern in Plymouth falls within the 181-270 days range, representing 42.4% of listings. This suggests many properties have significant open periods on their calendars.
- Approximately 78.8% of listings show high availability (181+ days open annually), indicating potential for increased bookings or specific owner usage patterns.
- For booked days, the 91-180 days range is most frequent in Plymouth (33.3%), reflecting common guest stay durations or potential owner blocking patterns.
- A notable 30.3% of properties secure long booking periods (181+ days booked per year), highlighting successful long-term rental strategies or significant owner usage.
Plymouth Airbnb Minimum Stay Requirements Analysis
Distribution of Listings by Minimum Night Requirement
1 Night
9 listings
27.3% of total
2 Nights
14 listings
42.4% of total
3 Nights
1 listings
3% of total
30+ Nights
9 listings
27.3% of total
Key Insights
- The most prevalent minimum stay requirement in Plymouth is 2 Nights, adopted by 42.4% of listings. This highlights the market's preference for shorter, flexible bookings.
- A strong majority (69.7%) of the Plymouth Airbnb data shows acceptance of very short stays (1-2 nights), indicating a dynamic, high-turnover market.
- A significant segment (27.3%) caters to monthly stays (30+ nights) in Plymouth, pointing to opportunities in the extended-stay market.
Recommendations
- Align with the market by considering a 2 Nights minimum stay, as 42.4% of Plymouth hosts use this setting.
- If feasible, allowing 1-night stays, especially midweek or during low season, could capture last-minute bookings, as only 27.3% currently do.
- Explore offering discounts for stays of 30+ nights to attract the 27.3% of the market seeking extended stays.
- Adjust minimum nights based on seasonality – potentially shorter during low season and longer during peak demand periods in Plymouth.
Plymouth Airbnb Cancellation Policy Trends Analysis (2026)
Super Strict 30 Days
1 listings
3% of total
Flexible
3 listings
9.1% of total
Moderate
8 listings
24.2% of total
Firm
19 listings
57.6% of total
Strict
2 listings
6.1% of total
Cancellation Policy Insights for Plymouth
- The prevailing Airbnb cancellation policy trend in Plymouth is Firm, used by 57.6% of listings.
- A majority (63.7%) of hosts in Plymouth utilize Firm or Strict policies, indicating a market where hosts prioritize booking security.
- Strict cancellation policies are quite rare (6.1%), potentially making listings with this policy less competitive unless justified by high demand or property type.
Recommendations for Hosts
- Consider adopting a Firm policy to align with the 57.6% market standard in Plymouth.
- Using a Strict policy might deter some guests, as only 6.1% of listings use it. Evaluate if potential revenue protection outweighs possible lower booking rates.
- Regularly review your cancellation policy against competitors and market demand shifts in Plymouth.
Plymouth STR Booking Lead Time Analysis (2026)
Average Booking Lead Time by Month
Booking Lead Time Insights for Plymouth
- The overall average booking lead time for vacation rentals in Plymouth is 62 days.
- Guests book furthest in advance for stays during May (average 82 days), likely coinciding with peak travel demand or local events.
- The shortest booking windows occur for stays in November (average 32 days), indicating more last-minute travel plans during this time.
- Seasonally, Summer (62 days avg.) sees the longest lead times, while Winter (59 days avg.) has the shortest, reflecting typical travel planning cycles.
Recommendations for Hosts
- Use the overall average lead time (62 days) as a baseline for your pricing and availability strategy in Plymouth.
- For May stays, consider implementing length-of-stay discounts or slightly higher rates for bookings made less than 82 days out to capitalize on advance planning.
- Target marketing efforts for the Summer season well in advance (at least 62 days) to capture early planners.
- Monitor your own booking lead times against these Plymouth averages to identify opportunities for dynamic pricing adjustments.
Popular & Essential Airbnb Amenities in Plymouth (2026)
Amenity Prevalence
Amenity Insights for Plymouth
- Essential amenities in Plymouth that guests expect include: Carbon monoxide alarm, Free parking on premises, Smoke alarm, Wifi. Lacking these (any) could significantly impact bookings.
- Popular amenities like Heating, Fire extinguisher, Bed linens are common but not universal. Offering these can provide a competitive edge.
Recommendations for Hosts
- Ensure your listing includes all essential amenities for Plymouth: Carbon monoxide alarm, Free parking on premises, Smoke alarm, Wifi.
- Prioritize adding missing essentials: Free parking on premises, Smoke alarm, Wifi.
- Consider adding popular differentiators like Heating or Fire extinguisher to increase appeal.
- Highlight unique or less common amenities you offer (e.g., hot tub, dedicated workspace, EV charger) in your listing description and photos.
- Regularly check competitor amenities in Plymouth to stay competitive.
Plymouth Airbnb Guest Demographics & Profile Analysis (2026)
Guest Profile Summary for Plymouth
- The typical guest profile for Airbnb in Plymouth consists of primarily domestic travelers (96%), often arriving from nearby Boston, typically belonging to the Post-2000s (Gen Z/Alpha) group (50%), primarily speaking English or Spanish.
- Domestic travelers account for 95.5% of guests.
- Key international markets include United States (95.5%) and Canada (1.7%).
- Top languages spoken are English (69.8%) followed by Spanish (9.5%).
- A significant demographic segment is the Post-2000s (Gen Z/Alpha) group, representing 50% of guests.
Recommendations for Hosts
- Target domestic marketing efforts towards travelers from Boston and New York.
- Tailor amenities and listing descriptions to appeal to the dominant Post-2000s (Gen Z/Alpha) demographic (e.g., highlight fast WiFi, smart home features, local guides).
- Highlight unique local experiences or amenities relevant to the primary guest profile.
- Consider seasonal promotions aligned with peak travel times for key origin markets.
Nearby Short-Term Rental Market Comparison
How does the Plymouth Airbnb market stack up against its neighbors? Compare key performance metrics like average monthly revenue, ADR, and occupancy rates in surrounding areas to understand the broader regional STR landscape.
| Market | Active Properties | Monthly Revenue | Daily Rate | Avg. Occupancy |
|---|---|---|---|---|
| Pomfret | 15 | $6,549 | $502.74 | 45% |
| Hanover | 33 | $5,826 | $1189.51 | 41% |
| North Andover | 12 | $5,625 | $440.84 | 45% |
| Nahant | 13 | $5,564 | $602.44 | 42% |
| South Berwick | 12 | $5,351 | $228.88 | 58% |
| Wellesley | 22 | $5,310 | $520.90 | 50% |
| Kennebunkport | 152 | $5,309 | $669.87 | 43% |
| Barnstead | 36 | $5,090 | $477.12 | 42% |
| Goffstown | 13 | $5,066 | $343.72 | 53% |
| Amherst | 10 | $5,003 | $366.01 | 44% |