Newport Airbnb Market Analysis 2026: Short Term Rental Data & Vacation Rental Statistics in New Hampshire, United States
Is Airbnb profitable in Newport in 2026? Explore comprehensive Airbnb analytics for Newport, New Hampshire, United States to uncover income potential. This 2026 STR market report for Newport, based on AirROI data from February 2025 to January 2026, reveals key trends in the niche market of 31 active listings.
Whether you're considering an Airbnb investment in Newport, optimizing your existing vacation rental, or exploring rental arbitrage opportunities, understanding the Newport Airbnb data is crucial. Leveraging the low regulation environment is key to maximizing your short term rental income potential. Let's dive into the specifics.
Key Newport Airbnb Performance Metrics Overview
Monthly Airbnb Revenue Variations & Income Potential in Newport (2026)
Understanding the monthly revenue variations for Airbnb listings in Newport is key to maximizing your short term rental income potential. Seasonality significantly impacts earnings. Our analysis, based on data from the past 12 months, shows that the peak revenue month for STRs in Newport is typically August, while March often presents the lowest earnings, highlighting opportunities for strategic pricing adjustments during shoulder and low seasons. Explore the typical Airbnb income in Newport across different performance tiers:
- Best-in-class properties (Top 10%) achieve $5,768+ monthly, often utilizing dynamic pricing and superior guest experiences.
- Strong performing properties (Top 25%) earn $3,089 or more, indicating effective management and desirable locations/amenities.
- Typical properties (Median) generate around $1,663 per month, representing the average market performance.
- Entry-level properties (Bottom 25%) see earnings around $922, often with potential for optimization.
Average Monthly Airbnb Earnings Trend in Newport
Newport Airbnb Occupancy Rate Trends (2026)
Maximize your bookings by understanding the Newport STR occupancy trends. Seasonal demand shifts significantly influence how often properties are booked. Typically, Augustsees the highest demand (peak season occupancy), while January experiences the lowest (low season). Effective strategies, like adjusting minimum stays or offering promotions, can boost occupancy during slower periods. Here's how different property tiers perform in Newport:
- Best-in-class properties (Top 10%) achieve 74%+ occupancy, indicating high desirability and potentially optimized availability.
- Strong performing properties (Top 25%) maintain 59% or higher occupancy, suggesting good market fit and guest satisfaction.
- Typical properties (Median) have an occupancy rate around 39%.
- Entry-level properties (Bottom 25%) average 17% occupancy, potentially facing higher vacancy.
Average Monthly Occupancy Rate Trend in Newport
Average Daily Rate (ADR) Airbnb Trends in Newport (2026)
Effective short term rental pricing strategy in Newport involves understanding monthly ADR fluctuations. The Average Daily Rate (ADR) for Airbnb in Newport typically peaks in July and dips lowest during April. Leveraging Airbnb dynamic pricing tools or strategies based on this seasonality can significantly boost revenue. Here's a look at the typical nightly rates achieved:
- Best-in-class properties (Top 10%) command rates of $411+ per night, often due to premium features or locations.
- Strong performing properties (Top 25%) achieve nightly rates of $259 or more.
- Typical properties (Median) charge around $155 per night.
- Entry-level properties (Bottom 25%) earn around $97 per night.
Average Daily Rate (ADR) Trend by Month in Newport
Get Live Newport Market Intelligence 👇

Explore Real-time Analytics
Airbnb Seasonality Analysis & Trends in Newport (2026)
Peak Season (August, July, October)
- Revenue averages $3,462 per month
- Occupancy rates average 47.5%
- Daily rates average $206
Shoulder Season
- Revenue averages $2,587 per month
- Occupancy maintains around 38.9%
- Daily rates hold near $195
Low Season (March, May, June)
- Revenue drops to average $2,246 per month
- Occupancy decreases to average 39.3%
- Daily rates adjust to average $191
Seasonality Insights for Newport
- The Airbnb seasonality in Newport shows moderate seasonality with distinct peak and low periods. While the sections above show seasonal averages, it's also insightful to look at the extremes:
- During the high season, the absolute peak month showcases Newport's highest earning potential, with monthly revenues capable of climbing to $3,917, occupancy reaching a high of 54.6%, and ADRs peaking at $208.
- Conversely, the slowest single month of the year, typically falling within the low season, marks the market's lowest point. In this month, revenue might dip to $2,056, occupancy could drop to 31.9%, and ADRs may adjust down to $180.
- Understanding both the seasonal averages and these monthly peaks and troughs in revenue, occupancy, and ADR is crucial for maximizing your Airbnb profit potential in Newport.
Seasonal Strategies for Maximizing Profit
- Peak Season: Maximize revenue through premium pricing and potentially longer minimum stays. Ensure high availability.
- Low Season: Offer competitive pricing, special promotions (e.g., extended stay discounts), and flexible cancellation policies. Target off-season travelers like remote workers or budget-conscious guests.
- Shoulder Seasons: Implement dynamic pricing that balances peak and low rates. Target weekend travelers or specific events. Offer slightly more flexible terms than peak season.
- Regularly analyze your own performance against these Newport seasonality benchmarks and adjust your pricing and availability strategy accordingly.
Best Areas for Airbnb Investment in Newport (2026)
Exploring the top neighborhoods for short-term rentals in Newport? This section highlights key areas, outlining why they are attractive for hosts and guests, along with notable local attractions. Consider these locations based on your target guest profile and investment strategy.
| Neighborhood / Area | Why Host Here? (Target Guests & Appeal) | Key Attractions & Landmarks |
|---|---|---|
| Lake Sunapee | Picturesque lake area that attracts tourists year-round for boating, swimming, and winter sports. Ideal for travelers looking for a serene getaway with outdoor activities. | Lake Sunapee State Park, Mount Sunapee, Sunapee Harbor, Lake activities (boating, fishing), Winter skiing at Mount Sunapee Resort |
| Newport Historic District | Charming area known for its well-preserved 18th-century buildings and rich history. Visitors enjoy walking tours and exploring the local culture, making it a great spot for historical tourism. | Newport's Historic Town Common, The Old Baptist Meeting House, The Historical Society, Trinity Church, The Newport Art Museum |
| Amesbury Park | Family-friendly neighborhood with great access to parks and recreation areas. It's popular with families and those looking for a quiet, residential feel while being close to attractions. | Amesbury Park, Walking trails, Playgrounds, Local family events, Community gatherings |
| Sandy Beach | A beautiful sandy area that attracts beachgoers and water sports enthusiasts. Great sunbathing, swimming, and fishing opportunities draw a variety of travelers. | Sandy Beach, Water sports activities, Picnic areas, Scenic views, Fishing spots |
| Newport Village | The heart of Newport with shops, restaurants, and local markets. A vibrant community hub that appeals to both locals and tourists looking for local flavors and shopping. | Local restaurants and cafes, Upcoming food festivals, Artisan shops, Community events, Farmers markets |
| Cardigan Mountain State Park | Ideal for outdoor enthusiasts and hikers. This area offers beautiful scenery and challenging trails, perfect for those looking for adventure and nature. | Cardigan Mountain trails, Scenic overlooks, Wildlife watching, Camping, Hiking trails |
| Newport Music Festival | Known for its cultural events, especially the renowned music festival held every summer. This attracts music lovers and cultural tourists looking for unique experiences. | Newport Music Festival, Live performances, Artistic gatherings, Cultural events, Galleries showcasing local artists |
| Pine Hill | A quiet, serene neighborhood with beautiful landscapes that attract nature lovers. Perfect for those looking for a peaceful retreat close to nature trails and parks. | Pine Hill trails, Scenic landscapes, Quiet nature walks, Birdwatching, Community parks |
Understanding Airbnb License Requirements & STR Laws in Newport (2026)
While Newport, New Hampshire, United States currently shows low STR regulations, specific Airbnb license requirements might still exist or change. Always verify the latest short term rental regulations and Airbnb license requirements directly with local government authorities for Newport to ensure full compliance before hosting.
(Source: AirROI data, 2026, finding no licensed listings among those analyzed)
Top Performing Airbnb Properties in Newport (2026)
Benchmark your potential! Explore examples of top-performing Airbnb properties in Newportbased on Trailing Twelve Month (TTM) revenue. Analyze their characteristics, revenue, occupancy rate, and ADR to understand what drives success in this market.

Berry Mountain Lodge: Mountain Views by Lake & Ski
Entire Place • 5 bedrooms

Lighthouse Inn the Woods~peaceful nature escape
Entire Place • 2 bedrooms
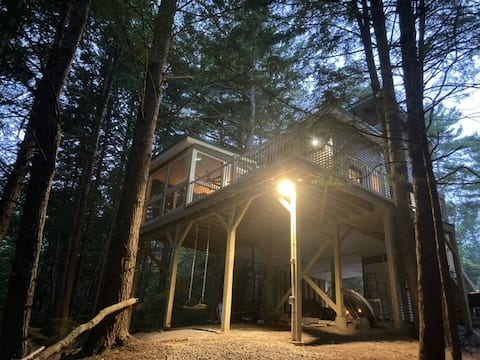
Sugar River Treehouse
Entire Place • 1 bedroom
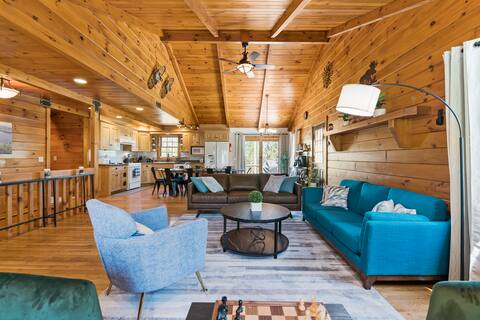
Peaceful cabin w/patio-firepit near lake Sunapee
Entire Place • 4 bedrooms
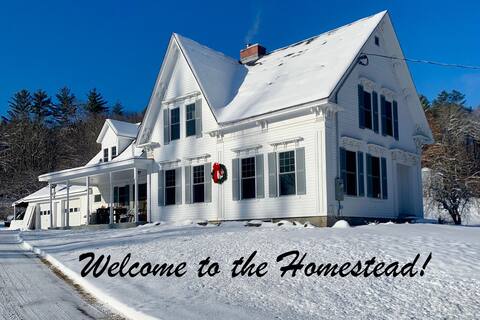
The Homestead
Entire Place • 5 bedrooms

9 mins to Lake/Mt Sunapee!
Entire Place • 4 bedrooms
Note: Performance varies based on location, size, amenities, seasonality, and management quality. Data reflects the past 12 months.
Top Performing Airbnb Hosts in Newport (2026)
Learn from the best! This table showcases top-performing Airbnb hosts in Newport based on the number of properties managed and estimated total revenue over the past year. Analyze their scale and performance metrics.
| Host Name | Properties | Grossing Revenue | Stay Reviews | Avg Rating |
|---|---|---|---|---|
| Cassandra | 1 | $133,788 | 101 | 4.91/5.0 |
| Frankie Lane | 1 | $100,756 | 176 | 4.98/5.0 |
| Ted | 4 | $69,285 | 355 | 4.91/5.0 |
| Meghan | 5 | $66,364 | 144 | 4.96/5.0 |
| David | 1 | $53,515 | 108 | 4.93/5.0 |
| Luis | 1 | $44,500 | 79 | 4.92/5.0 |
| Ethan | 1 | $42,259 | 59 | 4.93/5.0 |
| Kailyn | 4 | $40,894 | 120 | 4.94/5.0 |
| Pulin | 1 | $38,077 | 34 | 4.85/5.0 |
| Dustin | 2 | $29,780 | 156 | 4.92/5.0 |
Analyzing the strategies of top hosts, such as their property selection, pricing, and guest communication, can offer valuable lessons for optimizing your own Airbnb operations in Newport.
Dive Deeper: Advanced Newport STR Market Data (2026)
Ready to unlock more insights? AirROI provides access to advanced metrics and comprehensive Airbnb data for Newport. Explore detailed analytics beyond this report to refine your investment strategy, optimize pricing, and maximize your vacation rental profits.
Explore Advanced MetricsNewport Short-Term Rental Market Composition (2026): Property & Room Types
Room Type Distribution
Property Type Distribution
Market Composition Insights for Newport
- The Newport Airbnb market composition is heavily skewed towards Entire Home/Apt listings, which make up 58.1% of the 31 active rentals. This indicates strong guest preference for privacy and space.
- However, a notable 41.9% share for Private Rooms suggests opportunities for budget-conscious travelers or hosts renting out spare rooms.
- Looking at the property type distribution in Newport, House properties are the most common (51.6%), reflecting the local real estate landscape.
- Houses represent a significant 51.6% portion, catering likely to families or larger groups.
- The presence of 12.9% Hotel/Boutique listings indicates integration with traditional hospitality.
- Smaller segments like unique stays (combined 3.2%) offer potential for unique stay experiences.
Newport Airbnb Room Capacity Analysis (2026): Bedroom Distribution
Distribution of Listings by Number of Bedrooms
Room Capacity Insights for Newport
- The dominant room capacity in Newport is 1 bedroom listings, making up 22.6% of the market. This suggests a strong demand for properties suitable for couples or solo travelers.
- Together, 1 bedroom and 2 bedrooms properties represent 45.2% of the active Airbnb listings in Newport, indicating a high concentration in these sizes.
- A significant 25.9% of listings offer 3+ bedrooms, catering to larger groups and families seeking more space in Newport.
Newport Vacation Rental Guest Capacity Trends (2026)
Distribution of Listings by Guest Capacity
Guest Capacity Insights for Newport
- The most common guest capacity trend in Newport vacation rentals is listings accommodating 4 guests (19.4%). This suggests the primary traveler segment is likely small families or groups.
- Properties designed for 4 guests and 8+ guests dominate the Newport STR market, accounting for 38.8% of listings.
- 32.3% of properties accommodate 6+ guests, serving the market segment for larger families or group travel in Newport.
- On average, properties in Newport are equipped to host 3.7 guests.
Newport Airbnb Booking Patterns (2026): Available vs. Booked Days
Available Days Distribution
Booked Days Distribution
Booking Pattern Insights for Newport
- The most common availability pattern in Newport falls within the 271-366 days range, representing 48.4% of listings. This suggests many properties have significant open periods on their calendars.
- Approximately 77.4% of listings show high availability (181+ days open annually), indicating potential for increased bookings or specific owner usage patterns.
- For booked days, the 31-90 days range is most frequent in Newport (32.3%), reflecting common guest stay durations or potential owner blocking patterns.
- A notable 25.8% of properties secure long booking periods (181+ days booked per year), highlighting successful long-term rental strategies or significant owner usage.
Newport Airbnb Minimum Stay Requirements Analysis
Distribution of Listings by Minimum Night Requirement
1 Night
11 listings
35.5% of total
2 Nights
12 listings
38.7% of total
4-6 Nights
1 listings
3.2% of total
30+ Nights
7 listings
22.6% of total
Key Insights
- The most prevalent minimum stay requirement in Newport is 2 Nights, adopted by 38.7% of listings. This highlights the market's preference for shorter, flexible bookings.
- A strong majority (74.2%) of the Newport Airbnb data shows acceptance of very short stays (1-2 nights), indicating a dynamic, high-turnover market.
- A significant segment (22.6%) caters to monthly stays (30+ nights) in Newport, pointing to opportunities in the extended-stay market.
Recommendations
- Align with the market by considering a 2 Nights minimum stay, as 38.7% of Newport hosts use this setting.
- Explore offering discounts for stays of 30+ nights to attract the 22.6% of the market seeking extended stays.
- Adjust minimum nights based on seasonality – potentially shorter during low season and longer during peak demand periods in Newport.
Newport Airbnb Cancellation Policy Trends Analysis (2026)
Limited
1 listings
3.2% of total
Super Strict 30 Days
1 listings
3.2% of total
Flexible
8 listings
25.8% of total
Moderate
8 listings
25.8% of total
Firm
13 listings
41.9% of total
Cancellation Policy Insights for Newport
- The prevailing Airbnb cancellation policy trend in Newport is Firm, used by 41.9% of listings.
- There's a relatively balanced mix between guest-friendly (51.6%) and stricter (41.9%) policies, offering choices for different guest needs.
Recommendations for Hosts
- Consider adopting a Firm policy to align with the 41.9% market standard in Newport.
- Regularly review your cancellation policy against competitors and market demand shifts in Newport.
Newport STR Booking Lead Time Analysis (2026)
Average Booking Lead Time by Month
Booking Lead Time Insights for Newport
- The overall average booking lead time for vacation rentals in Newport is 38 days.
- Guests book furthest in advance for stays during October (average 54 days), likely coinciding with peak travel demand or local events.
- The shortest booking windows occur for stays in April (average 21 days), indicating more last-minute travel plans during this time.
- Seasonally, Summer (45 days avg.) sees the longest lead times, while Spring (26 days avg.) has the shortest, reflecting typical travel planning cycles.
Recommendations for Hosts
- Use the overall average lead time (38 days) as a baseline for your pricing and availability strategy in Newport.
- For October stays, consider implementing length-of-stay discounts or slightly higher rates for bookings made less than 54 days out to capitalize on advance planning.
- Target marketing efforts for the Summer season well in advance (at least 45 days) to capture early planners.
- Monitor your own booking lead times against these Newport averages to identify opportunities for dynamic pricing adjustments.
Popular & Essential Airbnb Amenities in Newport (2026)
Amenity Prevalence
Amenity Insights for Newport
- Essential amenities in Newport that guests expect include: Free parking on premises, Smoke alarm, TV. Lacking these (any) could significantly impact bookings.
- Popular amenities like Wifi, Heating, Hot water are common but not universal. Offering these can provide a competitive edge.
- Warning: Wifi is not universally provided but is considered essential globally. Ensure reliable Wifi is offered.
Recommendations for Hosts
- Ensure your listing includes all essential amenities for Newport: Free parking on premises, Smoke alarm, TV.
- Prioritize adding missing essentials: TV.
- Consider adding popular differentiators like Wifi or Heating to increase appeal.
- Highlight unique or less common amenities you offer (e.g., hot tub, dedicated workspace, EV charger) in your listing description and photos.
- Regularly check competitor amenities in Newport to stay competitive.
Newport Airbnb Guest Demographics & Profile Analysis (2026)
Guest Profile Summary for Newport
- The typical guest profile for Airbnb in Newport consists of primarily domestic travelers (95%), often arriving from nearby New York, typically belonging to the Post-2000s (Gen Z/Alpha) group (50%), primarily speaking English or Spanish.
- Domestic travelers account for 95.1% of guests.
- Key international markets include United States (95.1%) and Canada (1.9%).
- Top languages spoken are English (66.9%) followed by Spanish (9%).
- A significant demographic segment is the Post-2000s (Gen Z/Alpha) group, representing 50% of guests.
Recommendations for Hosts
- Target domestic marketing efforts towards travelers from New York and Boston.
- Tailor amenities and listing descriptions to appeal to the dominant Post-2000s (Gen Z/Alpha) demographic (e.g., highlight fast WiFi, smart home features, local guides).
- Highlight unique local experiences or amenities relevant to the primary guest profile.
- Consider seasonal promotions aligned with peak travel times for key origin markets.
Nearby Short-Term Rental Market Comparison
How does the Newport Airbnb market stack up against its neighbors? Compare key performance metrics like average monthly revenue, ADR, and occupancy rates in surrounding areas to understand the broader regional STR landscape.
| Market | Active Properties | Monthly Revenue | Daily Rate | Avg. Occupancy |
|---|---|---|---|---|
| Middletown Springs | 13 | $6,843 | $507.55 | 32% |
| Pomfret | 15 | $6,549 | $502.74 | 45% |
| Fort Ann | 35 | $6,238 | $790.41 | 37% |
| Hanover | 33 | $5,826 | $1189.51 | 41% |
| North Andover | 12 | $5,625 | $440.84 | 45% |
| Town of Ancram | 22 | $5,616 | $512.55 | 38% |
| Wellesley | 22 | $5,310 | $520.90 | 50% |
| Town of Schodack | 11 | $5,158 | $555.89 | 29% |
| Town of Stillwater | 55 | $5,153 | $564.54 | 42% |
| Barnstead | 36 | $5,090 | $477.12 | 42% |