Reno Airbnb Market Analysis 2026: Short Term Rental Data & Vacation Rental Statistics in Nevada, United States
Is Airbnb profitable in Reno in 2026? Explore comprehensive Airbnb analytics for Reno, Nevada, United States to uncover income potential. This 2026 STR market report for Reno, based on AirROI data from February 2025 to January 2026, reveals key trends in the market of 819 active listings.
Whether you're considering an Airbnb investment in Reno, optimizing your existing vacation rental, or exploring rental arbitrage opportunities, understanding the Reno Airbnb data is crucial. Leveraging the low regulation environment is key to maximizing your short term rental income potential. Let's dive into the specifics.
Key Reno Airbnb Performance Metrics Overview
Monthly Airbnb Revenue Variations & Income Potential in Reno (2026)
Understanding the monthly revenue variations for Airbnb listings in Reno is key to maximizing your short term rental income potential. Seasonality significantly impacts earnings. Our analysis, based on data from the past 12 months, shows that the peak revenue month for STRs in Reno is typically July, while February often presents the lowest earnings, highlighting opportunities for strategic pricing adjustments during shoulder and low seasons. Explore the typical Airbnb income in Reno across different performance tiers:
- Best-in-class properties (Top 10%) achieve $6,534+ monthly, often utilizing dynamic pricing and superior guest experiences.
- Strong performing properties (Top 25%) earn $4,438 or more, indicating effective management and desirable locations/amenities.
- Typical properties (Median) generate around $2,674 per month, representing the average market performance.
- Entry-level properties (Bottom 25%) see earnings around $1,472, often with potential for optimization.
Average Monthly Airbnb Earnings Trend in Reno
Reno Airbnb Occupancy Rate Trends (2026)
Maximize your bookings by understanding the Reno STR occupancy trends. Seasonal demand shifts significantly influence how often properties are booked. Typically, Julysees the highest demand (peak season occupancy), while January experiences the lowest (low season). Effective strategies, like adjusting minimum stays or offering promotions, can boost occupancy during slower periods. Here's how different property tiers perform in Reno:
- Best-in-class properties (Top 10%) achieve 85%+ occupancy, indicating high desirability and potentially optimized availability.
- Strong performing properties (Top 25%) maintain 73% or higher occupancy, suggesting good market fit and guest satisfaction.
- Typical properties (Median) have an occupancy rate around 52%.
- Entry-level properties (Bottom 25%) average 30% occupancy, potentially facing higher vacancy.
Average Monthly Occupancy Rate Trend in Reno
Average Daily Rate (ADR) Airbnb Trends in Reno (2026)
Effective short term rental pricing strategy in Reno involves understanding monthly ADR fluctuations. The Average Daily Rate (ADR) for Airbnb in Reno typically peaks in December and dips lowest during March. Leveraging Airbnb dynamic pricing tools or strategies based on this seasonality can significantly boost revenue. Here's a look at the typical nightly rates achieved:
- Best-in-class properties (Top 10%) command rates of $381+ per night, often due to premium features or locations.
- Strong performing properties (Top 25%) achieve nightly rates of $265 or more.
- Typical properties (Median) charge around $173 per night.
- Entry-level properties (Bottom 25%) earn around $110 per night.
Average Daily Rate (ADR) Trend by Month in Reno
Get Live Reno Market Intelligence 👇

Explore Real-time Analytics
Airbnb Seasonality Analysis & Trends in Reno (2026)
Peak Season (July, August, June)
- Revenue averages $4,089 per month
- Occupancy rates average 59.2%
- Daily rates average $219
Shoulder Season
- Revenue averages $3,256 per month
- Occupancy maintains around 49.2%
- Daily rates hold near $217
Low Season (January, February, March)
- Revenue drops to average $2,755 per month
- Occupancy decreases to average 46.9%
- Daily rates adjust to average $203
Seasonality Insights for Reno
- The Airbnb seasonality in Reno shows moderate seasonality with distinct peak and low periods. While the sections above show seasonal averages, it's also insightful to look at the extremes:
- During the high season, the absolute peak month showcases Reno's highest earning potential, with monthly revenues capable of climbing to $4,310, occupancy reaching a high of 60.9%, and ADRs peaking at $240.
- Conversely, the slowest single month of the year, typically falling within the low season, marks the market's lowest point. In this month, revenue might dip to $2,605, occupancy could drop to 41.5%, and ADRs may adjust down to $193.
- Understanding both the seasonal averages and these monthly peaks and troughs in revenue, occupancy, and ADR is crucial for maximizing your Airbnb profit potential in Reno.
Seasonal Strategies for Maximizing Profit
- Peak Season: Maximize revenue through premium pricing and potentially longer minimum stays. Ensure high availability.
- Low Season: Offer competitive pricing, special promotions (e.g., extended stay discounts), and flexible cancellation policies. Target off-season travelers like remote workers or budget-conscious guests.
- Shoulder Seasons: Implement dynamic pricing that balances peak and low rates. Target weekend travelers or specific events. Offer slightly more flexible terms than peak season.
- Regularly analyze your own performance against these Reno seasonality benchmarks and adjust your pricing and availability strategy accordingly.
Best Areas for Airbnb Investment in Reno (2026)
Exploring the top neighborhoods for short-term rentals in Reno? This section highlights key areas, outlining why they are attractive for hosts and guests, along with notable local attractions. Consider these locations based on your target guest profile and investment strategy.
| Neighborhood / Area | Why Host Here? (Target Guests & Appeal) | Key Attractions & Landmarks |
|---|---|---|
| Downtown Reno | The vibrant heart of the city with a mix of casinos, entertainment venues, and cultural attractions. Ideal for visitors wanting to experience Reno's nightlife and events. | Reno Arch, National Bowling Stadium, Terry Lee Wells Nevada Discovery Museum, Reno Events Center, Casino Row |
| South Reno | A suburban area known for its family-friendly environment and proximity to outdoor activities. Perfect for families and nature enthusiasts visiting the area. | Mount Rose Ski Tahoe, Reno Riverwalk District, Hiking trails in the Sierra Nevada, South Valleys Regional Park, Virginia Lake |
| Midtown Reno | An artsy neighborhood filled with trendy shops, restaurants, and galleries. Appeals to younger travelers and those looking for a more local experience. | Reno's Biggest Little City Sign, Midtown Eats, Reno Art Works, Epic Rides bike shop, Local craft breweries |
| North Valleys | A growing area with newer developments and access to outdoor recreational activities. Attractive for visitors looking for tranquility and nature. | Hungry Valley, Stead Airport, Cold Springs Park, Outdoor trails, Lakes and fishing spots |
| Lake Tahoe | Just a short drive from Reno, Lake Tahoe offers stunning views and year-round activities. An excellent choice for travelers looking to combine relaxation and adventure. | Lake Tahoe beaches, Ski resorts, Hiking trails, Boat rentals, Casinos |
| Virginia City | A historic mining town located nearby, famous for its rich heritage and preserved 19th-century buildings. Great for history buffs and those seeking unique experiences. | Virginia City Historic District, Comstock Gold Mine, Mark Twain Museum, The Washoe Club, Historic saloons |
| Sparks | Adjacent to Reno, Sparks offers its own charm with shopping, dining, and recreational areas. A good option for families and those attending events. | The Outlets at Legends, Sparks Marina Park, Wild Island Family Adventure Park, Nevada Discovery Museum, Sparks Heritage Museum |
| Washoe Valley | Known for its natural beauty, Washoe Valley is an excellent destination for outdoor lovers, offering peaceful settings and ample recreational opportunities. | Washoe Lake State Park, Biking and hiking trails, Scenic drives, Wildlife viewing, Birdwatching opportunities |
Understanding Airbnb License Requirements & STR Laws in Reno (2026)
While Reno, Nevada, United States currently shows low STR regulations, specific Airbnb license requirements might still exist or change. Always verify the latest short term rental regulations and Airbnb license requirements directly with local government authorities for Reno to ensure full compliance before hosting.
(Source: AirROI data, 2026, based on 2% licensed listings)
Top Performing Airbnb Properties in Reno (2026)
Benchmark your potential! Explore examples of top-performing Airbnb properties in Renobased on Trailing Twelve Month (TTM) revenue. Analyze their characteristics, revenue, occupancy rate, and ADR to understand what drives success in this market.

Hot Tub, Pool Table: Luxe Reno Chalet w/ Mtn View!
Entire Place • 6 bedrooms
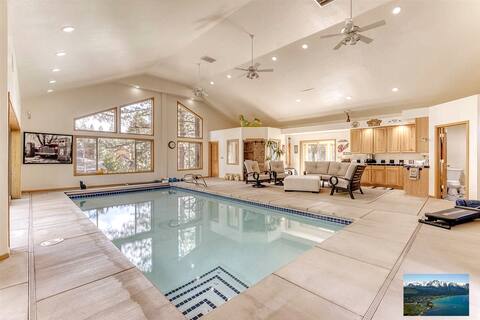
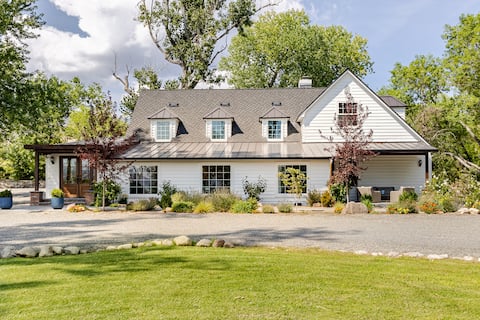
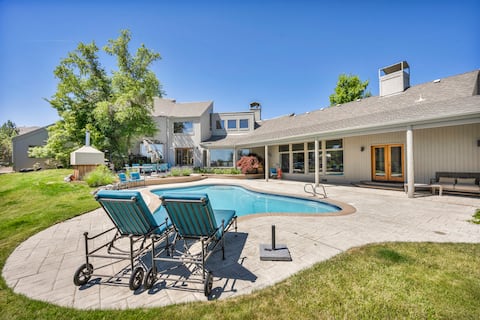
6000 sqft Pine House with indoor swimming pool
Entire Place • 5 bedrooms
The Ranch House – Pool, Hot Tub & Fire Pit Retreat
Entire Place • 7 bedrooms
Hillside Haven with Pool, Wine Bar, and Game Room
Entire Place • 5 bedrooms

City View Hill House • Hot Tub & Fire Pit
Entire Place • 4 bedrooms

Seven Acre Ranch | Creekside • Hot Tub • Fireplace
Entire Place • 4 bedrooms
Note: Performance varies based on location, size, amenities, seasonality, and management quality. Data reflects the past 12 months.
Top Performing Airbnb Hosts in Reno (2026)
Learn from the best! This table showcases top-performing Airbnb hosts in Reno based on the number of properties managed and estimated total revenue over the past year. Analyze their scale and performance metrics.
| Host Name | Properties | Grossing Revenue | Stay Reviews | Avg Rating |
|---|---|---|---|---|
| Evolve | 30 | $1,634,861 | 1074 | 4.81/5.0 |
| Sigua Vacations | 24 | $948,928 | 651 | 4.85/5.0 |
| Short Stays | 55 | $875,798 | 1287 | 4.55/5.0 |
| Matt | 10 | $810,565 | 945 | 4.81/5.0 |
| Patrick | 9 | $503,130 | 445 | 4.96/5.0 |
| LussoStay | 16 | $495,303 | 244 | 4.75/5.0 |
| Short Stays | 23 | $294,053 | 43 | 4.60/5.0 |
| Nicolas | 6 | $288,601 | 753 | 4.85/5.0 |
| Michael | 7 | $258,329 | 294 | 4.91/5.0 |
| Jenny | 5 | $251,683 | 348 | 4.91/5.0 |
Analyzing the strategies of top hosts, such as their property selection, pricing, and guest communication, can offer valuable lessons for optimizing your own Airbnb operations in Reno.
Dive Deeper: Advanced Reno STR Market Data (2026)
Ready to unlock more insights? AirROI provides access to advanced metrics and comprehensive Airbnb data for Reno. Explore detailed analytics beyond this report to refine your investment strategy, optimize pricing, and maximize your vacation rental profits.
Explore Advanced MetricsReno Short-Term Rental Market Composition (2026): Property & Room Types
Room Type Distribution
Property Type Distribution
Market Composition Insights for Reno
- The Reno Airbnb market composition is heavily skewed towards Entire Home/Apt listings, which make up 89.5% of the 819 active rentals. This indicates strong guest preference for privacy and space.
- Looking at the property type distribution in Reno, House properties are the most common (64.6%), reflecting the local real estate landscape.
- Houses represent a significant 64.6% portion, catering likely to families or larger groups.
- The presence of 5.7% Hotel/Boutique listings indicates integration with traditional hospitality.
- Smaller segments like others, outdoor/unique (combined 4.4%) offer potential for unique stay experiences.
Reno Airbnb Room Capacity Analysis (2026): Bedroom Distribution
Distribution of Listings by Number of Bedrooms
Room Capacity Insights for Reno
- The dominant room capacity in Reno is 2 bedrooms listings, making up 26% of the market. This suggests a strong demand for properties suitable for couples or solo travelers.
- Together, 2 bedrooms and 1 bedroom properties represent 49.4% of the active Airbnb listings in Reno, indicating a high concentration in these sizes.
- A significant 36.2% of listings offer 3+ bedrooms, catering to larger groups and families seeking more space in Reno.
Reno Vacation Rental Guest Capacity Trends (2026)
Distribution of Listings by Guest Capacity
Guest Capacity Insights for Reno
- The most common guest capacity trend in Reno vacation rentals is listings accommodating 8+ guests (25.2%). This suggests the primary traveler segment is likely larger groups.
- Properties designed for 8+ guests and 2 guests dominate the Reno STR market, accounting for 43.3% of listings.
- 45.7% of properties accommodate 6+ guests, serving the market segment for larger families or group travel in Reno.
- On average, properties in Reno are equipped to host 4.8 guests.
Reno Airbnb Booking Patterns (2026): Available vs. Booked Days
Available Days Distribution
Booked Days Distribution
Booking Pattern Insights for Reno
- The most common availability pattern in Reno falls within the 271-366 days range, representing 37.1% of listings. This suggests many properties have significant open periods on their calendars.
- Approximately 67.6% of listings show high availability (181+ days open annually), indicating potential for increased bookings or specific owner usage patterns.
- For booked days, the 91-180 days range is most frequent in Reno (29.8%), reflecting common guest stay durations or potential owner blocking patterns.
- A notable 33.7% of properties secure long booking periods (181+ days booked per year), highlighting successful long-term rental strategies or significant owner usage.
Reno Airbnb Minimum Stay Requirements Analysis
Distribution of Listings by Minimum Night Requirement
1 Night
175 listings
21.4% of total
2 Nights
196 listings
23.9% of total
3 Nights
32 listings
3.9% of total
4-6 Nights
60 listings
7.3% of total
7-29 Nights
88 listings
10.7% of total
30+ Nights
268 listings
32.7% of total
Key Insights
- The most prevalent minimum stay requirement in Reno is 30+ Nights, adopted by 32.7% of listings. This highlights the market's preference for longer commitments.
- A significant segment (32.7%) caters to monthly stays (30+ nights) in Reno, pointing to opportunities in the extended-stay market.
Recommendations
- Align with the market by considering a 30+ Nights minimum stay, as 32.7% of Reno hosts use this setting.
- If feasible, allowing 1-night stays, especially midweek or during low season, could capture last-minute bookings, as only 21.4% currently do.
- Explore offering discounts for stays of 30+ nights to attract the 32.7% of the market seeking extended stays.
- Adjust minimum nights based on seasonality – potentially shorter during low season and longer during peak demand periods in Reno.
Reno Airbnb Cancellation Policy Trends Analysis (2026)
Super Strict 60 Days
78 listings
9.6% of total
Super Strict 30 Days
1 listings
0.1% of total
Limited
23 listings
2.8% of total
Flexible
122 listings
15% of total
Moderate
189 listings
23.2% of total
Firm
264 listings
32.4% of total
Strict
138 listings
16.9% of total
Cancellation Policy Insights for Reno
- The prevailing Airbnb cancellation policy trend in Reno is Firm, used by 32.4% of listings.
- There's a relatively balanced mix between guest-friendly (38.2%) and stricter (49.3%) policies, offering choices for different guest needs.
Recommendations for Hosts
- Consider adopting a Firm policy to align with the 32.4% market standard in Reno.
- Regularly review your cancellation policy against competitors and market demand shifts in Reno.
Reno STR Booking Lead Time Analysis (2026)
Average Booking Lead Time by Month
Booking Lead Time Insights for Reno
- The overall average booking lead time for vacation rentals in Reno is 32 days.
- Guests book furthest in advance for stays during August (average 45 days), likely coinciding with peak travel demand or local events.
- The shortest booking windows occur for stays in February (average 20 days), indicating more last-minute travel plans during this time.
- Seasonally, Summer (40 days avg.) sees the longest lead times, while Winter (26 days avg.) has the shortest, reflecting typical travel planning cycles.
Recommendations for Hosts
- Use the overall average lead time (32 days) as a baseline for your pricing and availability strategy in Reno.
- For August stays, consider implementing length-of-stay discounts or slightly higher rates for bookings made less than 45 days out to capitalize on advance planning.
- Target marketing efforts for the Summer season well in advance (at least 40 days) to capture early planners.
- Monitor your own booking lead times against these Reno averages to identify opportunities for dynamic pricing adjustments.
Popular & Essential Airbnb Amenities in Reno (2026)
Amenity Prevalence
Amenity Insights for Reno
- Essential amenities in Reno that guests expect include: Wifi, Smoke alarm, TV, Heating, Air conditioning. Lacking these (any) could significantly impact bookings.
- Popular amenities like Kitchen, Free parking on premises, Hot water are common but not universal. Offering these can provide a competitive edge.
Recommendations for Hosts
- Ensure your listing includes all essential amenities for Reno: Wifi, Smoke alarm, TV, Heating, Air conditioning.
- Prioritize adding missing essentials: Wifi, Smoke alarm, TV, Heating, Air conditioning.
- Consider adding popular differentiators like Kitchen or Free parking on premises to increase appeal.
- Highlight unique or less common amenities you offer (e.g., hot tub, dedicated workspace, EV charger) in your listing description and photos.
- Regularly check competitor amenities in Reno to stay competitive.
Reno Airbnb Guest Demographics & Profile Analysis (2026)
Guest Profile Summary for Reno
- The typical guest profile for Airbnb in Reno consists of primarily domestic travelers (96%), often arriving from nearby Las Vegas, typically belonging to the Post-2000s (Gen Z/Alpha) group (50%), primarily speaking English or Spanish.
- Domestic travelers account for 95.5% of guests.
- Key international markets include United States (95.5%) and Mexico (0.6%).
- Top languages spoken are English (67%) followed by Spanish (16.1%).
- A significant demographic segment is the Post-2000s (Gen Z/Alpha) group, representing 50% of guests.
Recommendations for Hosts
- Target domestic marketing efforts towards travelers from Las Vegas and Reno.
- Tailor amenities and listing descriptions to appeal to the dominant Post-2000s (Gen Z/Alpha) demographic (e.g., highlight fast WiFi, smart home features, local guides).
- Highlight unique local experiences or amenities relevant to the primary guest profile.
- Consider seasonal promotions aligned with peak travel times for key origin markets.
Nearby Short-Term Rental Market Comparison
How does the Reno Airbnb market stack up against its neighbors? Compare key performance metrics like average monthly revenue, ADR, and occupancy rates in surrounding areas to understand the broader regional STR landscape.
| Market | Active Properties | Monthly Revenue | Daily Rate | Avg. Occupancy |
|---|---|---|---|---|
| Zephyr Cove | 192 | $6,404 | $642.42 | 37% |
| Homewood | 150 | $5,842 | $595.57 | 40% |
| Meyers | 177 | $5,840 | $500.97 | 43% |
| Glenbrook | 32 | $5,788 | $841.74 | 35% |
| Carnelian Bay | 349 | $5,362 | $561.69 | 39% |
| Incline Village-Crystal Bay | 204 | $5,197 | $589.54 | 35% |
| Tahoma | 199 | $5,011 | $605.47 | 36% |
| Tahoe Vista | 233 | $4,606 | $480.30 | 38% |
| Tahoe City | 792 | $4,449 | $539.47 | 36% |
| Kings Beach | 451 | $4,427 | $470.97 | 38% |