Ely Airbnb Market Analysis 2026: Short Term Rental Data & Vacation Rental Statistics in Nevada, United States
Is Airbnb profitable in Ely in 2026? Explore comprehensive Airbnb analytics for Ely, Nevada, United States to uncover income potential. This 2026 STR market report for Ely, based on AirROI data from February 2025 to January 2026, reveals key trends in the niche market of 21 active listings.
Whether you're considering an Airbnb investment in Ely, optimizing your existing vacation rental, or exploring rental arbitrage opportunities, understanding the Ely Airbnb data is crucial. Leveraging the low regulation environment is key to maximizing your short term rental income potential. Let's dive into the specifics.
Key Ely Airbnb Performance Metrics Overview
Monthly Airbnb Revenue Variations & Income Potential in Ely (2026)
Understanding the monthly revenue variations for Airbnb listings in Ely is key to maximizing your short term rental income potential. Seasonality significantly impacts earnings. Our analysis, based on data from the past 12 months, shows that the peak revenue month for STRs in Ely is typically August, while March often presents the lowest earnings, highlighting opportunities for strategic pricing adjustments during shoulder and low seasons. Explore the typical Airbnb income in Ely across different performance tiers:
- Best-in-class properties (Top 10%) achieve $3,464+ monthly, often utilizing dynamic pricing and superior guest experiences.
- Strong performing properties (Top 25%) earn $2,448 or more, indicating effective management and desirable locations/amenities.
- Typical properties (Median) generate around $1,386 per month, representing the average market performance.
- Entry-level properties (Bottom 25%) see earnings around $645, often with potential for optimization.
Average Monthly Airbnb Earnings Trend in Ely
Ely Airbnb Occupancy Rate Trends (2026)
Maximize your bookings by understanding the Ely STR occupancy trends. Seasonal demand shifts significantly influence how often properties are booked. Typically, Septembersees the highest demand (peak season occupancy), while December experiences the lowest (low season). Effective strategies, like adjusting minimum stays or offering promotions, can boost occupancy during slower periods. Here's how different property tiers perform in Ely:
- Best-in-class properties (Top 10%) achieve 78%+ occupancy, indicating high desirability and potentially optimized availability.
- Strong performing properties (Top 25%) maintain 60% or higher occupancy, suggesting good market fit and guest satisfaction.
- Typical properties (Median) have an occupancy rate around 41%.
- Entry-level properties (Bottom 25%) average 28% occupancy, potentially facing higher vacancy.
Average Monthly Occupancy Rate Trend in Ely
Average Daily Rate (ADR) Airbnb Trends in Ely (2026)
Effective short term rental pricing strategy in Ely involves understanding monthly ADR fluctuations. The Average Daily Rate (ADR) for Airbnb in Ely typically peaks in June and dips lowest during January. Leveraging Airbnb dynamic pricing tools or strategies based on this seasonality can significantly boost revenue. Here's a look at the typical nightly rates achieved:
- Best-in-class properties (Top 10%) command rates of $204+ per night, often due to premium features or locations.
- Strong performing properties (Top 25%) achieve nightly rates of $136 or more.
- Typical properties (Median) charge around $102 per night.
- Entry-level properties (Bottom 25%) earn around $71 per night.
Average Daily Rate (ADR) Trend by Month in Ely
Get Live Ely Market Intelligence 👇

Explore Real-time Analytics
Airbnb Seasonality Analysis & Trends in Ely (2026)
Peak Season (August, September, May)
- Revenue averages $1,917 per month
- Occupancy rates average 50.4%
- Daily rates average $124
Shoulder Season
- Revenue averages $1,671 per month
- Occupancy maintains around 43.8%
- Daily rates hold near $119
Low Season (January, February, March)
- Revenue drops to average $1,313 per month
- Occupancy decreases to average 37.1%
- Daily rates adjust to average $116
Seasonality Insights for Ely
- The Airbnb seasonality in Ely shows moderate seasonality with distinct peak and low periods. While the sections above show seasonal averages, it's also insightful to look at the extremes:
- During the high season, the absolute peak month showcases Ely's highest earning potential, with monthly revenues capable of climbing to $1,940, occupancy reaching a high of 54.8%, and ADRs peaking at $137.
- Conversely, the slowest single month of the year, typically falling within the low season, marks the market's lowest point. In this month, revenue might dip to $1,232, occupancy could drop to 34.1%, and ADRs may adjust down to $98.
- Understanding both the seasonal averages and these monthly peaks and troughs in revenue, occupancy, and ADR is crucial for maximizing your Airbnb profit potential in Ely.
Seasonal Strategies for Maximizing Profit
- Peak Season: Maximize revenue through premium pricing and potentially longer minimum stays. Ensure high availability.
- Low Season: Offer competitive pricing, special promotions (e.g., extended stay discounts), and flexible cancellation policies. Target off-season travelers like remote workers or budget-conscious guests.
- Shoulder Seasons: Implement dynamic pricing that balances peak and low rates. Target weekend travelers or specific events. Offer slightly more flexible terms than peak season.
- Regularly analyze your own performance against these Ely seasonality benchmarks and adjust your pricing and availability strategy accordingly.
Best Areas for Airbnb Investment in Ely (2026)
Exploring the top neighborhoods for short-term rentals in Ely? This section highlights key areas, outlining why they are attractive for hosts and guests, along with notable local attractions. Consider these locations based on your target guest profile and investment strategy.
| Neighborhood / Area | Why Host Here? (Target Guests & Appeal) | Key Attractions & Landmarks |
|---|---|---|
| Downtown Ely | The heart of Ely, filled with local shops, restaurants, and historical landmarks. Its central location makes it attractive for visitors looking to explore the culture and history of the area. | Ely Renaissance Village, White Pine County Museum, Nevada Northern Railway, Ely's Great Basin Railroad, Celestial Golf Course |
| Cave Lake State Park | A beautiful natural area ideal for outdoor enthusiasts. Popular for fishing, hiking, and camping, attracting visitors looking for nature and wildlife experiences. | Cave Lake, Hiking trails, Fishing spots, Picnic areas, Wildlife watching |
| Ely Air Museum | A unique attraction for aviation enthusiasts featuring various aircraft and exhibits. It draws in visitors interested in aviation history and aviation-themed experiences. | Historic aircraft displays, Aviation artifacts, Educational programs |
| Great Basin National Park | A short drive from Ely, this national park offers stunning landscapes, dark skies for stargazing, and opportunities for hiking and exploring the natural beauty of the region. | Lehman Caves, Wheeler Peak, Stargazing, Scenic drives, Hiking trails |
| Ruby Mountains | Known for its picturesque scenery and outdoor activities, the Ruby Mountains attract adventurous visitors interested in hiking, fishing, and winter sports. | Hiking trails, Fishing areas, Scenic views, Winter sports options |
| Historic Ely Main Street | Full of character with its charming buildings, this area is home to local boutiques and eateries. Great for visitors seeking a quaint shopping and dining experience. | Local shops, Restaurants, Historical landmarks |
| Ely Shoshone Tribe Cultural Center | An important cultural site showcasing Native American history and culture. Visitors interested in indigenous heritage will find this area particularly appealing. | Cultural exhibits, Art displays, Historical presentations |
| White Pine County Fairgrounds | Hosts various events and fairs throughout the year, attracting locals and visitors alike. Ideal for guests looking to participate in community activities and local gatherings. | Annual fairs, Local events, Community activities |
Understanding Airbnb License Requirements & STR Laws in Ely (2026)
While Ely, Nevada, United States currently shows low STR regulations, specific Airbnb license requirements might still exist or change. Always verify the latest short term rental regulations and Airbnb license requirements directly with local government authorities for Ely to ensure full compliance before hosting.
(Source: AirROI data, 2026, finding no licensed listings among those analyzed)
Top Performing Airbnb Properties in Ely (2026)
Benchmark your potential! Explore examples of top-performing Airbnb properties in Elybased on Trailing Twelve Month (TTM) revenue. Analyze their characteristics, revenue, occupancy rate, and ADR to understand what drives success in this market.
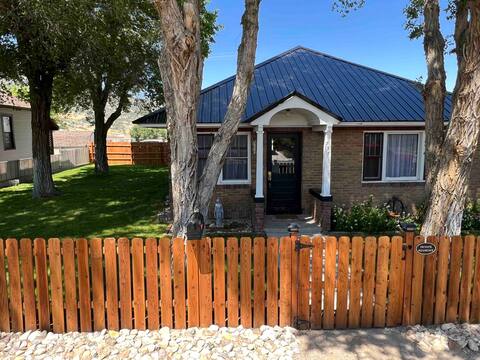
The Ely Airbnb
Entire Place • 3 bedrooms
Right downtown by Casinos.
Entire Place • 3 bedrooms

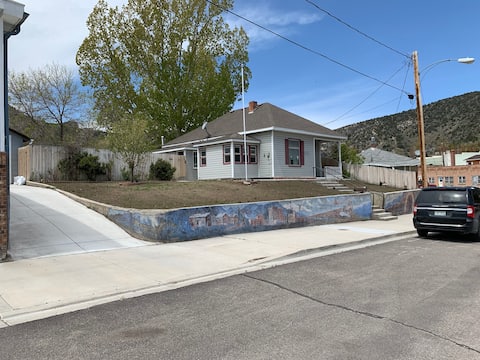
ShopKeepers Inn (Oversized Parking, On Main Hwy)
Entire Place • 2 bedrooms

The Canyon Oasis
Entire Place • 2 bedrooms

Ely Cottage
Entire Place • 1 bedroom

Down Town Experience.
Entire Place • 2 bedrooms
Note: Performance varies based on location, size, amenities, seasonality, and management quality. Data reflects the past 12 months.
Top Performing Airbnb Hosts in Ely (2026)
Learn from the best! This table showcases top-performing Airbnb hosts in Ely based on the number of properties managed and estimated total revenue over the past year. Analyze their scale and performance metrics.
| Host Name | Properties | Grossing Revenue | Stay Reviews | Avg Rating |
|---|---|---|---|---|
| Rudy | 11 | $68,076 | 184 | 4.91/5.0 |
| The Green Rooster’s Coups | 2 | $52,469 | 507 | 4.85/5.0 |
| Pammy And Tony | 1 | $41,632 | 117 | 4.95/5.0 |
| Jason | 1 | $29,595 | 130 | 4.96/5.0 |
| Michael | 1 | $26,899 | 55 | 4.96/5.0 |
| Eric | 1 | $20,464 | 39 | 4.97/5.0 |
| John | 1 | $20,354 | 57 | 4.96/5.0 |
| Nancy | 1 | $19,013 | 200 | 4.91/5.0 |
| Kathy | 1 | $16,958 | 53 | 4.79/5.0 |
| Joseph | 1 | $13,399 | 11 | 4.91/5.0 |
Analyzing the strategies of top hosts, such as their property selection, pricing, and guest communication, can offer valuable lessons for optimizing your own Airbnb operations in Ely.
Dive Deeper: Advanced Ely STR Market Data (2026)
Ready to unlock more insights? AirROI provides access to advanced metrics and comprehensive Airbnb data for Ely. Explore detailed analytics beyond this report to refine your investment strategy, optimize pricing, and maximize your vacation rental profits.
Explore Advanced MetricsEly Short-Term Rental Market Composition (2026): Property & Room Types
Room Type Distribution
Property Type Distribution
Market Composition Insights for Ely
- The Ely Airbnb market composition is heavily skewed towards Entire Home/Apt listings, which make up 100% of the 21 active rentals. This indicates strong guest preference for privacy and space.
- Looking at the property type distribution in Ely, Outdoor/Unique properties are the most common (52.4%), reflecting the local real estate landscape.
- Houses represent a significant 38.1% portion, catering likely to families or larger groups.
Ely Airbnb Room Capacity Analysis (2026): Bedroom Distribution
Distribution of Listings by Number of Bedrooms
Room Capacity Insights for Ely
- The dominant room capacity in Ely is 1 bedroom listings, making up 38.1% of the market. This suggests a strong demand for properties suitable for couples or solo travelers.
- Together, 1 bedroom and 2 bedrooms properties represent 57.1% of the active Airbnb listings in Ely, indicating a high concentration in these sizes.
Ely Vacation Rental Guest Capacity Trends (2026)
Distribution of Listings by Guest Capacity
Guest Capacity Insights for Ely
- The most common guest capacity trend in Ely vacation rentals is listings accommodating 4 guests (42.9%). This suggests the primary traveler segment is likely small families or groups.
- Properties designed for 4 guests and 2 guests dominate the Ely STR market, accounting for 61.9% of listings.
- On average, properties in Ely are equipped to host 3.9 guests.
Ely Airbnb Booking Patterns (2026): Available vs. Booked Days
Available Days Distribution
Booked Days Distribution
Booking Pattern Insights for Ely
- The most common availability pattern in Ely falls within the 181-270 days range, representing 47.6% of listings. This suggests many properties have significant open periods on their calendars.
- Approximately 80.9% of listings show high availability (181+ days open annually), indicating potential for increased bookings or specific owner usage patterns.
- For booked days, the 91-180 days range is most frequent in Ely (42.9%), reflecting common guest stay durations or potential owner blocking patterns.
- A notable 23.8% of properties secure long booking periods (181+ days booked per year), highlighting successful long-term rental strategies or significant owner usage.
Ely Airbnb Minimum Stay Requirements Analysis
Distribution of Listings by Minimum Night Requirement
1 Night
18 listings
85.7% of total
2 Nights
2 listings
9.5% of total
30+ Nights
1 listings
4.8% of total
Key Insights
- The most prevalent minimum stay requirement in Ely is 1 Night, adopted by 85.7% of listings. This highlights the market's preference for shorter, flexible bookings.
- A strong majority (95.2%) of the Ely Airbnb data shows acceptance of very short stays (1-2 nights), indicating a dynamic, high-turnover market.
Recommendations
- Align with the market by considering a 1 Night minimum stay, as 85.7% of Ely hosts use this setting.
- Adjust minimum nights based on seasonality – potentially shorter during low season and longer during peak demand periods in Ely.
Ely Airbnb Cancellation Policy Trends Analysis (2026)
Limited
1 listings
4.8% of total
Flexible
1 listings
4.8% of total
Moderate
15 listings
71.4% of total
Firm
2 listings
9.5% of total
Strict
2 listings
9.5% of total
Cancellation Policy Insights for Ely
- The prevailing Airbnb cancellation policy trend in Ely is Moderate, used by 71.4% of listings.
- The market strongly favors guest-friendly terms, with 76.2% of listings offering Flexible or Moderate policies. This suggests guests in Ely may expect booking flexibility.
- Strict cancellation policies are quite rare (9.5%), potentially making listings with this policy less competitive unless justified by high demand or property type.
Recommendations for Hosts
- Consider adopting a Moderate policy to align with the 71.4% market standard in Ely.
- Using a Strict policy might deter some guests, as only 9.5% of listings use it. Evaluate if potential revenue protection outweighs possible lower booking rates.
- Regularly review your cancellation policy against competitors and market demand shifts in Ely.
Ely STR Booking Lead Time Analysis (2026)
Average Booking Lead Time by Month
Booking Lead Time Insights for Ely
- The overall average booking lead time for vacation rentals in Ely is 94 days.
- Guests book furthest in advance for stays during August (average 142 days), likely coinciding with peak travel demand or local events.
- The shortest booking windows occur for stays in February (average 12 days), indicating more last-minute travel plans during this time.
- Seasonally, Summer (114 days avg.) sees the longest lead times, while Winter (15 days avg.) has the shortest, reflecting typical travel planning cycles.
Recommendations for Hosts
- Use the overall average lead time (94 days) as a baseline for your pricing and availability strategy in Ely.
- For August stays, consider implementing length-of-stay discounts or slightly higher rates for bookings made less than 142 days out to capitalize on advance planning.
- During February, focus on last-minute booking availability and promotions, as guests book with very short notice (12 days avg.).
- Target marketing efforts for the Summer season well in advance (at least 114 days) to capture early planners.
- Monitor your own booking lead times against these Ely averages to identify opportunities for dynamic pricing adjustments.
Popular & Essential Airbnb Amenities in Ely (2026)
Amenity Prevalence
Amenity Insights for Ely
- Essential amenities in Ely that guests expect include: Free parking on premises. Lacking these (this) could significantly impact bookings.
- Popular amenities like Pets allowed, Hot water, Refrigerator are common but not universal. Offering these can provide a competitive edge.
Recommendations for Hosts
- Ensure your listing includes all essential amenities for Ely: Free parking on premises.
- Consider adding popular differentiators like Pets allowed or Hot water to increase appeal.
- Highlight unique or less common amenities you offer (e.g., hot tub, dedicated workspace, EV charger) in your listing description and photos.
- Regularly check competitor amenities in Ely to stay competitive.
Ely Airbnb Guest Demographics & Profile Analysis (2026)
Guest Profile Summary for Ely
- The typical guest profile for Airbnb in Ely consists of primarily domestic travelers (95%), often arriving from nearby Reno, typically belonging to the Post-2000s (Gen Z/Alpha) group (50%), primarily speaking English or Spanish.
- Domestic travelers account for 94.8% of guests.
- Key international markets include United States (94.8%) and United Kingdom (1.4%).
- Top languages spoken are English (70%) followed by Spanish (11.5%).
- A significant demographic segment is the Post-2000s (Gen Z/Alpha) group, representing 50% of guests.
Recommendations for Hosts
- Target domestic marketing efforts towards travelers from Reno and Las Vegas.
- Tailor amenities and listing descriptions to appeal to the dominant Post-2000s (Gen Z/Alpha) demographic (e.g., highlight fast WiFi, smart home features, local guides).
- Highlight unique local experiences or amenities relevant to the primary guest profile.
- Consider seasonal promotions aligned with peak travel times for key origin markets.
Nearby Short-Term Rental Market Comparison
How does the Ely Airbnb market stack up against its neighbors? Compare key performance metrics like average monthly revenue, ADR, and occupancy rates in surrounding areas to understand the broader regional STR landscape.
| Market | Active Properties | Monthly Revenue | Daily Rate | Avg. Occupancy |
|---|---|---|---|---|
| Baker | 18 | $2,402 | $169.62 | 52% |
| West Wendover | 11 | $2,201 | $180.96 | 42% |
| Elko | 37 | $1,792 | $168.15 | 42% |
| Spring Creek | 14 | $1,733 | $154.24 | 41% |
| Lamoille | 15 | $1,350 | $241.75 | 27% |