Beatty Airbnb Market Analysis 2026: Short Term Rental Data & Vacation Rental Statistics in Nevada, United States
Is Airbnb profitable in Beatty in 2026? Explore comprehensive Airbnb analytics for Beatty, Nevada, United States to uncover income potential. This 2026 STR market report for Beatty, based on AirROI data from February 2025 to January 2026, reveals key trends in the niche market of 33 active listings.
Whether you're considering an Airbnb investment in Beatty, optimizing your existing vacation rental, or exploring rental arbitrage opportunities, understanding the Beatty Airbnb data is crucial. Leveraging the low regulation environment is key to maximizing your short term rental income potential. Let's dive into the specifics.
Key Beatty Airbnb Performance Metrics Overview
Monthly Airbnb Revenue Variations & Income Potential in Beatty (2026)
Understanding the monthly revenue variations for Airbnb listings in Beatty is key to maximizing your short term rental income potential. Seasonality significantly impacts earnings. Our analysis, based on data from the past 12 months, shows that the peak revenue month for STRs in Beatty is typically March, while August often presents the lowest earnings, highlighting opportunities for strategic pricing adjustments during shoulder and low seasons. Explore the typical Airbnb income in Beatty across different performance tiers:
- Best-in-class properties (Top 10%) achieve $5,706+ monthly, often utilizing dynamic pricing and superior guest experiences.
- Strong performing properties (Top 25%) earn $3,661 or more, indicating effective management and desirable locations/amenities.
- Typical properties (Median) generate around $2,475 per month, representing the average market performance.
- Entry-level properties (Bottom 25%) see earnings around $1,574, often with potential for optimization.
Average Monthly Airbnb Earnings Trend in Beatty
Beatty Airbnb Occupancy Rate Trends (2026)
Maximize your bookings by understanding the Beatty STR occupancy trends. Seasonal demand shifts significantly influence how often properties are booked. Typically, Aprilsees the highest demand (peak season occupancy), while July experiences the lowest (low season). Effective strategies, like adjusting minimum stays or offering promotions, can boost occupancy during slower periods. Here's how different property tiers perform in Beatty:
- Best-in-class properties (Top 10%) achieve 84%+ occupancy, indicating high desirability and potentially optimized availability.
- Strong performing properties (Top 25%) maintain 74% or higher occupancy, suggesting good market fit and guest satisfaction.
- Typical properties (Median) have an occupancy rate around 56%.
- Entry-level properties (Bottom 25%) average 35% occupancy, potentially facing higher vacancy.
Average Monthly Occupancy Rate Trend in Beatty
Average Daily Rate (ADR) Airbnb Trends in Beatty (2026)
Effective short term rental pricing strategy in Beatty involves understanding monthly ADR fluctuations. The Average Daily Rate (ADR) for Airbnb in Beatty typically peaks in October and dips lowest during February. Leveraging Airbnb dynamic pricing tools or strategies based on this seasonality can significantly boost revenue. Here's a look at the typical nightly rates achieved:
- Best-in-class properties (Top 10%) command rates of $332+ per night, often due to premium features or locations.
- Strong performing properties (Top 25%) achieve nightly rates of $182 or more.
- Typical properties (Median) charge around $153 per night.
- Entry-level properties (Bottom 25%) earn around $124 per night.
Average Daily Rate (ADR) Trend by Month in Beatty
Get Live Beatty Market Intelligence 👇

Explore Real-time Analytics
Airbnb Seasonality Analysis & Trends in Beatty (2026)
Peak Season (March, April, February)
- Revenue averages $3,854 per month
- Occupancy rates average 71.4%
- Daily rates average $173
Shoulder Season
- Revenue averages $2,933 per month
- Occupancy maintains around 55.0%
- Daily rates hold near $180
Low Season (July, August, September)
- Revenue drops to average $2,075 per month
- Occupancy decreases to average 38.4%
- Daily rates adjust to average $181
Seasonality Insights for Beatty
- The Airbnb seasonality in Beatty shows highly seasonal trends requiring careful strategy. While the sections above show seasonal averages, it's also insightful to look at the extremes:
- During the high season, the absolute peak month showcases Beatty's highest earning potential, with monthly revenues capable of climbing to $4,293, occupancy reaching a high of 74.6%, and ADRs peaking at $187.
- Conversely, the slowest single month of the year, typically falling within the low season, marks the market's lowest point. In this month, revenue might dip to $1,955, occupancy could drop to 36.8%, and ADRs may adjust down to $168.
- Understanding both the seasonal averages and these monthly peaks and troughs in revenue, occupancy, and ADR is crucial for maximizing your Airbnb profit potential in Beatty.
Seasonal Strategies for Maximizing Profit
- Peak Season: Maximize revenue through premium pricing and potentially longer minimum stays. Ensure high availability.
- Low Season: Offer competitive pricing, special promotions (e.g., extended stay discounts), and flexible cancellation policies. Target off-season travelers like remote workers or budget-conscious guests.
- Shoulder Seasons: Implement dynamic pricing that balances peak and low rates. Target weekend travelers or specific events. Offer slightly more flexible terms than peak season.
- Regularly analyze your own performance against these Beatty seasonality benchmarks and adjust your pricing and availability strategy accordingly.
Best Areas for Airbnb Investment in Beatty (2026)
Exploring the top neighborhoods for short-term rentals in Beatty? This section highlights key areas, outlining why they are attractive for hosts and guests, along with notable local attractions. Consider these locations based on your target guest profile and investment strategy.
| Neighborhood / Area | Why Host Here? (Target Guests & Appeal) | Key Attractions & Landmarks |
|---|---|---|
| Beattie Park | A popular recreational area featuring access to scenic views and a quiet environment. Ideal for guests looking for outdoor adventures such as hiking or bird watching. | Beattie Park Mountain Views, Hiking Trails, Wildlife Watching |
| Rhyolite Ghost Town | An intriguing historical site that draws tourists interested in the Gold Rush era. Offers a unique experience for those exploring abandoned towns and local history. | Rhyolite Historical Town, Goldwell Open Air Museum, Tom Kelly's Bottle House |
| Tonalpah Historic Mining District | Rich in history and surrounded by stunning desert landscapes, this area appeals to history buffs and those interested in mining heritage. | Tonalpah Mining Museum, Historic Mining Sites, Outdoor Recreation Opportunities |
| Death Valley National Park | One of the most famous national parks in the USA, attracting visitors looking for natural beauty, unique landscapes, and outdoor activities. | Badwater Basin, Dante's View, Zabriskie Point, Mesquite Flat Sand Dunes |
| Gold Point Ghost Town | Another fascinating ghost town with a rich history, perfect for those looking to explore Nevada's mining past and get unique photographs. | Ghost Town Exploration, Photography Opportunities, Historical Sites |
| Nevada Highway 374 | A scenic drive that connects various attractions, offering guests a beautiful route through the desert with views of the area's unique geology. | Scenic Desert Views, Stops at Historic Sites, Nature Photography |
| Beatty Museum & Historical Society | A great educational resource about the local history and culture, appealing to families and history enthusiasts. | Exhibits on Local History, Artifacts from the Gold Rush, Community Events |
| Local Diners and Eateries | Offering a taste of local cuisine, these establishments are popular among travelers looking to experience authentic Nevada food. | Local Diner Specials, Unique Nevada Dishes, Friendly Atmosphere |
Understanding Airbnb License Requirements & STR Laws in Beatty (2026)
While Beatty, Nevada, United States currently shows low STR regulations, specific Airbnb license requirements might still exist or change. Always verify the latest short term rental regulations and Airbnb license requirements directly with local government authorities for Beatty to ensure full compliance before hosting.
(Source: AirROI data, 2026, finding no licensed listings among those analyzed)
Top Performing Airbnb Properties in Beatty (2026)
Benchmark your potential! Explore examples of top-performing Airbnb properties in Beattybased on Trailing Twelve Month (TTM) revenue. Analyze their characteristics, revenue, occupancy rate, and ADR to understand what drives success in this market.
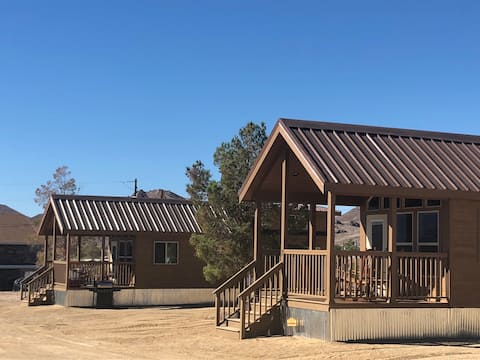
Wild West 1 + 2 - Death Valley Getaway Cabins
Entire Place • 4 bedrooms
Designed To Death
Entire Place • 3 bedrooms

Death Valley House | Desert Gold
Entire Place • 3 bedrooms

Death Valley Gateway -Suite B
Entire Place • 2 bedrooms

Wild West #1 - Death Valley Getaway Cabin
Entire Place • 2 bedrooms

Death Valley Getaway Cabin - Wild West #2
Entire Place • 2 bedrooms
Note: Performance varies based on location, size, amenities, seasonality, and management quality. Data reflects the past 12 months.
Top Performing Airbnb Hosts in Beatty (2026)
Learn from the best! This table showcases top-performing Airbnb hosts in Beatty based on the number of properties managed and estimated total revenue over the past year. Analyze their scale and performance metrics.
| Host Name | Properties | Grossing Revenue | Stay Reviews | Avg Rating |
|---|---|---|---|---|
| Jonathan | 10 | $208,639 | 227 | 4.82/5.0 |
| Ann | 3 | $177,009 | 1572 | 4.97/5.0 |
| Gavin | 3 | $86,028 | 378 | 4.91/5.0 |
| Nathaniel | 2 | $81,620 | 213 | 4.94/5.0 |
| Karen | 1 | $76,551 | 637 | 4.92/5.0 |
| Marina | 2 | $69,579 | 383 | 4.89/5.0 |
| Nigel | 1 | $64,327 | 365 | 4.79/5.0 |
| Jon | 2 | $42,134 | 46 | 4.87/5.0 |
| Thomas & Emma | 2 | $41,516 | 223 | 4.90/5.0 |
| Rose Ann | 3 | $41,287 | 440 | 4.85/5.0 |
Analyzing the strategies of top hosts, such as their property selection, pricing, and guest communication, can offer valuable lessons for optimizing your own Airbnb operations in Beatty.
Dive Deeper: Advanced Beatty STR Market Data (2026)
Ready to unlock more insights? AirROI provides access to advanced metrics and comprehensive Airbnb data for Beatty. Explore detailed analytics beyond this report to refine your investment strategy, optimize pricing, and maximize your vacation rental profits.
Explore Advanced MetricsBeatty Short-Term Rental Market Composition (2026): Property & Room Types
Room Type Distribution
Property Type Distribution
Market Composition Insights for Beatty
- The Beatty Airbnb market composition is heavily skewed towards Entire Home/Apt listings, which make up 90.9% of the 33 active rentals. This indicates strong guest preference for privacy and space.
- Looking at the property type distribution in Beatty, House properties are the most common (69.7%), reflecting the local real estate landscape.
- Houses represent a significant 69.7% portion, catering likely to families or larger groups.
- The presence of 9.1% Hotel/Boutique listings indicates integration with traditional hospitality.
- Smaller segments like apartment/condo (combined 3.0%) offer potential for unique stay experiences.
Beatty Airbnb Room Capacity Analysis (2026): Bedroom Distribution
Distribution of Listings by Number of Bedrooms
Room Capacity Insights for Beatty
- The dominant room capacity in Beatty is 2 bedrooms listings, making up 33.3% of the market. This suggests a strong demand for properties suitable for couples or solo travelers.
- Together, 2 bedrooms and 3 bedrooms properties represent 60.6% of the active Airbnb listings in Beatty, indicating a high concentration in these sizes.
- A significant 33.3% of listings offer 3+ bedrooms, catering to larger groups and families seeking more space in Beatty.
Beatty Vacation Rental Guest Capacity Trends (2026)
Distribution of Listings by Guest Capacity
Guest Capacity Insights for Beatty
- The most common guest capacity trend in Beatty vacation rentals is listings accommodating 6 guests (39.4%). This suggests the primary traveler segment is likely larger groups.
- Properties designed for 6 guests and 4 guests dominate the Beatty STR market, accounting for 60.6% of listings.
- 48.5% of properties accommodate 6+ guests, serving the market segment for larger families or group travel in Beatty.
- On average, properties in Beatty are equipped to host 4.7 guests.
Beatty Airbnb Booking Patterns (2026): Available vs. Booked Days
Available Days Distribution
Booked Days Distribution
Booking Pattern Insights for Beatty
- The most common availability pattern in Beatty falls within the 91-180 days range, representing 42.4% of listings. This suggests many properties have significant open periods on their calendars.
- Approximately 45.5% of listings show high availability (181+ days open annually), indicating potential for increased bookings or specific owner usage patterns.
- For booked days, the 181-270 days range is most frequent in Beatty (42.4%), reflecting common guest stay durations or potential owner blocking patterns.
- A notable 54.5% of properties secure long booking periods (181+ days booked per year), highlighting successful long-term rental strategies or significant owner usage.
Beatty Airbnb Minimum Stay Requirements Analysis
Distribution of Listings by Minimum Night Requirement
1 Night
25 listings
75.8% of total
2 Nights
2 listings
6.1% of total
3 Nights
1 listings
3% of total
4-6 Nights
1 listings
3% of total
7-29 Nights
3 listings
9.1% of total
30+ Nights
1 listings
3% of total
Key Insights
- The most prevalent minimum stay requirement in Beatty is 1 Night, adopted by 75.8% of listings. This highlights the market's preference for shorter, flexible bookings.
- A strong majority (81.9%) of the Beatty Airbnb data shows acceptance of very short stays (1-2 nights), indicating a dynamic, high-turnover market.
Recommendations
- Align with the market by considering a 1 Night minimum stay, as 75.8% of Beatty hosts use this setting.
- Adjust minimum nights based on seasonality – potentially shorter during low season and longer during peak demand periods in Beatty.
Beatty Airbnb Cancellation Policy Trends Analysis (2026)
Flexible
9 listings
27.3% of total
Moderate
9 listings
27.3% of total
Firm
15 listings
45.5% of total
Cancellation Policy Insights for Beatty
- The prevailing Airbnb cancellation policy trend in Beatty is Firm, used by 45.5% of listings.
- There's a relatively balanced mix between guest-friendly (54.6%) and stricter (45.5%) policies, offering choices for different guest needs.
Recommendations for Hosts
- Consider adopting a Firm policy to align with the 45.5% market standard in Beatty.
- Regularly review your cancellation policy against competitors and market demand shifts in Beatty.
Beatty STR Booking Lead Time Analysis (2026)
Average Booking Lead Time by Month
Booking Lead Time Insights for Beatty
- The overall average booking lead time for vacation rentals in Beatty is 49 days.
- Guests book furthest in advance for stays during September (average 72 days), likely coinciding with peak travel demand or local events.
- The shortest booking windows occur for stays in January (average 35 days), indicating more last-minute travel plans during this time.
- Seasonally, Fall (60 days avg.) sees the longest lead times, while Winter (45 days avg.) has the shortest, reflecting typical travel planning cycles.
Recommendations for Hosts
- Use the overall average lead time (49 days) as a baseline for your pricing and availability strategy in Beatty.
- For September stays, consider implementing length-of-stay discounts or slightly higher rates for bookings made less than 72 days out to capitalize on advance planning.
- Target marketing efforts for the Fall season well in advance (at least 60 days) to capture early planners.
- Monitor your own booking lead times against these Beatty averages to identify opportunities for dynamic pricing adjustments.
Popular & Essential Airbnb Amenities in Beatty (2026)
Amenity Prevalence
Amenity Insights for Beatty
- Essential amenities in Beatty that guests expect include: Air conditioning, Heating, Wifi, Free parking on premises. Lacking these (any) could significantly impact bookings.
- Popular amenities like Smoke alarm, Shampoo, Hot water are common but not universal. Offering these can provide a competitive edge.
Recommendations for Hosts
- Ensure your listing includes all essential amenities for Beatty: Air conditioning, Heating, Wifi, Free parking on premises.
- Prioritize adding missing essentials: Free parking on premises.
- Consider adding popular differentiators like Smoke alarm or Shampoo to increase appeal.
- Highlight unique or less common amenities you offer (e.g., hot tub, dedicated workspace, EV charger) in your listing description and photos.
- Regularly check competitor amenities in Beatty to stay competitive.
Beatty Airbnb Guest Demographics & Profile Analysis (2026)
Guest Profile Summary for Beatty
- The typical guest profile for Airbnb in Beatty consists of primarily domestic travelers (78%), often arriving from nearby Los Angeles, typically belonging to the Post-2000s (Gen Z/Alpha) group (50%), primarily speaking English or Spanish.
- Domestic travelers account for 78.4% of guests.
- Key international markets include United States (78.4%) and Germany (3.1%).
- Top languages spoken are English (60.2%) followed by Spanish (9.7%).
- A significant demographic segment is the Post-2000s (Gen Z/Alpha) group, representing 50% of guests.
Recommendations for Hosts
- Target domestic marketing efforts towards travelers from Los Angeles and New York.
- Tailor amenities and listing descriptions to appeal to the dominant Post-2000s (Gen Z/Alpha) demographic (e.g., highlight fast WiFi, smart home features, local guides).
- Highlight unique local experiences or amenities relevant to the primary guest profile.
- Consider seasonal promotions aligned with peak travel times for key origin markets.
Nearby Short-Term Rental Market Comparison
How does the Beatty Airbnb market stack up against its neighbors? Compare key performance metrics like average monthly revenue, ADR, and occupancy rates in surrounding areas to understand the broader regional STR landscape.
| Market | Active Properties | Monthly Revenue | Daily Rate | Avg. Occupancy |
|---|---|---|---|---|
| Henderson | 556 | $3,516 | $279.73 | 46% |
| North Las Vegas | 1,228 | $3,041 | $262.16 | 45% |
| Tecopa | 12 | $2,907 | $252.47 | 47% |
| Paradise | 3,676 | $2,741 | $282.34 | 41% |
| Spring Valley | 1,619 | $2,738 | $265.75 | 43% |
| Enterprise | 14 | $2,401 | $247.10 | 40% |
| Amargosa Valley | 22 | $2,332 | $178.53 | 44% |
| Summerlin South | 40 | $2,140 | $210.92 | 44% |
| Las Vegas | 3,340 | $2,120 | $243.54 | 40% |
| Sunrise Manor | 293 | $1,778 | $198.09 | 39% |