Amargosa Valley Airbnb Market Analysis 2026: Short Term Rental Data & Vacation Rental Statistics in Nevada, United States
Is Airbnb profitable in Amargosa Valley in 2026? Explore comprehensive Airbnb analytics for Amargosa Valley, Nevada, United States to uncover income potential. This 2026 STR market report for Amargosa Valley, based on AirROI data from February 2025 to January 2026, reveals key trends in the niche market of 22 active listings.
Whether you're considering an Airbnb investment in Amargosa Valley, optimizing your existing vacation rental, or exploring rental arbitrage opportunities, understanding the Amargosa Valley Airbnb data is crucial. Leveraging the low regulation environment is key to maximizing your short term rental income potential. Let's dive into the specifics.
Key Amargosa Valley Airbnb Performance Metrics Overview
Monthly Airbnb Revenue Variations & Income Potential in Amargosa Valley (2026)
Understanding the monthly revenue variations for Airbnb listings in Amargosa Valley is key to maximizing your short term rental income potential. Seasonality significantly impacts earnings. Our analysis, based on data from the past 12 months, shows that the peak revenue month for STRs in Amargosa Valley is typically March, while August often presents the lowest earnings, highlighting opportunities for strategic pricing adjustments during shoulder and low seasons. Explore the typical Airbnb income in Amargosa Valley across different performance tiers:
- Best-in-class properties (Top 10%) achieve $5,457+ monthly, often utilizing dynamic pricing and superior guest experiences.
- Strong performing properties (Top 25%) earn $3,595 or more, indicating effective management and desirable locations/amenities.
- Typical properties (Median) generate around $2,368 per month, representing the average market performance.
- Entry-level properties (Bottom 25%) see earnings around $957, often with potential for optimization.
Average Monthly Airbnb Earnings Trend in Amargosa Valley
Amargosa Valley Airbnb Occupancy Rate Trends (2026)
Maximize your bookings by understanding the Amargosa Valley STR occupancy trends. Seasonal demand shifts significantly influence how often properties are booked. Typically, Marchsees the highest demand (peak season occupancy), while June experiences the lowest (low season). Effective strategies, like adjusting minimum stays or offering promotions, can boost occupancy during slower periods. Here's how different property tiers perform in Amargosa Valley:
- Best-in-class properties (Top 10%) achieve 74%+ occupancy, indicating high desirability and potentially optimized availability.
- Strong performing properties (Top 25%) maintain 61% or higher occupancy, suggesting good market fit and guest satisfaction.
- Typical properties (Median) have an occupancy rate around 43%.
- Entry-level properties (Bottom 25%) average 28% occupancy, potentially facing higher vacancy.
Average Monthly Occupancy Rate Trend in Amargosa Valley
Average Daily Rate (ADR) Airbnb Trends in Amargosa Valley (2026)
Effective short term rental pricing strategy in Amargosa Valley involves understanding monthly ADR fluctuations. The Average Daily Rate (ADR) for Airbnb in Amargosa Valley typically peaks in December and dips lowest during February. Leveraging Airbnb dynamic pricing tools or strategies based on this seasonality can significantly boost revenue. Here's a look at the typical nightly rates achieved:
- Best-in-class properties (Top 10%) command rates of $307+ per night, often due to premium features or locations.
- Strong performing properties (Top 25%) achieve nightly rates of $210 or more.
- Typical properties (Median) charge around $143 per night.
- Entry-level properties (Bottom 25%) earn around $66 per night.
Average Daily Rate (ADR) Trend by Month in Amargosa Valley
Get Live Amargosa Valley Market Intelligence 👇

Explore Real-time Analytics
Airbnb Seasonality Analysis & Trends in Amargosa Valley (2026)
Peak Season (March, February, April)
- Revenue averages $3,787 per month
- Occupancy rates average 63.2%
- Daily rates average $150
Shoulder Season
- Revenue averages $2,555 per month
- Occupancy maintains around 40.8%
- Daily rates hold near $173
Low Season (June, July, August)
- Revenue drops to average $1,829 per month
- Occupancy decreases to average 30.8%
- Daily rates adjust to average $151
Seasonality Insights for Amargosa Valley
- The Airbnb seasonality in Amargosa Valley shows highly seasonal trends requiring careful strategy. While the sections above show seasonal averages, it's also insightful to look at the extremes:
- During the high season, the absolute peak month showcases Amargosa Valley's highest earning potential, with monthly revenues capable of climbing to $4,208, occupancy reaching a high of 70.8%, and ADRs peaking at $181.
- Conversely, the slowest single month of the year, typically falling within the low season, marks the market's lowest point. In this month, revenue might dip to $1,774, occupancy could drop to 30.4%, and ADRs may adjust down to $146.
- Understanding both the seasonal averages and these monthly peaks and troughs in revenue, occupancy, and ADR is crucial for maximizing your Airbnb profit potential in Amargosa Valley.
Seasonal Strategies for Maximizing Profit
- Peak Season: Maximize revenue through premium pricing and potentially longer minimum stays. Ensure high availability.
- Low Season: Offer competitive pricing, special promotions (e.g., extended stay discounts), and flexible cancellation policies. Target off-season travelers like remote workers or budget-conscious guests.
- Shoulder Seasons: Implement dynamic pricing that balances peak and low rates. Target weekend travelers or specific events. Offer slightly more flexible terms than peak season.
- Regularly analyze your own performance against these Amargosa Valley seasonality benchmarks and adjust your pricing and availability strategy accordingly.
Best Areas for Airbnb Investment in Amargosa Valley (2026)
Exploring the top neighborhoods for short-term rentals in Amargosa Valley? This section highlights key areas, outlining why they are attractive for hosts and guests, along with notable local attractions. Consider these locations based on your target guest profile and investment strategy.
| Neighborhood / Area | Why Host Here? (Target Guests & Appeal) | Key Attractions & Landmarks |
|---|---|---|
| Death Valley National Park | A popular destination for nature lovers and adventure seekers, known for its dramatic landscapes, hiking trails, and unique geological features. Ideal for tourists looking to experience the stark beauty of the desert. | Badwater Basin, Dante's View, Zabriskie Point, Mesquite Flat Sand Dunes, Golden Canyon, Devil's Golf Course |
| Amargosa Opera House | A historical venue that attracts visitors interested in arts and culture, hosting various performances and events. It provides a unique local experience for travelers. | Amargosa Opera House & Hotel, Art Gallery, Performances and Events |
| Nevada State Route 373 | Route 373 serves as a scenic drive for visitors and is the gateway to nearby attractions, making it an ideal location for stopover stays. | Scenic views of the desert, Access to Death Valley, Local diner experiences |
| Rhyolite Ghost Town | An intriguing historic site for tourists interested in ghost towns and gold rush history. Offers unique photo opportunities and insight into the past. | Rhyolite Ghost Town ruins, Goldwell Open Air Museum, Bullfrog Mine |
| Pahrump | A nearby town providing additional amenities and attractions for visitors. Popular for its proximity to natural parks and recreational facilities. | Pahrump Valley Winery, Spring Mountain Motorsports Ranch, Pahrump Nugget Hotel and Casino |
| Ash Meadows National Wildlife Refuge | Known for its diverse ecosystems and rare species, this area offers opportunities for wildlife viewing and outdoor activities, appealing to nature enthusiasts. | Crystal Reservoir, Devils Hole, Wetlands Trails |
| Sandy Valley | A quiet area ideal for guests looking for a peaceful retreat, surrounded by stunning desert landscapes and offering outdoor adventures. | Sandy Valley Ranch, Hiking and Biking Trails |
| Yermo | A small community that serves as a stop for travelers heading to various attractions in the area, providing simple accommodations and experiences. | Calico Ghost Town, Route 66 attractions, Local diner experiences |
Understanding Airbnb License Requirements & STR Laws in Amargosa Valley (2026)
While Amargosa Valley, Nevada, United States currently shows low STR regulations, specific Airbnb license requirements might still exist or change. Always verify the latest short term rental regulations and Airbnb license requirements directly with local government authorities for Amargosa Valley to ensure full compliance before hosting.
(Source: AirROI data, 2026, finding no licensed listings among those analyzed)
Top Performing Airbnb Properties in Amargosa Valley (2026)
Benchmark your potential! Explore examples of top-performing Airbnb properties in Amargosa Valleybased on Trailing Twelve Month (TTM) revenue. Analyze their characteristics, revenue, occupancy rate, and ADR to understand what drives success in this market.
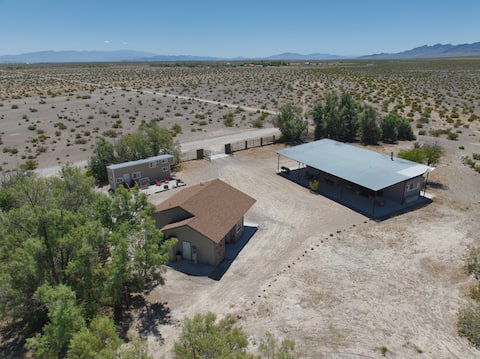
Retreat, Large Groups, 3 Houses on Acreage
Entire Place • 5 bedrooms

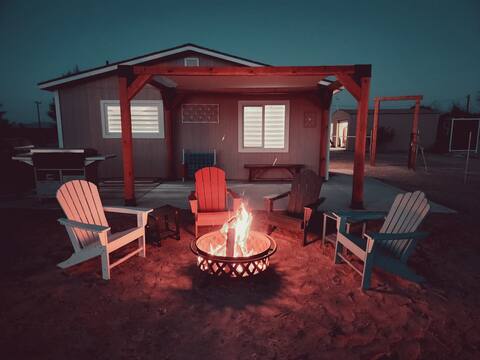
Secluded Western Retreat Near DVNP, EV Charger
Entire Place • 3 bedrooms
Desert Retreat with a View near Death Valley
Entire Place • 2 bedrooms
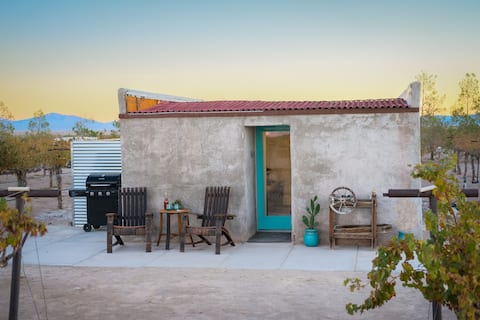
Vineyard Bottling Room outside of Death Valley NP
Entire Place • 1 bedroom
Million Dollar View near Death Valley*Amenities*
Entire Place • 2 bedrooms

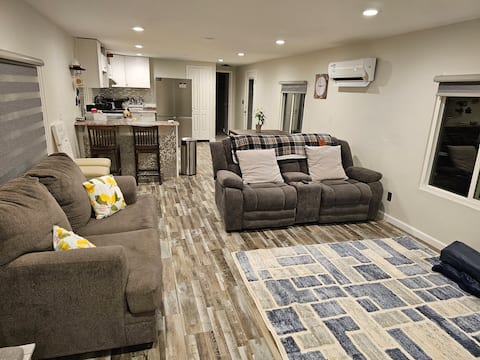
Stunning New House by Death Valley, Amazing Views!
Entire Place • 1 bedroom
Note: Performance varies based on location, size, amenities, seasonality, and management quality. Data reflects the past 12 months.
Top Performing Airbnb Hosts in Amargosa Valley (2026)
Learn from the best! This table showcases top-performing Airbnb hosts in Amargosa Valley based on the number of properties managed and estimated total revenue over the past year. Analyze their scale and performance metrics.
| Host Name | Properties | Grossing Revenue | Stay Reviews | Avg Rating |
|---|---|---|---|---|
| Misty | 7 | $343,938 | 556 | 4.97/5.0 |
| Brandon | 9 | $170,811 | 738 | 4.93/5.0 |
| Mary | 2 | $55,054 | 427 | 4.96/5.0 |
| Jon | 1 | $30,658 | 103 | 4.89/5.0 |
| Stanford | 2 | $15,164 | 49 | 4.70/5.0 |
| Michaela | 1 | $98 | 23 | 4.43/5.0 |
Analyzing the strategies of top hosts, such as their property selection, pricing, and guest communication, can offer valuable lessons for optimizing your own Airbnb operations in Amargosa Valley.
Dive Deeper: Advanced Amargosa Valley STR Market Data (2026)
Ready to unlock more insights? AirROI provides access to advanced metrics and comprehensive Airbnb data for Amargosa Valley. Explore detailed analytics beyond this report to refine your investment strategy, optimize pricing, and maximize your vacation rental profits.
Explore Advanced MetricsAmargosa Valley Short-Term Rental Market Composition (2026): Property & Room Types
Room Type Distribution
Property Type Distribution
Market Composition Insights for Amargosa Valley
- The Amargosa Valley Airbnb market composition is heavily skewed towards Entire Home/Apt listings, which make up 100% of the 22 active rentals. This indicates strong guest preference for privacy and space.
- Looking at the property type distribution in Amargosa Valley, House properties are the most common (50%), reflecting the local real estate landscape.
- Houses represent a significant 50% portion, catering likely to families or larger groups.
- Smaller segments like hotel/boutique (combined 4.5%) offer potential for unique stay experiences.
Amargosa Valley Airbnb Room Capacity Analysis (2026): Bedroom Distribution
Distribution of Listings by Number of Bedrooms
Room Capacity Insights for Amargosa Valley
- The dominant room capacity in Amargosa Valley is 1 bedroom listings, making up 40.9% of the market. This suggests a strong demand for properties suitable for couples or solo travelers.
- Together, 1 bedroom and 3 bedrooms properties represent 59.1% of the active Airbnb listings in Amargosa Valley, indicating a high concentration in these sizes.
- A significant 22.7% of listings offer 3+ bedrooms, catering to larger groups and families seeking more space in Amargosa Valley.
Amargosa Valley Vacation Rental Guest Capacity Trends (2026)
Distribution of Listings by Guest Capacity
Guest Capacity Insights for Amargosa Valley
- The most common guest capacity trend in Amargosa Valley vacation rentals is listings accommodating 2 guests (50%). This suggests the primary traveler segment is likely couples or solo travelers.
- Properties designed for 2 guests and 4 guests dominate the Amargosa Valley STR market, accounting for 72.7% of listings.
- A significant 50.0% of listings cater specifically to 1-2 guests, highlighting strong demand from couples and solo travelers in Amargosa Valley.
- 27.2% of properties accommodate 6+ guests, serving the market segment for larger families or group travel in Amargosa Valley.
- On average, properties in Amargosa Valley are equipped to host 4.0 guests.
Amargosa Valley Airbnb Booking Patterns (2026): Available vs. Booked Days
Available Days Distribution
Booked Days Distribution
Booking Pattern Insights for Amargosa Valley
- The most common availability pattern in Amargosa Valley falls within the 181-270 days range, representing 40.9% of listings. This suggests many properties have significant open periods on their calendars.
- Approximately 68.2% of listings show high availability (181+ days open annually), indicating potential for increased bookings or specific owner usage patterns.
- For booked days, the 91-180 days range is most frequent in Amargosa Valley (40.9%), reflecting common guest stay durations or potential owner blocking patterns.
- A notable 31.8% of properties secure long booking periods (181+ days booked per year), highlighting successful long-term rental strategies or significant owner usage.
Amargosa Valley Airbnb Minimum Stay Requirements Analysis
Distribution of Listings by Minimum Night Requirement
1 Night
13 listings
59.1% of total
2 Nights
2 listings
9.1% of total
30+ Nights
7 listings
31.8% of total
Key Insights
- The most prevalent minimum stay requirement in Amargosa Valley is 1 Night, adopted by 59.1% of listings. This highlights the market's preference for shorter, flexible bookings.
- A strong majority (68.2%) of the Amargosa Valley Airbnb data shows acceptance of very short stays (1-2 nights), indicating a dynamic, high-turnover market.
- A significant segment (31.8%) caters to monthly stays (30+ nights) in Amargosa Valley, pointing to opportunities in the extended-stay market.
Recommendations
- Align with the market by considering a 1 Night minimum stay, as 59.1% of Amargosa Valley hosts use this setting.
- Explore offering discounts for stays of 30+ nights to attract the 31.8% of the market seeking extended stays.
- Adjust minimum nights based on seasonality – potentially shorter during low season and longer during peak demand periods in Amargosa Valley.
Amargosa Valley Airbnb Cancellation Policy Trends Analysis (2026)
Flexible
4 listings
18.2% of total
Moderate
1 listings
4.5% of total
Firm
17 listings
77.3% of total
Cancellation Policy Insights for Amargosa Valley
- The prevailing Airbnb cancellation policy trend in Amargosa Valley is Firm, used by 77.3% of listings.
- A majority (77.3%) of hosts in Amargosa Valley utilize Firm or Strict policies, indicating a market where hosts prioritize booking security.
Recommendations for Hosts
- Consider adopting a Firm policy to align with the 77.3% market standard in Amargosa Valley.
- Regularly review your cancellation policy against competitors and market demand shifts in Amargosa Valley.
Amargosa Valley STR Booking Lead Time Analysis (2026)
Average Booking Lead Time by Month
Booking Lead Time Insights for Amargosa Valley
- The overall average booking lead time for vacation rentals in Amargosa Valley is 48 days.
- Guests book furthest in advance for stays during November (average 63 days), likely coinciding with peak travel demand or local events.
- The shortest booking windows occur for stays in January (average 34 days), indicating more last-minute travel plans during this time.
- Seasonally, Fall (56 days avg.) sees the longest lead times, while Winter (40 days avg.) has the shortest, reflecting typical travel planning cycles.
Recommendations for Hosts
- Use the overall average lead time (48 days) as a baseline for your pricing and availability strategy in Amargosa Valley.
- For November stays, consider implementing length-of-stay discounts or slightly higher rates for bookings made less than 63 days out to capitalize on advance planning.
- Target marketing efforts for the Fall season well in advance (at least 56 days) to capture early planners.
- Monitor your own booking lead times against these Amargosa Valley averages to identify opportunities for dynamic pricing adjustments.
Popular & Essential Airbnb Amenities in Amargosa Valley (2026)
Amenity Prevalence
Amenity Insights for Amargosa Valley
- Essential amenities in Amargosa Valley that guests expect include: Free parking on premises, Microwave, Dining table. Lacking these (any) could significantly impact bookings.
- Popular amenities like Wifi, Refrigerator, Dishes and silverware are common but not universal. Offering these can provide a competitive edge.
- Warning: Wifi is not universally provided but is considered essential globally. Ensure reliable Wifi is offered.
Recommendations for Hosts
- Ensure your listing includes all essential amenities for Amargosa Valley: Free parking on premises, Microwave, Dining table.
- Prioritize adding missing essentials: Microwave, Dining table.
- Consider adding popular differentiators like Wifi or Refrigerator to increase appeal.
- Highlight unique or less common amenities you offer (e.g., hot tub, dedicated workspace, EV charger) in your listing description and photos.
- Regularly check competitor amenities in Amargosa Valley to stay competitive.
Amargosa Valley Airbnb Guest Demographics & Profile Analysis (2026)
Guest Profile Summary for Amargosa Valley
- The typical guest profile for Airbnb in Amargosa Valley consists of primarily domestic travelers (79%), often arriving from nearby Los Angeles, typically belonging to the Post-2000s (Gen Z/Alpha) group (50%), primarily speaking English or French.
- Domestic travelers account for 79.3% of guests.
- Key international markets include United States (79.3%) and United Kingdom (3.9%).
- Top languages spoken are English (54%) followed by French (9.5%).
- A significant demographic segment is the Post-2000s (Gen Z/Alpha) group, representing 50% of guests.
Recommendations for Hosts
- Target domestic marketing efforts towards travelers from Los Angeles and New York.
- Tailor amenities and listing descriptions to appeal to the dominant Post-2000s (Gen Z/Alpha) demographic (e.g., highlight fast WiFi, smart home features, local guides).
- Highlight unique local experiences or amenities relevant to the primary guest profile.
- Consider seasonal promotions aligned with peak travel times for key origin markets.
Nearby Short-Term Rental Market Comparison
How does the Amargosa Valley Airbnb market stack up against its neighbors? Compare key performance metrics like average monthly revenue, ADR, and occupancy rates in surrounding areas to understand the broader regional STR landscape.
| Market | Active Properties | Monthly Revenue | Daily Rate | Avg. Occupancy |
|---|---|---|---|---|
| Henderson | 556 | $3,516 | $279.73 | 46% |
| North Las Vegas | 1,228 | $3,041 | $262.16 | 45% |
| Tecopa | 12 | $2,907 | $252.47 | 47% |
| Paradise | 3,676 | $2,741 | $282.34 | 41% |
| Spring Valley | 1,619 | $2,738 | $265.75 | 43% |
| Beatty | 33 | $2,484 | $179.16 | 54% |
| Enterprise | 14 | $2,401 | $247.10 | 40% |
| Summerlin South | 40 | $2,140 | $210.92 | 44% |
| Las Vegas | 3,340 | $2,120 | $243.54 | 40% |
| Sunrise Manor | 293 | $1,778 | $198.09 | 39% |