Omaha Airbnb Market Analysis 2026: Short Term Rental Data & Vacation Rental Statistics in Nebraska, United States
Is Airbnb profitable in Omaha in 2026? Explore comprehensive Airbnb analytics for Omaha, Nebraska, United States to uncover income potential. This 2026 STR market report for Omaha, based on AirROI data from February 2025 to January 2026, reveals key trends in the bustling market of 1,232 active listings.
Whether you're considering an Airbnb investment in Omaha, optimizing your existing vacation rental, or exploring rental arbitrage opportunities, understanding the Omaha Airbnb data is crucial. Leveraging the low regulation environment is key to maximizing your short term rental income potential. Let's dive into the specifics.
Key Omaha Airbnb Performance Metrics Overview
Monthly Airbnb Revenue Variations & Income Potential in Omaha (2026)
Understanding the monthly revenue variations for Airbnb listings in Omaha is key to maximizing your short term rental income potential. Seasonality significantly impacts earnings. Our analysis, based on data from the past 12 months, shows that the peak revenue month for STRs in Omaha is typically June, while February often presents the lowest earnings, highlighting opportunities for strategic pricing adjustments during shoulder and low seasons. Explore the typical Airbnb income in Omaha across different performance tiers:
- Best-in-class properties (Top 10%) achieve $5,484+ monthly, often utilizing dynamic pricing and superior guest experiences.
- Strong performing properties (Top 25%) earn $3,464 or more, indicating effective management and desirable locations/amenities.
- Typical properties (Median) generate around $1,921 per month, representing the average market performance.
- Entry-level properties (Bottom 25%) see earnings around $947, often with potential for optimization.
Average Monthly Airbnb Earnings Trend in Omaha
Omaha Airbnb Occupancy Rate Trends (2026)
Maximize your bookings by understanding the Omaha STR occupancy trends. Seasonal demand shifts significantly influence how often properties are booked. Typically, Junesees the highest demand (peak season occupancy), while January experiences the lowest (low season). Effective strategies, like adjusting minimum stays or offering promotions, can boost occupancy during slower periods. Here's how different property tiers perform in Omaha:
- Best-in-class properties (Top 10%) achieve 79%+ occupancy, indicating high desirability and potentially optimized availability.
- Strong performing properties (Top 25%) maintain 62% or higher occupancy, suggesting good market fit and guest satisfaction.
- Typical properties (Median) have an occupancy rate around 42%.
- Entry-level properties (Bottom 25%) average 22% occupancy, potentially facing higher vacancy.
Average Monthly Occupancy Rate Trend in Omaha
Average Daily Rate (ADR) Airbnb Trends in Omaha (2026)
Effective short term rental pricing strategy in Omaha involves understanding monthly ADR fluctuations. The Average Daily Rate (ADR) for Airbnb in Omaha typically peaks in June and dips lowest during February. Leveraging Airbnb dynamic pricing tools or strategies based on this seasonality can significantly boost revenue. Here's a look at the typical nightly rates achieved:
- Best-in-class properties (Top 10%) command rates of $352+ per night, often due to premium features or locations.
- Strong performing properties (Top 25%) achieve nightly rates of $226 or more.
- Typical properties (Median) charge around $144 per night.
- Entry-level properties (Bottom 25%) earn around $91 per night.
Average Daily Rate (ADR) Trend by Month in Omaha
Get Live Omaha Market Intelligence 👇

Explore Real-time Analytics
Airbnb Seasonality Analysis & Trends in Omaha (2026)
Peak Season (June, July, May)
- Revenue averages $3,526 per month
- Occupancy rates average 48.4%
- Daily rates average $212
Shoulder Season
- Revenue averages $2,551 per month
- Occupancy maintains around 43.3%
- Daily rates hold near $186
Low Season (January, February, April)
- Revenue drops to average $1,841 per month
- Occupancy decreases to average 37.2%
- Daily rates adjust to average $172
Seasonality Insights for Omaha
- The Airbnb seasonality in Omaha shows highly seasonal trends requiring careful strategy. While the sections above show seasonal averages, it's also insightful to look at the extremes:
- During the high season, the absolute peak month showcases Omaha's highest earning potential, with monthly revenues capable of climbing to $4,360, occupancy reaching a high of 52.4%, and ADRs peaking at $249.
- Conversely, the slowest single month of the year, typically falling within the low season, marks the market's lowest point. In this month, revenue might dip to $1,657, occupancy could drop to 29.9%, and ADRs may adjust down to $159.
- Understanding both the seasonal averages and these monthly peaks and troughs in revenue, occupancy, and ADR is crucial for maximizing your Airbnb profit potential in Omaha.
Seasonal Strategies for Maximizing Profit
- Peak Season: Maximize revenue through premium pricing and potentially longer minimum stays. Ensure high availability.
- Low Season: Offer competitive pricing, special promotions (e.g., extended stay discounts), and flexible cancellation policies. Target off-season travelers like remote workers or budget-conscious guests.
- Shoulder Seasons: Implement dynamic pricing that balances peak and low rates. Target weekend travelers or specific events. Offer slightly more flexible terms than peak season.
- Regularly analyze your own performance against these Omaha seasonality benchmarks and adjust your pricing and availability strategy accordingly.
Best Areas for Airbnb Investment in Omaha (2026)
Exploring the top neighborhoods for short-term rentals in Omaha? This section highlights key areas, outlining why they are attractive for hosts and guests, along with notable local attractions. Consider these locations based on your target guest profile and investment strategy.
| Neighborhood / Area | Why Host Here? (Target Guests & Appeal) | Key Attractions & Landmarks |
|---|---|---|
| Old Market | Historic district known for its cobblestone streets, unique shops, and vibrant dining scene. A prime area for tourists looking for culture and nightlife. | Omaha Community Playhouse, Henry Doorly Zoo, Omaha's Old Market, Durham Museum, The Orpheum Theater |
| Aksarben Village | Trendy neighborhood with a mix of residential, commercial, and entertainment options. Popular with young professionals and families, it's great for both short and long term stays. | Aksarben Cinema, The Back to the 80s Bar, Omaha Community Foundation, Stinson Park, The Blackstone District |
| Midtown Crossing | A modern mixed-use development with retail, dining, and entertainment options. Attractive to those seeking a lively urban environment close to downtown. | Midtown Crossing Park, Omaha Community Playhouse, Farnam Street shops, Great Plains Indian Museum, Local restaurants and cafes |
| Downtown Omaha | The heart of Omaha with a thriving business district, attractions, and events. Excellent for tourists and business travelers alike. | TD Ameritrade Park, The Old Market, Omaha Children's Museum, Orpheum Theater, Omaha's Henry Doorly Zoo |
| Blackstone District | Hip neighborhood with a historic feel and a burgeoning food scene. Popular among young people and foodies. | Blackstone Bistro, Kettle Eatery, Mangalitsa Restaurant, Saddle Creek Records, Local craft breweries |
| West Omaha | Family-friendly area with a mix of suburban living and great schools. Ideal for longer stays and family travelers. | Westroads Mall, Omaha's Henry Doorly Zoo, La Vista Falls Golf Course, Lake Zorinsky, Local parks and recreation areas |
| Council Bluffs | Just across the river, it offers affordable accommodations and access to Omaha attractions. Good for budget travelers looking for nearby options. | Harrah's Casino, Council Bluffs Historic District, Lake Manawa State Park, Pottawattamie County Squirrel Cage Jail, Local parks and trails |
| South Omaha | Rich in culture, particularly Hispanic culture, and known for affordable stays and delicious food. Great for those seeking authentic experiences. | South Omaha's historic neighborhoods, Local taquerias, The Omaha Community Center, Benson Historic District, Kiewit Luminarium |
Understanding Airbnb License Requirements & STR Laws in Omaha (2026)
While Omaha, Nebraska, United States currently shows low STR regulations, specific Airbnb license requirements might still exist or change. Always verify the latest short term rental regulations and Airbnb license requirements directly with local government authorities for Omaha to ensure full compliance before hosting.
(Source: AirROI data, 2026, based on 0% licensed listings)
Top Performing Airbnb Properties in Omaha (2026)
Benchmark your potential! Explore examples of top-performing Airbnb properties in Omahabased on Trailing Twelve Month (TTM) revenue. Analyze their characteristics, revenue, occupancy rate, and ADR to understand what drives success in this market.
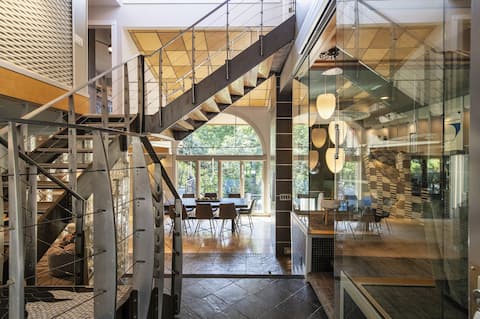
Skyline Villa Indoor Pool
Entire Place • 6 bedrooms

Ultimate Holiday Retreat & Reunion Destination+
Entire Place • 9 bedrooms
The Downtown Omaha Oasis
Entire Place • 6 bedrooms

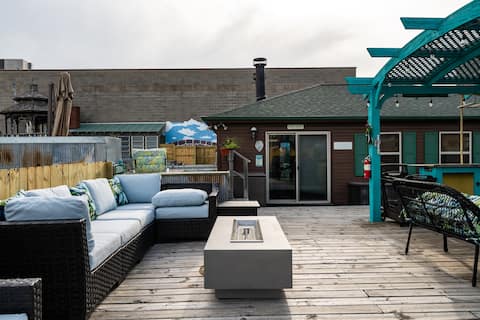
Golf Oasis Sleeps 22 Hot tub Firepit Gym Pool
Entire Place • 5 bedrooms

👙☀️🏊♀️HEATED POOL | PRIVATE ESTATE | OUTDOOR BAR🌹🌺🌳
Entire Place • 5 bedrooms

Luxury Stay, Prime Spot, Games, BBQ & Fenced Yard
Entire Place • 6 bedrooms
Note: Performance varies based on location, size, amenities, seasonality, and management quality. Data reflects the past 12 months.
Top Performing Airbnb Hosts in Omaha (2026)
Learn from the best! This table showcases top-performing Airbnb hosts in Omaha based on the number of properties managed and estimated total revenue over the past year. Analyze their scale and performance metrics.
| Host Name | Properties | Grossing Revenue | Stay Reviews | Avg Rating |
|---|---|---|---|---|
| Jireh | 33 | $1,603,218 | 2089 | 4.89/5.0 |
| Dan | 22 | $921,240 | 899 | 4.70/5.0 |
| Benjamin | 58 | $857,073 | 822 | 4.71/5.0 |
| Meghan | 5 | $606,208 | 801 | 4.88/5.0 |
| Maria | 7 | $559,957 | 640 | 4.97/5.0 |
| Elizabeth | 36 | $558,195 | 2347 | 4.85/5.0 |
| Jason | 13 | $361,203 | 175 | 4.88/5.0 |
| Joanne | 17 | $360,921 | 1364 | 4.86/5.0 |
| Jeri | 5 | $295,097 | 507 | 4.93/5.0 |
| Lindy | 3 | $273,828 | 93 | 4.75/5.0 |
Analyzing the strategies of top hosts, such as their property selection, pricing, and guest communication, can offer valuable lessons for optimizing your own Airbnb operations in Omaha.
Dive Deeper: Advanced Omaha STR Market Data (2026)
Ready to unlock more insights? AirROI provides access to advanced metrics and comprehensive Airbnb data for Omaha. Explore detailed analytics beyond this report to refine your investment strategy, optimize pricing, and maximize your vacation rental profits.
Explore Advanced MetricsOmaha Short-Term Rental Market Composition (2026): Property & Room Types
Room Type Distribution
Property Type Distribution
Market Composition Insights for Omaha
- The Omaha Airbnb market composition is heavily skewed towards Entire Home/Apt listings, which make up 88% of the 1,232 active rentals. This indicates strong guest preference for privacy and space.
- Looking at the property type distribution in Omaha, House properties are the most common (64.8%), reflecting the local real estate landscape.
- Houses represent a significant 64.8% portion, catering likely to families or larger groups.
- Smaller segments like others, hotel/boutique, outdoor/unique (combined 3.8%) offer potential for unique stay experiences.
Omaha Airbnb Room Capacity Analysis (2026): Bedroom Distribution
Distribution of Listings by Number of Bedrooms
Room Capacity Insights for Omaha
- The dominant room capacity in Omaha is 1 bedroom listings, making up 24.8% of the market. This suggests a strong demand for properties suitable for couples or solo travelers.
- Together, 1 bedroom and 2 bedrooms properties represent 44.8% of the active Airbnb listings in Omaha, indicating a high concentration in these sizes.
- A significant 41.8% of listings offer 3+ bedrooms, catering to larger groups and families seeking more space in Omaha.
Omaha Vacation Rental Guest Capacity Trends (2026)
Distribution of Listings by Guest Capacity
Guest Capacity Insights for Omaha
- The most common guest capacity trend in Omaha vacation rentals is listings accommodating 8+ guests (26.9%). This suggests the primary traveler segment is likely larger groups.
- Properties designed for 8+ guests and 4 guests dominate the Omaha STR market, accounting for 43.9% of listings.
- 45.5% of properties accommodate 6+ guests, serving the market segment for larger families or group travel in Omaha.
- On average, properties in Omaha are equipped to host 4.7 guests.
Omaha Airbnb Booking Patterns (2026): Available vs. Booked Days
Available Days Distribution
Booked Days Distribution
Booking Pattern Insights for Omaha
- The most common availability pattern in Omaha falls within the 271-366 days range, representing 47% of listings. This suggests many properties have significant open periods on their calendars.
- Approximately 80.0% of listings show high availability (181+ days open annually), indicating potential for increased bookings or specific owner usage patterns.
- For booked days, the 91-180 days range is most frequent in Omaha (33.8%), reflecting common guest stay durations or potential owner blocking patterns.
- A notable 21.1% of properties secure long booking periods (181+ days booked per year), highlighting successful long-term rental strategies or significant owner usage.
Omaha Airbnb Minimum Stay Requirements Analysis
Distribution of Listings by Minimum Night Requirement
1 Night
335 listings
27.2% of total
2 Nights
330 listings
26.8% of total
3 Nights
60 listings
4.9% of total
4-6 Nights
58 listings
4.7% of total
7-29 Nights
138 listings
11.2% of total
30+ Nights
311 listings
25.2% of total
Key Insights
- The most prevalent minimum stay requirement in Omaha is 1 Night, adopted by 27.2% of listings. This highlights the market's preference for shorter, flexible bookings.
- A significant segment (25.2%) caters to monthly stays (30+ nights) in Omaha, pointing to opportunities in the extended-stay market.
Recommendations
- Align with the market by considering a 1 Night minimum stay, as 27.2% of Omaha hosts use this setting.
- If feasible, allowing 1-night stays, especially midweek or during low season, could capture last-minute bookings, as only 27.2% currently do.
- Explore offering discounts for stays of 30+ nights to attract the 25.2% of the market seeking extended stays.
- Adjust minimum nights based on seasonality – potentially shorter during low season and longer during peak demand periods in Omaha.
Omaha Airbnb Cancellation Policy Trends Analysis (2026)
Super Strict 60 Days
3 listings
0.2% of total
Limited
6 listings
0.5% of total
Super Strict 30 Days
5 listings
0.4% of total
Refundable
1 listings
0.1% of total
Flexible
236 listings
19.2% of total
Moderate
425 listings
34.6% of total
Firm
420 listings
34.2% of total
Strict
131 listings
10.7% of total
Cancellation Policy Insights for Omaha
- The prevailing Airbnb cancellation policy trend in Omaha is Moderate, used by 34.6% of listings.
- There's a relatively balanced mix between guest-friendly (53.8%) and stricter (44.9%) policies, offering choices for different guest needs.
Recommendations for Hosts
- Consider adopting a Moderate policy to align with the 34.6% market standard in Omaha.
- Using a Strict policy might deter some guests, as only 10.7% of listings use it. Evaluate if potential revenue protection outweighs possible lower booking rates.
- Regularly review your cancellation policy against competitors and market demand shifts in Omaha.
Omaha STR Booking Lead Time Analysis (2026)
Average Booking Lead Time by Month
Booking Lead Time Insights for Omaha
- The overall average booking lead time for vacation rentals in Omaha is 37 days.
- Guests book furthest in advance for stays during May (average 61 days), likely coinciding with peak travel demand or local events.
- The shortest booking windows occur for stays in January (average 21 days), indicating more last-minute travel plans during this time.
- Seasonally, Summer (43 days avg.) sees the longest lead times, while Winter (24 days avg.) has the shortest, reflecting typical travel planning cycles.
Recommendations for Hosts
- Use the overall average lead time (37 days) as a baseline for your pricing and availability strategy in Omaha.
- For May stays, consider implementing length-of-stay discounts or slightly higher rates for bookings made less than 61 days out to capitalize on advance planning.
- Target marketing efforts for the Summer season well in advance (at least 43 days) to capture early planners.
- Monitor your own booking lead times against these Omaha averages to identify opportunities for dynamic pricing adjustments.
Popular & Essential Airbnb Amenities in Omaha (2026)
Amenity Prevalence
Amenity Insights for Omaha
- Essential amenities in Omaha that guests expect include: Air conditioning, Wifi, Smoke alarm, TV, Heating, Kitchen. Lacking these (any) could significantly impact bookings.
- Popular amenities like Carbon monoxide alarm, Hot water, Dishes and silverware are common but not universal. Offering these can provide a competitive edge.
Recommendations for Hosts
- Ensure your listing includes all essential amenities for Omaha: Air conditioning, Wifi, Smoke alarm, TV, Heating, Kitchen.
- Prioritize adding missing essentials: Air conditioning, Wifi, Smoke alarm, TV, Heating, Kitchen.
- Consider adding popular differentiators like Carbon monoxide alarm or Hot water to increase appeal.
- Highlight unique or less common amenities you offer (e.g., hot tub, dedicated workspace, EV charger) in your listing description and photos.
- Regularly check competitor amenities in Omaha to stay competitive.
Omaha Airbnb Guest Demographics & Profile Analysis (2026)
Guest Profile Summary for Omaha
- The typical guest profile for Airbnb in Omaha consists of primarily domestic travelers (97%), often arriving from nearby Omaha, typically belonging to the Post-2000s (Gen Z/Alpha) group (50%), primarily speaking English or Spanish.
- Domestic travelers account for 97.1% of guests.
- Key international markets include United States (97.1%) and Canada (0.5%).
- Top languages spoken are English (74%) followed by Spanish (13.3%).
- A significant demographic segment is the Post-2000s (Gen Z/Alpha) group, representing 50% of guests.
Recommendations for Hosts
- Target domestic marketing efforts towards travelers from Omaha and Kansas City.
- Tailor amenities and listing descriptions to appeal to the dominant Post-2000s (Gen Z/Alpha) demographic (e.g., highlight fast WiFi, smart home features, local guides).
- Highlight unique local experiences or amenities relevant to the primary guest profile.
- Consider seasonal promotions aligned with peak travel times for key origin markets.
Nearby Short-Term Rental Market Comparison
How does the Omaha Airbnb market stack up against its neighbors? Compare key performance metrics like average monthly revenue, ADR, and occupancy rates in surrounding areas to understand the broader regional STR landscape.
| Market | Active Properties | Monthly Revenue | Daily Rate | Avg. Occupancy |
|---|---|---|---|---|
| Jefferson Precinct | 10 | $4,462 | $459.09 | 41% |
| Ziskov South Township | 14 | $3,975 | $429.39 | 37% |
| Chicago Precinct | 30 | $3,044 | $248.08 | 44% |
| Gretna | 15 | $2,847 | $285.97 | 43% |
| Papillion | 33 | $2,698 | $249.39 | 48% |
| Bellevue | 46 | $2,596 | $323.92 | 47% |
| Storm Lake | 14 | $2,348 | $247.28 | 39% |
| Crofton | 10 | $2,102 | $314.62 | 35% |
| Columbus | 13 | $2,088 | $164.71 | 51% |
| Carter Lake | 10 | $2,035 | $354.71 | 38% |