Chicago Precinct Airbnb Market Analysis 2026: Short Term Rental Data & Vacation Rental Statistics in Nebraska, United States
Is Airbnb profitable in Chicago Precinct in 2026? Explore comprehensive Airbnb analytics for Chicago Precinct, Nebraska, United States to uncover income potential. This 2026 STR market report for Chicago Precinct, based on AirROI data from February 2025 to January 2026, reveals key trends in the niche market of 30 active listings.
Whether you're considering an Airbnb investment in Chicago Precinct, optimizing your existing vacation rental, or exploring rental arbitrage opportunities, understanding the Chicago Precinct Airbnb data is crucial. Leveraging the low regulation environment is key to maximizing your short term rental income potential. Let's dive into the specifics.
Key Chicago Precinct Airbnb Performance Metrics Overview
Monthly Airbnb Revenue Variations & Income Potential in Chicago Precinct (2026)
Understanding the monthly revenue variations for Airbnb listings in Chicago Precinct is key to maximizing your short term rental income potential. Seasonality significantly impacts earnings. Our analysis, based on data from the past 12 months, shows that the peak revenue month for STRs in Chicago Precinct is typically June, while February often presents the lowest earnings, highlighting opportunities for strategic pricing adjustments during shoulder and low seasons. Explore the typical Airbnb income in Chicago Precinct across different performance tiers:
- Best-in-class properties (Top 10%) achieve $7,329+ monthly, often utilizing dynamic pricing and superior guest experiences.
- Strong performing properties (Top 25%) earn $5,145 or more, indicating effective management and desirable locations/amenities.
- Typical properties (Median) generate around $3,336 per month, representing the average market performance.
- Entry-level properties (Bottom 25%) see earnings around $1,960, often with potential for optimization.
Average Monthly Airbnb Earnings Trend in Chicago Precinct
Chicago Precinct Airbnb Occupancy Rate Trends (2026)
Maximize your bookings by understanding the Chicago Precinct STR occupancy trends. Seasonal demand shifts significantly influence how often properties are booked. Typically, Junesees the highest demand (peak season occupancy), while January experiences the lowest (low season). Effective strategies, like adjusting minimum stays or offering promotions, can boost occupancy during slower periods. Here's how different property tiers perform in Chicago Precinct:
- Best-in-class properties (Top 10%) achieve 81%+ occupancy, indicating high desirability and potentially optimized availability.
- Strong performing properties (Top 25%) maintain 66% or higher occupancy, suggesting good market fit and guest satisfaction.
- Typical properties (Median) have an occupancy rate around 44%.
- Entry-level properties (Bottom 25%) average 25% occupancy, potentially facing higher vacancy.
Average Monthly Occupancy Rate Trend in Chicago Precinct
Average Daily Rate (ADR) Airbnb Trends in Chicago Precinct (2026)
Effective short term rental pricing strategy in Chicago Precinct involves understanding monthly ADR fluctuations. The Average Daily Rate (ADR) for Airbnb in Chicago Precinct typically peaks in June and dips lowest during January. Leveraging Airbnb dynamic pricing tools or strategies based on this seasonality can significantly boost revenue. Here's a look at the typical nightly rates achieved:
- Best-in-class properties (Top 10%) command rates of $409+ per night, often due to premium features or locations.
- Strong performing properties (Top 25%) achieve nightly rates of $290 or more.
- Typical properties (Median) charge around $234 per night.
- Entry-level properties (Bottom 25%) earn around $198 per night.
Average Daily Rate (ADR) Trend by Month in Chicago Precinct
Get Live Chicago Precinct Market Intelligence 👇

Explore Real-time Analytics
Airbnb Seasonality Analysis & Trends in Chicago Precinct (2026)
Peak Season (June, May, July)
- Revenue averages $5,673 per month
- Occupancy rates average 53.9%
- Daily rates average $332
Shoulder Season
- Revenue averages $3,621 per month
- Occupancy maintains around 46.0%
- Daily rates hold near $257
Low Season (January, February, March)
- Revenue drops to average $2,370 per month
- Occupancy decreases to average 36.7%
- Daily rates adjust to average $244
Seasonality Insights for Chicago Precinct
- The Airbnb seasonality in Chicago Precinct shows highly seasonal trends requiring careful strategy. While the sections above show seasonal averages, it's also insightful to look at the extremes:
- During the high season, the absolute peak month showcases Chicago Precinct's highest earning potential, with monthly revenues capable of climbing to $7,490, occupancy reaching a high of 60.6%, and ADRs peaking at $375.
- Conversely, the slowest single month of the year, typically falling within the low season, marks the market's lowest point. In this month, revenue might dip to $2,166, occupancy could drop to 26.0%, and ADRs may adjust down to $232.
- Understanding both the seasonal averages and these monthly peaks and troughs in revenue, occupancy, and ADR is crucial for maximizing your Airbnb profit potential in Chicago Precinct.
Seasonal Strategies for Maximizing Profit
- Peak Season: Maximize revenue through premium pricing and potentially longer minimum stays. Ensure high availability.
- Low Season: Offer competitive pricing, special promotions (e.g., extended stay discounts), and flexible cancellation policies. Target off-season travelers like remote workers or budget-conscious guests.
- Shoulder Seasons: Implement dynamic pricing that balances peak and low rates. Target weekend travelers or specific events. Offer slightly more flexible terms than peak season.
- Regularly analyze your own performance against these Chicago Precinct seasonality benchmarks and adjust your pricing and availability strategy accordingly.
Best Areas for Airbnb Investment in Chicago Precinct (2026)
Exploring the top neighborhoods for short-term rentals in Chicago Precinct? This section highlights key areas, outlining why they are attractive for hosts and guests, along with notable local attractions. Consider these locations based on your target guest profile and investment strategy.
| Neighborhood / Area | Why Host Here? (Target Guests & Appeal) | Key Attractions & Landmarks |
|---|---|---|
| Downtown Chicago | The bustling heart of the city with iconic attractions, dining, and entertainment, perfect for tourists looking to stay in the center of it all. | Millennium Park, The Art Institute of Chicago, Navy Pier, Chicago Riverwalk, The Field Museum |
| Lincoln Park | A vibrant neighborhood known for its beautiful park, zoo, and proximity to dining and nightlife. Ideal for families and young professionals. | Lincoln Park Zoo, Lincoln Park Conservatory, Lakefront Trail, North Avenue Beach, DePaul University |
| Wicker Park | Known for its hipster vibe, trendy shops, and vibrant nightlife. It attracts a younger crowd looking for unique experiences. | Wicker Park, The 606 Trail, Vintage shops, Art galleries, Live music venues |
| River North | A trendy area with art galleries, upscale dining, and clubs, making it popular among tourists and business travelers. | Magnificent Mile, Chicago River Arts District, The House of Blues, Museum of Contemporary Art, Bars and clubs |
| The Loop | The central business district, which is also rich in culture and dining, attracting both business travelers and tourists. | Willis Tower, Chicago Theatre, Art Institute of Chicago, Cloud Gate, The Chicago Stock Exchange |
| South Loop | Home to museums, parks, and Lake Michigan access, appealing to families and visitors wanting a less urban, yet spacious area. | Museum Campus, Adler Planetarium, Field Museum, Grant Park, Soldier Field |
| Chinatown | A vibrant cultural neighborhood rich in history and cuisine, attracting both locals and travelers looking for unique cultural experiences. | Chinatown Gate, Chinese-American Museum, Historic Architecture, Restaurants, Cultural Festivals |
| Logan Square | A trendy neighborhood known for its park, local breweries, and vibrant arts scene, appealing to younger crowds. | Logan Boulevard, Boulevard Lakeview, Local Breweries, Art galleries, Music venues |
Understanding Airbnb License Requirements & STR Laws in Chicago Precinct (2026)
While Chicago Precinct, Nebraska, United States currently shows low STR regulations, specific Airbnb license requirements might still exist or change. Always verify the latest short term rental regulations and Airbnb license requirements directly with local government authorities for Chicago Precinct to ensure full compliance before hosting.
(Source: AirROI data, 2026, finding no licensed listings among those analyzed)
Top Performing Airbnb Properties in Chicago Precinct (2026)
Benchmark your potential! Explore examples of top-performing Airbnb properties in Chicago Precinctbased on Trailing Twelve Month (TTM) revenue. Analyze their characteristics, revenue, occupancy rate, and ADR to understand what drives success in this market.
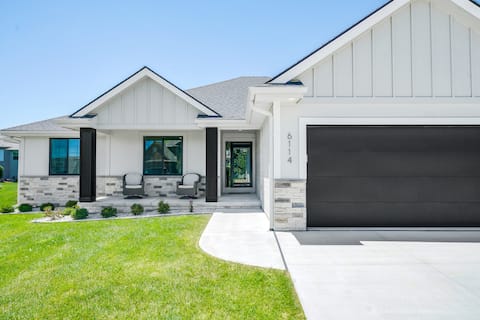
King Bed- Pool Table- Arcade Games - West Omaha
Entire Place • 5 bedrooms
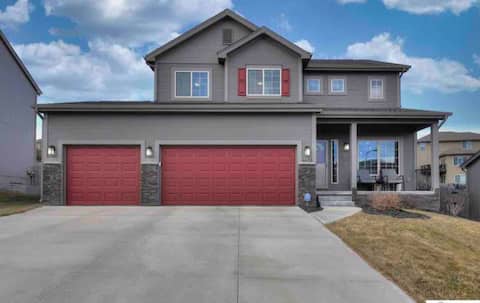
Making Memories. Family Friendly. Arcade Games.
Entire Place • 4 bedrooms
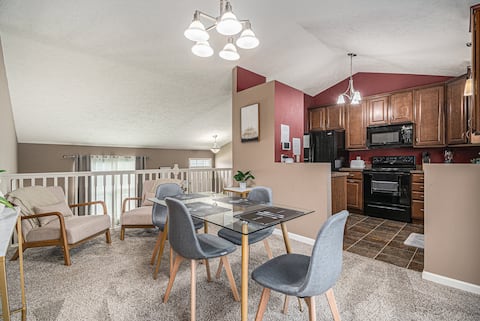
Cozy Omaha Home 3 bdrm 2 baths
Entire Place • 3 bedrooms
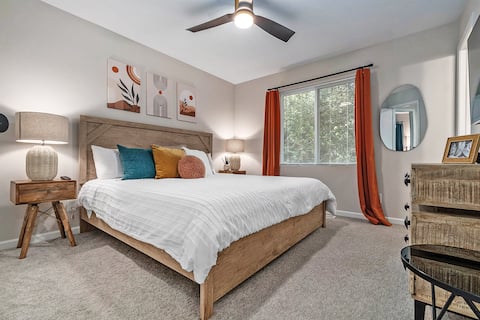
Elegant Escape-Fenced Yard, BBQ & Cozy Fire Pit!
Entire Place • 4 bedrooms

Inviting Place To Call Home For A While
Entire Place • 4 bedrooms

West Omaha Townhouse with GYM, Shopping, King Bed
Entire Place • 3 bedrooms
Note: Performance varies based on location, size, amenities, seasonality, and management quality. Data reflects the past 12 months.
Top Performing Airbnb Hosts in Chicago Precinct (2026)
Learn from the best! This table showcases top-performing Airbnb hosts in Chicago Precinct based on the number of properties managed and estimated total revenue over the past year. Analyze their scale and performance metrics.
| Host Name | Properties | Grossing Revenue | Stay Reviews | Avg Rating |
|---|---|---|---|---|
| WetWater | 6 | $174,290 | 123 | 4.94/5.0 |
| Kristina | 1 | $103,592 | 80 | 4.98/5.0 |
| Cortney | 1 | $93,352 | 76 | 4.97/5.0 |
| Will | 2 | $80,570 | 122 | 4.97/5.0 |
| Andrew | 1 | $70,154 | 65 | 4.75/5.0 |
| Jireh | 1 | $58,802 | 77 | 4.90/5.0 |
| Linda | 1 | $51,912 | 167 | 4.92/5.0 |
| Michelle | 1 | $46,445 | 13 | 4.85/5.0 |
| Tony | 1 | $46,134 | 9 | 4.78/5.0 |
| Joseph | 1 | $46,103 | 132 | 4.77/5.0 |
Analyzing the strategies of top hosts, such as their property selection, pricing, and guest communication, can offer valuable lessons for optimizing your own Airbnb operations in Chicago Precinct.
Dive Deeper: Advanced Chicago Precinct STR Market Data (2026)
Ready to unlock more insights? AirROI provides access to advanced metrics and comprehensive Airbnb data for Chicago Precinct. Explore detailed analytics beyond this report to refine your investment strategy, optimize pricing, and maximize your vacation rental profits.
Explore Advanced MetricsChicago Precinct Short-Term Rental Market Composition (2026): Property & Room Types
Room Type Distribution
Property Type Distribution
Market Composition Insights for Chicago Precinct
- The Chicago Precinct Airbnb market composition is heavily skewed towards Entire Home/Apt listings, which make up 96.7% of the 30 active rentals. This indicates strong guest preference for privacy and space.
- Looking at the property type distribution in Chicago Precinct, House properties are the most common (100%), reflecting the local real estate landscape.
- Houses represent a significant 100% portion, catering likely to families or larger groups.
Chicago Precinct Airbnb Room Capacity Analysis (2026): Bedroom Distribution
Distribution of Listings by Number of Bedrooms
Room Capacity Insights for Chicago Precinct
- The dominant room capacity in Chicago Precinct is 3 bedrooms listings, making up 56.7% of the market. This suggests a strong demand for properties suitable for families or small groups.
- Together, 3 bedrooms and 4 bedrooms properties represent 83.4% of the active Airbnb listings in Chicago Precinct, indicating a high concentration in these sizes.
- A significant 90.1% of listings offer 3+ bedrooms, catering to larger groups and families seeking more space in Chicago Precinct.
Chicago Precinct Vacation Rental Guest Capacity Trends (2026)
Distribution of Listings by Guest Capacity
Guest Capacity Insights for Chicago Precinct
- The most common guest capacity trend in Chicago Precinct vacation rentals is listings accommodating 8+ guests (60%). This suggests the primary traveler segment is likely larger groups.
- Properties designed for 8+ guests and 6 guests dominate the Chicago Precinct STR market, accounting for 90.0% of listings.
- 90.0% of properties accommodate 6+ guests, serving the market segment for larger families or group travel in Chicago Precinct.
- On average, properties in Chicago Precinct are equipped to host 6.9 guests.
Chicago Precinct Airbnb Booking Patterns (2026): Available vs. Booked Days
Available Days Distribution
Booked Days Distribution
Booking Pattern Insights for Chicago Precinct
- The most common availability pattern in Chicago Precinct falls within the 181-270 days range, representing 43.3% of listings. This suggests many properties have significant open periods on their calendars.
- Approximately 66.6% of listings show high availability (181+ days open annually), indicating potential for increased bookings or specific owner usage patterns.
- For booked days, the 91-180 days range is most frequent in Chicago Precinct (46.7%), reflecting common guest stay durations or potential owner blocking patterns.
- A notable 33.3% of properties secure long booking periods (181+ days booked per year), highlighting successful long-term rental strategies or significant owner usage.
Chicago Precinct Airbnb Minimum Stay Requirements Analysis
Distribution of Listings by Minimum Night Requirement
1 Night
3 listings
10% of total
2 Nights
18 listings
60% of total
3 Nights
2 listings
6.7% of total
4-6 Nights
1 listings
3.3% of total
30+ Nights
6 listings
20% of total
Key Insights
- The most prevalent minimum stay requirement in Chicago Precinct is 2 Nights, adopted by 60% of listings. This highlights the market's preference for shorter, flexible bookings.
- A strong majority (70.0%) of the Chicago Precinct Airbnb data shows acceptance of very short stays (1-2 nights), indicating a dynamic, high-turnover market.
- A significant segment (20%) caters to monthly stays (30+ nights) in Chicago Precinct, pointing to opportunities in the extended-stay market.
Recommendations
- Align with the market by considering a 2 Nights minimum stay, as 60% of Chicago Precinct hosts use this setting.
- If feasible, allowing 1-night stays, especially midweek or during low season, could capture last-minute bookings, as only 10% currently do.
- A 2-night minimum appears standard (60%). Consider this for weekends or peak periods.
- Explore offering discounts for stays of 30+ nights to attract the 20% of the market seeking extended stays.
- Adjust minimum nights based on seasonality – potentially shorter during low season and longer during peak demand periods in Chicago Precinct.
Chicago Precinct Airbnb Cancellation Policy Trends Analysis (2026)
Flexible
6 listings
20% of total
Moderate
13 listings
43.3% of total
Firm
6 listings
20% of total
Strict
5 listings
16.7% of total
Cancellation Policy Insights for Chicago Precinct
- The prevailing Airbnb cancellation policy trend in Chicago Precinct is Moderate, used by 43.3% of listings.
- There's a relatively balanced mix between guest-friendly (63.3%) and stricter (36.7%) policies, offering choices for different guest needs.
Recommendations for Hosts
- Consider adopting a Moderate policy to align with the 43.3% market standard in Chicago Precinct.
- Regularly review your cancellation policy against competitors and market demand shifts in Chicago Precinct.
Chicago Precinct STR Booking Lead Time Analysis (2026)
Average Booking Lead Time by Month
Booking Lead Time Insights for Chicago Precinct
- The overall average booking lead time for vacation rentals in Chicago Precinct is 39 days.
- Guests book furthest in advance for stays during August (average 56 days), likely coinciding with peak travel demand or local events.
- The shortest booking windows occur for stays in March (average 22 days), indicating more last-minute travel plans during this time.
- Seasonally, Summer (51 days avg.) sees the longest lead times, while Winter (33 days avg.) has the shortest, reflecting typical travel planning cycles.
Recommendations for Hosts
- Use the overall average lead time (39 days) as a baseline for your pricing and availability strategy in Chicago Precinct.
- For August stays, consider implementing length-of-stay discounts or slightly higher rates for bookings made less than 56 days out to capitalize on advance planning.
- Target marketing efforts for the Summer season well in advance (at least 51 days) to capture early planners.
- Monitor your own booking lead times against these Chicago Precinct averages to identify opportunities for dynamic pricing adjustments.
Popular & Essential Airbnb Amenities in Chicago Precinct (2026)
Amenity Prevalence
Amenity Insights for Chicago Precinct
- Essential amenities in Chicago Precinct that guests expect include: Wifi, Air conditioning, Carbon monoxide alarm, Kitchen, TV, Dryer, Free parking on premises, Smoke alarm, Washer, Microwave. Lacking these (any) could significantly impact bookings.
Recommendations for Hosts
- Ensure your listing includes all essential amenities for Chicago Precinct: Wifi, Air conditioning, Carbon monoxide alarm, Kitchen, TV, Dryer, Free parking on premises, Smoke alarm, Washer, Microwave.
- Prioritize adding missing essentials: Free parking on premises, Smoke alarm, Washer, Microwave.
- Highlight unique or less common amenities you offer (e.g., hot tub, dedicated workspace, EV charger) in your listing description and photos.
- Regularly check competitor amenities in Chicago Precinct to stay competitive.
Chicago Precinct Airbnb Guest Demographics & Profile Analysis (2026)
Guest Profile Summary for Chicago Precinct
- The typical guest profile for Airbnb in Chicago Precinct consists of primarily domestic travelers (98%), often arriving from nearby Omaha, typically belonging to the Post-2000s (Gen Z/Alpha) group (50%), primarily speaking English or Spanish.
- Domestic travelers account for 97.5% of guests.
- Key international markets include United States (97.5%) and United Kingdom (1%).
- Top languages spoken are English (64.8%) followed by Spanish (11%).
- A significant demographic segment is the Post-2000s (Gen Z/Alpha) group, representing 50% of guests.
Recommendations for Hosts
- Target domestic marketing efforts towards travelers from Omaha and Sioux Falls.
- Tailor amenities and listing descriptions to appeal to the dominant Post-2000s (Gen Z/Alpha) demographic (e.g., highlight fast WiFi, smart home features, local guides).
- Highlight unique local experiences or amenities relevant to the primary guest profile.
- Consider seasonal promotions aligned with peak travel times for key origin markets.
Nearby Short-Term Rental Market Comparison
How does the Chicago Precinct Airbnb market stack up against its neighbors? Compare key performance metrics like average monthly revenue, ADR, and occupancy rates in surrounding areas to understand the broader regional STR landscape.
| Market | Active Properties | Monthly Revenue | Daily Rate | Avg. Occupancy |
|---|---|---|---|---|
| Jefferson Precinct | 10 | $4,462 | $459.09 | 41% |
| Ziskov South Township | 14 | $3,975 | $429.39 | 37% |
| Gretna | 15 | $2,847 | $285.97 | 43% |
| Papillion | 33 | $2,698 | $249.39 | 48% |
| Bellevue | 46 | $2,596 | $323.92 | 47% |
| Storm Lake | 14 | $2,348 | $247.28 | 39% |
| Crofton | 10 | $2,102 | $314.62 | 35% |
| Columbus | 13 | $2,088 | $164.71 | 51% |
| Carter Lake | 10 | $2,035 | $354.71 | 38% |
| Vermillion | 14 | $1,966 | $195.15 | 33% |