Edwards Airbnb Market Analysis 2025: Short Term Rental Data & Vacation Rental Statistics in Missouri, United States
Is Airbnb profitable in Edwards in 2025? Explore comprehensive Airbnb analytics for Edwards, Missouri, United States to uncover income potential. This 2025 STR market report for Edwards, based on AirROI data from June 2024 to May 2025, reveals key trends in the niche market of 19 active listings.
Whether you're considering an Airbnb investment in Edwards, optimizing your existing vacation rental, or exploring rental arbitrage opportunities, understanding the Edwards Airbnb data is crucial. Leveraging the low regulation environment is key to maximizing your short term rental income potential. Let's dive into the specifics.
Key Edwards Airbnb Performance Metrics Overview
Monthly Airbnb Revenue Variations & Income Potential in Edwards (2025)
Understanding the monthly revenue variations for Airbnb listings in Edwards is key to maximizing your short term rental income potential. Seasonality significantly impacts earnings. Our analysis, based on data from the past 12 months, shows that the peak revenue month for STRs in Edwards is typically July, while February often presents the lowest earnings, highlighting opportunities for strategic pricing adjustments during shoulder and low seasons. Explore the typical Airbnb income in Edwards across different performance tiers:
- Best-in-class properties (Top 10%) achieve $5,562+ monthly, often utilizing dynamic pricing and superior guest experiences.
- Strong performing properties (Top 25%) earn $3,597 or more, indicating effective management and desirable locations/amenities.
- Typical properties (Median) generate around $2,259 per month, representing the average market performance.
- Entry-level properties (Bottom 25%) see earnings around $1,222, often with potential for optimization.
Average Monthly Airbnb Earnings Trend in Edwards
Edwards Airbnb Occupancy Rate Trends (2025)
Maximize your bookings by understanding the Edwards STR occupancy trends. Seasonal demand shifts significantly influence how often properties are booked. Typically, Julysees the highest demand (peak season occupancy), while February experiences the lowest (low season). Effective strategies, like adjusting minimum stays or offering promotions, can boost occupancy during slower periods. Here's how different property tiers perform in Edwards:
- Best-in-class properties (Top 10%) achieve 87%+ occupancy, indicating high desirability and potentially optimized availability.
- Strong performing properties (Top 25%) maintain 68% or higher occupancy, suggesting good market fit and guest satisfaction.
- Typical properties (Median) have an occupancy rate around 43%.
- Entry-level properties (Bottom 25%) average 21% occupancy, potentially facing higher vacancy.
Average Monthly Occupancy Rate Trend in Edwards
Average Daily Rate (ADR) Airbnb Trends in Edwards (2025)
Effective short term rental pricing strategy in Edwards involves understanding monthly ADR fluctuations. The Average Daily Rate (ADR) for Airbnb in Edwards typically peaks in May and dips lowest during December. Leveraging Airbnb dynamic pricing tools or strategies based on this seasonality can significantly boost revenue. Here's a look at the typical nightly rates achieved:
- Best-in-class properties (Top 10%) command rates of $300+ per night, often due to premium features or locations.
- Strong performing properties (Top 25%) achieve nightly rates of $228 or more.
- Typical properties (Median) charge around $170 per night.
- Entry-level properties (Bottom 25%) earn around $140 per night.
Average Daily Rate (ADR) Trend by Month in Edwards
Get Live Edwards Market Intelligence 👇

Explore Real-time Analytics
Airbnb Seasonality Analysis & Trends in Edwards (2025)
Peak Season (July, August, March)
- Revenue averages $3,494 per month
- Occupancy rates average 57.4%
- Daily rates average $215
Shoulder Season
- Revenue averages $2,611 per month
- Occupancy maintains around 44.9%
- Daily rates hold near $213
Low Season (January, February, September)
- Revenue drops to average $2,034 per month
- Occupancy decreases to average 38.5%
- Daily rates adjust to average $224
Seasonality Insights for Edwards
- The Airbnb seasonality in Edwards shows highly seasonal trends requiring careful strategy. While the sections above show seasonal averages, it's also insightful to look at the extremes:
- During the high season, the absolute peak month showcases Edwards's highest earning potential, with monthly revenues capable of climbing to $3,955, occupancy reaching a high of 63.0%, and ADRs peaking at $264.
- Conversely, the slowest single month of the year, typically falling within the low season, marks the market's lowest point. In this month, revenue might dip to $1,836, occupancy could drop to 36.7%, and ADRs may adjust down to $190.
- Understanding both the seasonal averages and these monthly peaks and troughs in revenue, occupancy, and ADR is crucial for maximizing your Airbnb profit potential in Edwards.
Seasonal Strategies for Maximizing Profit
- Peak Season: Maximize revenue through premium pricing and potentially longer minimum stays. Ensure high availability.
- Low Season: Offer competitive pricing, special promotions (e.g., extended stay discounts), and flexible cancellation policies. Target off-season travelers like remote workers or budget-conscious guests.
- Shoulder Seasons: Implement dynamic pricing that balances peak and low rates. Target weekend travelers or specific events. Offer slightly more flexible terms than peak season.
- Regularly analyze your own performance against these Edwards seasonality benchmarks and adjust your pricing and availability strategy accordingly.
Best Areas for Airbnb Investment in Edwards (2025)
Exploring the top neighborhoods for short-term rentals in Edwards? This section highlights key areas, outlining why they are attractive for hosts and guests, along with notable local attractions. Consider these locations based on your target guest profile and investment strategy.
| Neighborhood / Area | Why Host Here? (Target Guests & Appeal) | Key Attractions & Landmarks |
|---|---|---|
| Lake of the Ozarks | A major vacation destination with beautiful scenery, boating, and water sports. Attractive for travelers seeking outdoor activities and relaxation. | Lake of the Ozarks State Park, Ha Ha Tonka State Park, Osage Beach Premium Outlets, Bagnell Dam, Magic Dragon Street Meet, Scenic Overlook |
| Branson | Known for its entertainment and family-friendly attractions, Branson draws a large number of visitors looking for shows, theme parks, and nature activities. | Silver Dollar City, Branson Strip, Table Rock Lake, Dolly Parton's Stampede, Branson Landing, Ripley's Believe It or Not! |
| Springfield | As the third-largest city in Missouri, Springfield offers urban amenities, rich history, and proximity to natural attractions, appealing to business and leisure travelers. | Fantastic Caverns, Dickerson Park Zoo, Route 66 Car Museum, Springfield Art Museum, Wilson's Creek National Battlefield |
| St. Robert | Close to Fort Leonard Wood, St. Robert is attractive for military families and visitors, offering a range of accommodations and services for transient guests. | St. Robert Museum, Fort Leonard Wood, Kahuna Water Park, Nearby hiking trails, Local dining options |
| Lebanon | A small town that serves as a gateway to various nearby attractions and outdoor activities, appealing to travelers looking for a peaceful retreat. | Route 66 Museum, Kennedy Park, Shepherd Hills Factory Outlet, Lewis and Clark Trail |
| Camdenton | Located near the lake, Camdenton is a charming town that attracts visitors looking for water activities and a laid-back atmosphere. | Ha Ha Tonka State Park, Old Kinderhook Golf Course, Lake Valley Golf Club, Local wineries and breweries |
| Osage Beach | A bustling hub at Lake of the Ozarks, Osage Beach is perfect for vacationers seeking accommodations near boating and water sports. | Osage Beach Premium Outlets, Lake of the Ozarks State Park, Multiple marinas and boat rental services |
| Sullivan | Located conveniently off I-44, Sullivan serves travelers with an array of accommodations, catering to those exploring the Ozarks or heading to other destinations. | Meramec State Park, Historic Sullivan route 66, Local eateries and shops |
Understanding Airbnb License Requirements & STR Laws in Edwards (2025)
While Edwards, Missouri, United States currently shows low STR regulations, specific Airbnb license requirements might still exist or change. Always verify the latest short term rental regulations and Airbnb license requirements directly with local government authorities for Edwards to ensure full compliance before hosting.
(Source: AirROI data, 2025, finding no licensed listings among those analyzed)
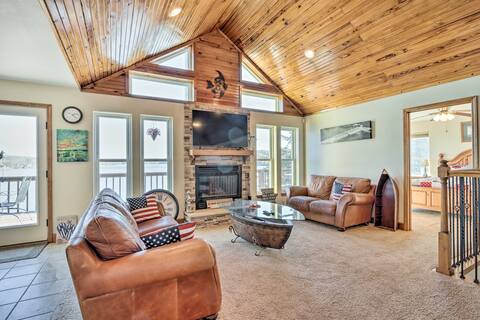
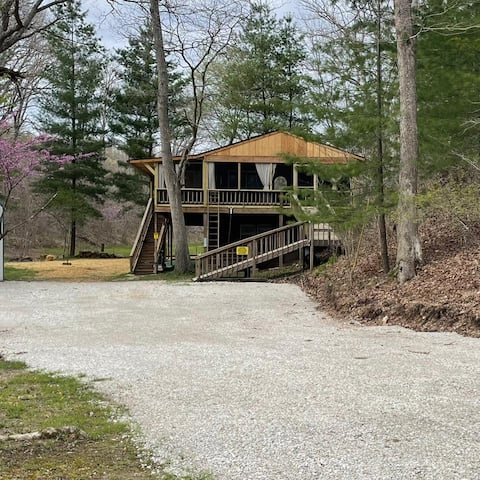
Top Performing Airbnb Properties in Edwards (2025)
Benchmark your potential! Explore examples of top-performing Airbnb properties in Edwardsbased on Trailing Twelve Month (TTM) revenue. Analyze their characteristics, revenue, occupancy rate, and ADR to understand what drives success in this market.

Rippling Point Lakefront House
Entire Place • 2 bedrooms

Lake Affect II w/Hot tub
Entire Place • 5 bedrooms
House w/ Deck Overlooking Lake of the Ozarks!
Entire Place • 3 bedrooms

Cairn Cottage~secluded retreat ~hot tub~fire
Entire Place • N/A
The Tree-House - A private secluded paradise
Entire Place • 3 bedrooms

Tranquil Lake Front 3 BR Cottage W/Private Dock
Entire Place • 3 bedrooms
Note: Performance varies based on location, size, amenities, seasonality, and management quality. Data reflects the past 12 months.
Top Performing Airbnb Hosts in Edwards (2025)
Learn from the best! This table showcases top-performing Airbnb hosts in Edwards based on the number of properties managed and estimated total revenue over the past year. Analyze their scale and performance metrics.
| Host Name | Properties | Grossing Revenue | Stay Reviews | Avg Rating |
|---|---|---|---|---|
| Evolve | 4 | $95,090 | 68 | 4.71/5.0 |
| Frances | 3 | $85,649 | 38 | 4.94/5.0 |
| Michele | 1 | $52,258 | 240 | 4.96/5.0 |
| Hannah | 1 | $35,851 | 67 | 4.99/5.0 |
| Amy & Billy | 1 | $27,665 | 74 | 4.93/5.0 |
| Justin | 1 | $24,604 | 55 | 4.98/5.0 |
| Jackson | 1 | $18,781 | 19 | 4.89/5.0 |
| Chaning | 1 | $15,544 | 55 | 4.96/5.0 |
| Tammy | 1 | $15,130 | 7 | 4.57/5.0 |
| Host #116664059 | 1 | $11,659 | 25 | 4.88/5.0 |
Analyzing the strategies of top hosts, such as their property selection, pricing, and guest communication, can offer valuable lessons for optimizing your own Airbnb operations in Edwards.
Dive Deeper: Advanced Edwards STR Market Data (2025)
Ready to unlock more insights? AirROI provides access to advanced metrics and comprehensive Airbnb data for Edwards. Explore detailed analytics beyond this report to refine your investment strategy, optimize pricing, and maximize your vacation rental profits.
Explore Advanced MetricsEdwards Short-Term Rental Market Composition (2025): Property & Room Types
Room Type Distribution
Property Type Distribution
Market Composition Insights for Edwards
- The Edwards Airbnb market composition is heavily skewed towards Entire Home/Apt listings, which make up 100% of the 19 active rentals. This indicates strong guest preference for privacy and space.
- Looking at the property type distribution in Edwards, House properties are the most common (73.7%), reflecting the local real estate landscape.
- Houses represent a significant 73.7% portion, catering likely to families or larger groups.
Edwards Airbnb Room Capacity Analysis (2025): Bedroom Distribution
Distribution of Listings by Number of Bedrooms
Room Capacity Insights for Edwards
- The dominant room capacity in Edwards is 2 bedrooms listings, making up 36.8% of the market. This suggests a strong demand for properties suitable for couples or solo travelers.
- Together, 2 bedrooms and 3 bedrooms properties represent 63.1% of the active Airbnb listings in Edwards, indicating a high concentration in these sizes.
- A significant 47.3% of listings offer 3+ bedrooms, catering to larger groups and families seeking more space in Edwards.
Edwards Vacation Rental Guest Capacity Trends (2025)
Distribution of Listings by Guest Capacity
Guest Capacity Insights for Edwards
- The most common guest capacity trend in Edwards vacation rentals is listings accommodating 8+ guests (42.1%). This suggests the primary traveler segment is likely larger groups.
- Properties designed for 8+ guests and 6 guests dominate the Edwards STR market, accounting for 78.9% of listings.
- 78.9% of properties accommodate 6+ guests, serving the market segment for larger families or group travel in Edwards.
- On average, properties in Edwards are equipped to host 6.5 guests.
Edwards Airbnb Booking Patterns (2025): Available vs. Booked Days
Available Days Distribution
Booked Days Distribution
Booking Pattern Insights for Edwards
- The most common availability pattern in Edwards falls within the 271-366 days range, representing 47.4% of listings. This suggests many properties have significant open periods on their calendars.
- Approximately 79.0% of listings show high availability (181+ days open annually), indicating potential for increased bookings or specific owner usage patterns.
- For booked days, the 91-180 days range is most frequent in Edwards (36.8%), reflecting common guest stay durations or potential owner blocking patterns.
- A notable 26.3% of properties secure long booking periods (181+ days booked per year), highlighting successful long-term rental strategies or significant owner usage.
Edwards Airbnb Minimum Stay Requirements Analysis
Distribution of Listings by Minimum Night Requirement
1 Night
1 listings
5.6% of total
2 Nights
10 listings
55.6% of total
3 Nights
4 listings
22.2% of total
4-6 Nights
1 listings
5.6% of total
30+ Nights
2 listings
11.1% of total
Key Insights
- The most prevalent minimum stay requirement in Edwards is 2 Nights, adopted by 55.6% of listings. This highlights the market's preference for shorter, flexible bookings.
- A strong majority (61.2%) of the Edwards Airbnb data shows acceptance of very short stays (1-2 nights), indicating a dynamic, high-turnover market.
- A significant segment (11.1%) caters to monthly stays (30+ nights) in Edwards, pointing to opportunities in the extended-stay market.
Recommendations
- Align with the market by considering a 2 Nights minimum stay, as 55.6% of Edwards hosts use this setting.
- If feasible, allowing 1-night stays, especially midweek or during low season, could capture last-minute bookings, as only 5.6% currently do.
- A 2-night minimum appears standard (55.6%). Consider this for weekends or peak periods.
- Explore offering discounts for stays of 30+ nights to attract the 11.1% of the market seeking extended stays.
- Adjust minimum nights based on seasonality – potentially shorter during low season and longer during peak demand periods in Edwards.
Edwards Airbnb Cancellation Policy Trends Analysis (2025)
Flexible
3 listings
18.8% of total
Moderate
4 listings
25% of total
Firm
4 listings
25% of total
Strict
5 listings
31.3% of total
Cancellation Policy Insights for Edwards
- The prevailing Airbnb cancellation policy trend in Edwards is Strict, used by 31.3% of listings.
- A majority (56.3%) of hosts in Edwards utilize Firm or Strict policies, indicating a market where hosts prioritize booking security.
Recommendations for Hosts
- Consider adopting a Strict policy to align with the 31.3% market standard in Edwards.
- With 31.3% using Strict terms, this is a viable option in Edwards, particularly for high-value properties or during peak demand periods.
- Regularly review your cancellation policy against competitors and market demand shifts in Edwards.
Edwards STR Booking Lead Time Analysis (2025)
Average Booking Lead Time by Month
Booking Lead Time Insights for Edwards
- The overall average booking lead time for vacation rentals in Edwards is 47 days.
- Guests book furthest in advance for stays during November (average 76 days), likely coinciding with peak travel demand or local events.
- The shortest booking windows occur for stays in January (average 24 days), indicating more last-minute travel plans during this time.
- Seasonally, Spring (60 days avg.) sees the longest lead times, while Winter (39 days avg.) has the shortest, reflecting typical travel planning cycles.
Recommendations for Hosts
- Use the overall average lead time (47 days) as a baseline for your pricing and availability strategy in Edwards.
- For November stays, consider implementing length-of-stay discounts or slightly higher rates for bookings made less than 76 days out to capitalize on advance planning.
- Target marketing efforts for the Spring season well in advance (at least 60 days) to capture early planners.
- Monitor your own booking lead times against these Edwards averages to identify opportunities for dynamic pricing adjustments.
Popular & Essential Airbnb Amenities in Edwards (2025)
Amenity Prevalence
Amenity Insights for Edwards
- Essential amenities in Edwards that guests expect include: Smoke alarm, Kitchen, Air conditioning, Free parking on premises. Lacking these (any) could significantly impact bookings.
- Popular amenities like Hot water, Bed linens, Cooking basics are common but not universal. Offering these can provide a competitive edge.
Recommendations for Hosts
- Ensure your listing includes all essential amenities for Edwards: Smoke alarm, Kitchen, Air conditioning, Free parking on premises.
- Consider adding popular differentiators like Hot water or Bed linens to increase appeal.
- Highlight unique or less common amenities you offer (e.g., hot tub, dedicated workspace, EV charger) in your listing description and photos.
- Regularly check competitor amenities in Edwards to stay competitive.
Edwards Airbnb Guest Demographics & Profile Analysis (2025)
Guest Profile Summary for Edwards
- The typical guest profile for Airbnb in Edwards consists of primarily domestic travelers (100%), often arriving from nearby Kansas City, typically belonging to the Post-2000s (Gen Z/Alpha) group (50%), primarily speaking English or Spanish.
- Domestic travelers account for 100.0% of guests.
- Top languages spoken are English (86.6%) followed by Spanish (4.5%).
- A significant demographic segment is the Post-2000s (Gen Z/Alpha) group, representing 50% of guests.
Recommendations for Hosts
- Target domestic marketing efforts towards travelers from Kansas City and Columbia.
- Tailor amenities and listing descriptions to appeal to the dominant Post-2000s (Gen Z/Alpha) demographic (e.g., highlight fast WiFi, smart home features, local guides).
- Highlight unique local experiences or amenities relevant to the primary guest profile.
- Consider seasonal promotions aligned with peak travel times for key origin markets.
Nearby Short-Term Rental Market Comparison
How does the Edwards Airbnb market stack up against its neighbors? Compare key performance metrics like average monthly revenue, ADR, and occupancy rates in surrounding areas to understand the broader regional STR landscape.
| Market | Active Properties | Monthly Revenue | Daily Rate | Avg. Occupancy |
|---|---|---|---|---|
| Weston | 14 | $3,406 | $329.80 | 38% |
| Pleasant Hill | 10 | $3,037 | $210.07 | 55% |
| Prairie Village | 50 | $3,008 | $208.45 | 59% |
| Friedenswald | 12 | $2,997 | $307.31 | 43% |
| Sunrise Beach | 231 | $2,724 | $402.75 | 36% |
| Linn Creek | 27 | $2,625 | $322.98 | 36% |
| Umber View Heights | 11 | $2,571 | $290.93 | 34% |
| Overland Park | 263 | $2,567 | $197.48 | 52% |
| Roach | 25 | $2,458 | $354.51 | 43% |
| Climax Springs | 32 | $2,296 | $349.30 | 32% |