Chatham Airbnb Market Analysis 2025: Short Term Rental Data & Vacation Rental Statistics in Mississippi, United States
Is Airbnb profitable in Chatham in 2025? Explore comprehensive Airbnb analytics for Chatham, Mississippi, United States to uncover income potential. This 2025 STR market report for Chatham, based on AirROI data from June 2024 to May 2025, reveals key trends in the niche market of 24 active listings.
Whether you're considering an Airbnb investment in Chatham, optimizing your existing vacation rental, or exploring rental arbitrage opportunities, understanding the Chatham Airbnb data is crucial. Leveraging the low regulation environment is key to maximizing your short term rental income potential. Let's dive into the specifics.
Key Chatham Airbnb Performance Metrics Overview
Monthly Airbnb Revenue Variations & Income Potential in Chatham (2025)
Understanding the monthly revenue variations for Airbnb listings in Chatham is key to maximizing your short term rental income potential. Seasonality significantly impacts earnings. Our analysis, based on data from the past 12 months, shows that the peak revenue month for STRs in Chatham is typically March, while September often presents the lowest earnings, highlighting opportunities for strategic pricing adjustments during shoulder and low seasons. Explore the typical Airbnb income in Chatham across different performance tiers:
- Best-in-class properties (Top 10%) achieve $2,035+ monthly, often utilizing dynamic pricing and superior guest experiences.
- Strong performing properties (Top 25%) earn $1,291 or more, indicating effective management and desirable locations/amenities.
- Typical properties (Median) generate around $732 per month, representing the average market performance.
- Entry-level properties (Bottom 25%) see earnings around $417, often with potential for optimization.
Average Monthly Airbnb Earnings Trend in Chatham
Chatham Airbnb Occupancy Rate Trends (2025)
Maximize your bookings by understanding the Chatham STR occupancy trends. Seasonal demand shifts significantly influence how often properties are booked. Typically, Marchsees the highest demand (peak season occupancy), while September experiences the lowest (low season). Effective strategies, like adjusting minimum stays or offering promotions, can boost occupancy during slower periods. Here's how different property tiers perform in Chatham:
- Best-in-class properties (Top 10%) achieve 31%+ occupancy, indicating high desirability and potentially optimized availability.
- Strong performing properties (Top 25%) maintain 20% or higher occupancy, suggesting good market fit and guest satisfaction.
- Typical properties (Median) have an occupancy rate around 13%.
- Entry-level properties (Bottom 25%) average 8% occupancy, potentially facing higher vacancy.
Average Monthly Occupancy Rate Trend in Chatham
Average Daily Rate (ADR) Airbnb Trends in Chatham (2025)
Effective short term rental pricing strategy in Chatham involves understanding monthly ADR fluctuations. The Average Daily Rate (ADR) for Airbnb in Chatham typically peaks in May and dips lowest during September. Leveraging Airbnb dynamic pricing tools or strategies based on this seasonality can significantly boost revenue. Here's a look at the typical nightly rates achieved:
- Best-in-class properties (Top 10%) command rates of $340+ per night, often due to premium features or locations.
- Strong performing properties (Top 25%) achieve nightly rates of $213 or more.
- Typical properties (Median) charge around $204 per night.
- Entry-level properties (Bottom 25%) earn around $125 per night.
Average Daily Rate (ADR) Trend by Month in Chatham
Get Live Chatham Market Intelligence 👇

Explore Real-time Analytics
Airbnb Seasonality Analysis & Trends in Chatham (2025)
Peak Season (March, May, December)
- Revenue averages $1,226 per month
- Occupancy rates average 19.0%
- Daily rates average $205
Shoulder Season
- Revenue averages $935 per month
- Occupancy maintains around 15.8%
- Daily rates hold near $200
Low Season (June, July, September)
- Revenue drops to average $444 per month
- Occupancy decreases to average 8.7%
- Daily rates adjust to average $193
Seasonality Insights for Chatham
- The Airbnb seasonality in Chatham shows highly seasonal trends requiring careful strategy. While the sections above show seasonal averages, it's also insightful to look at the extremes:
- During the high season, the absolute peak month showcases Chatham's highest earning potential, with monthly revenues capable of climbing to $1,337, occupancy reaching a high of 21.4%, and ADRs peaking at $215.
- Conversely, the slowest single month of the year, typically falling within the low season, marks the market's lowest point. In this month, revenue might dip to $0, occupancy could drop to 0.0%, and ADRs may adjust down to $190.
- Understanding both the seasonal averages and these monthly peaks and troughs in revenue, occupancy, and ADR is crucial for maximizing your Airbnb profit potential in Chatham.
Seasonal Strategies for Maximizing Profit
- Peak Season: Maximize revenue through premium pricing and potentially longer minimum stays. Ensure high availability.
- Low Season: Offer competitive pricing, special promotions (e.g., extended stay discounts), and flexible cancellation policies. Target off-season travelers like remote workers or budget-conscious guests.
- Shoulder Seasons: Implement dynamic pricing that balances peak and low rates. Target weekend travelers or specific events. Offer slightly more flexible terms than peak season.
- Regularly analyze your own performance against these Chatham seasonality benchmarks and adjust your pricing and availability strategy accordingly.
Best Areas for Airbnb Investment in Chatham (2025)
Exploring the top neighborhoods for short-term rentals in Chatham? This section highlights key areas, outlining why they are attractive for hosts and guests, along with notable local attractions. Consider these locations based on your target guest profile and investment strategy.
| Neighborhood / Area | Why Host Here? (Target Guests & Appeal) | Key Attractions & Landmarks |
|---|---|---|
| Historic Downtown Chatham | The quaint downtown area offers charming shops, local dining options, and a glimpse of the town's history. It's ideal for guests looking to explore local culture and enjoy a small-town atmosphere. | Chatham Historic Courthouse, Chatham Community Park, Local Art Galleries, Chatham Farmers Market |
| Lake Chatham | A beautiful spot for fishing, boating, and enjoying nature. Perfect for outdoor enthusiasts and families looking for a relaxing getaway by the water. | Lake Chatham, Fishing and Boating, Picnic Areas, Hiking Trails |
| Chatham County Park | A family-friendly area with ample recreational facilities. Great for guests traveling with children and those looking to enjoy outdoor activities. | Playgrounds, Walking Trails, Sports Facilities |
| Nearby Natchez Trace Parkway | A scenic parkway offering stunning views, hiking, and exploration. An attraction for nature lovers and those interested in historical routes. | Natchez Trace Parkway, Historical Markers, Scenic Overlooks |
| Vardaman | A nearby quaint town known for its local festivals, including the annual Sweet Potato Festival. Charming and appealing for unique local experiences. | Vardaman Sweet Potato Festival, Local Shops, Nearby Nature Trails |
| Golfing Community Near Chatham | Attracts golf enthusiasts and those looking for leisure activities. Close proximity to golf courses and country clubs. | Chatham Country Club, Nearby Golf Courses |
| Chatham's Seasonal Events | Hosts various seasonal events that draw visitors year-round, providing ample opportunities for short-term rental guests. | Chatham Festivals, Parades, Local Events |
| Regional Nature Trails | Access to a network of nature trails and parks that offer walking, hiking, and exploration opportunities for outdoors lovers. | Chatham Nature Trails, Wildlife Viewing, Hiking Opportunities |
Understanding Airbnb License Requirements & STR Laws in Chatham (2025)
While Chatham, Mississippi, United States currently shows low STR regulations, specific Airbnb license requirements might still exist or change. Always verify the latest short term rental regulations and Airbnb license requirements directly with local government authorities for Chatham to ensure full compliance before hosting.
(Source: AirROI data, 2025, finding no licensed listings among those analyzed)
Top Performing Airbnb Properties in Chatham (2025)
Benchmark your potential! Explore examples of top-performing Airbnb properties in Chathambased on Trailing Twelve Month (TTM) revenue. Analyze their characteristics, revenue, occupancy rate, and ADR to understand what drives success in this market.
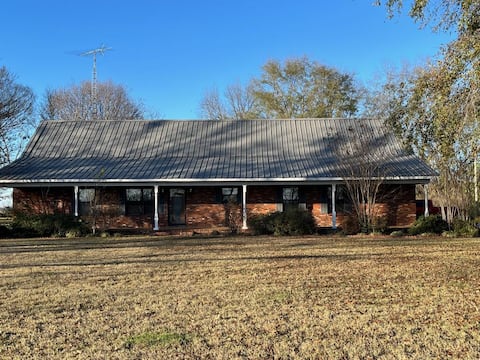
RCC - 3 Bedroom House - R1 - Cordell House
Entire Place • 3 bedrooms
Cabin on the Lake
Entire Place • 2 bedrooms
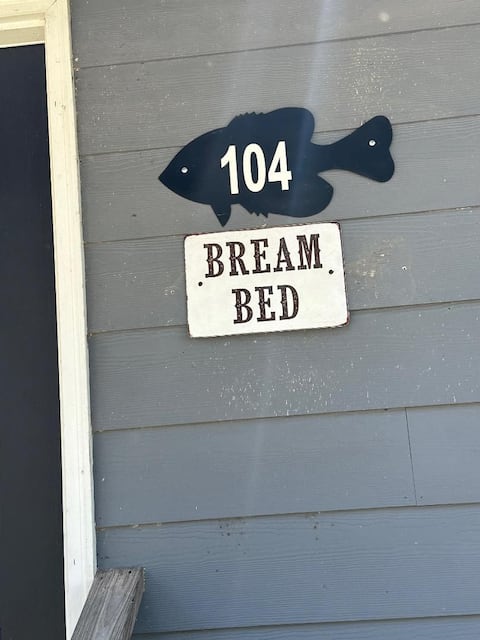
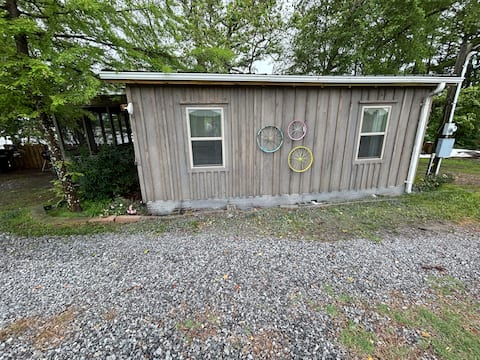
Roy's Cabins & Campgrounds - Bream Bed (BB)
Entire Place • 2 bedrooms
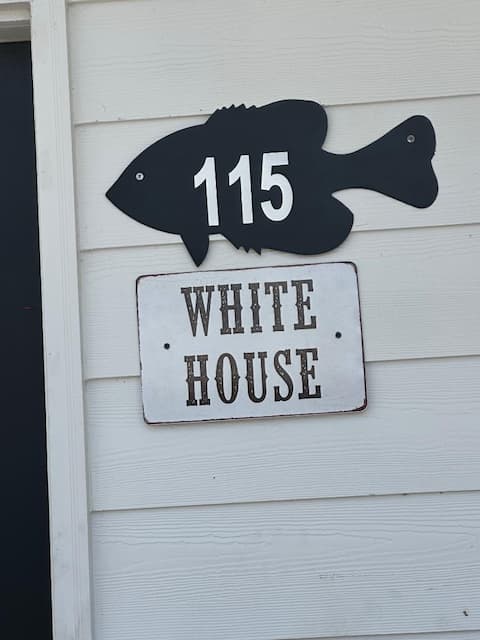
Roy's Cabins & Campgrounds - Group 2 - R1 - (NP)
Entire Place • 2 bedrooms
Large Cabin 3 Bedroom Roy's 1
Entire Place • 3 bedrooms
R2- 3bed/3bath
Entire Place • 3 bedrooms
Note: Performance varies based on location, size, amenities, seasonality, and management quality. Data reflects the past 12 months.
Top Performing Airbnb Hosts in Chatham (2025)
Learn from the best! This table showcases top-performing Airbnb hosts in Chatham based on the number of properties managed and estimated total revenue over the past year. Analyze their scale and performance metrics.
| Host Name | Properties | Grossing Revenue | Stay Reviews | Avg Rating |
|---|---|---|---|---|
| Rickey | 23 | $171,649 | 9 | 5.00/5.0 |
| Mont And Kathy | 1 | $19,669 | 17 | 4.88/5.0 |
Analyzing the strategies of top hosts, such as their property selection, pricing, and guest communication, can offer valuable lessons for optimizing your own Airbnb operations in Chatham.
Dive Deeper: Advanced Chatham STR Market Data (2025)
Ready to unlock more insights? AirROI provides access to advanced metrics and comprehensive Airbnb data for Chatham. Explore detailed analytics beyond this report to refine your investment strategy, optimize pricing, and maximize your vacation rental profits.
Explore Advanced MetricsChatham Short-Term Rental Market Composition (2025): Property & Room Types
Room Type Distribution
Property Type Distribution
Market Composition Insights for Chatham
- The Chatham Airbnb market composition is heavily skewed towards Entire Home/Apt listings, which make up 100% of the 24 active rentals. This indicates strong guest preference for privacy and space.
- Looking at the property type distribution in Chatham, Outdoor/Unique properties are the most common (91.7%), reflecting the local real estate landscape.
Chatham Airbnb Room Capacity Analysis (2025): Bedroom Distribution
Distribution of Listings by Number of Bedrooms
Room Capacity Insights for Chatham
- The dominant room capacity in Chatham is 2 bedrooms listings, making up 58.3% of the market. This suggests a strong demand for properties suitable for couples or solo travelers.
- Together, 2 bedrooms and 1 bedroom properties represent 79.1% of the active Airbnb listings in Chatham, indicating a high concentration in these sizes.
- A significant 20.8% of listings offer 3+ bedrooms, catering to larger groups and families seeking more space in Chatham.
Chatham Vacation Rental Guest Capacity Trends (2025)
Distribution of Listings by Guest Capacity
Guest Capacity Insights for Chatham
- The most common guest capacity trend in Chatham vacation rentals is listings accommodating 8+ guests (58.3%). This suggests the primary traveler segment is likely larger groups.
- Properties designed for 8+ guests and 4 guests dominate the Chatham STR market, accounting for 79.1% of listings.
- 62.5% of properties accommodate 6+ guests, serving the market segment for larger families or group travel in Chatham.
- On average, properties in Chatham are equipped to host 6.3 guests.
Chatham Airbnb Booking Patterns (2025): Available vs. Booked Days
Available Days Distribution
Booked Days Distribution
Booking Pattern Insights for Chatham
- The most common availability pattern in Chatham falls within the 271-366 days range, representing 95.8% of listings. This suggests many properties have significant open periods on their calendars.
- Approximately 100.0% of listings show high availability (181+ days open annually), indicating potential for increased bookings or specific owner usage patterns.
- For booked days, the 31-90 days range is most frequent in Chatham (50%), reflecting common guest stay durations or potential owner blocking patterns.
Chatham Airbnb Minimum Stay Requirements Analysis
Distribution of Listings by Minimum Night Requirement
1 Night
23 listings
95.8% of total
2 Nights
1 listings
4.2% of total
Key Insights
- The most prevalent minimum stay requirement in Chatham is 1 Night, adopted by 95.8% of listings. This highlights the market's preference for shorter, flexible bookings.
- A strong majority (100.0%) of the Chatham Airbnb data shows acceptance of very short stays (1-2 nights), indicating a dynamic, high-turnover market.
Recommendations
- Align with the market by considering a 1 Night minimum stay, as 95.8% of Chatham hosts use this setting.
- Adjust minimum nights based on seasonality – potentially shorter during low season and longer during peak demand periods in Chatham.
Chatham Airbnb Cancellation Policy Trends Analysis (2025)
Flexible
7 listings
100% of total
Cancellation Policy Insights for Chatham
- The prevailing Airbnb cancellation policy trend in Chatham is Flexible, used by 100% of listings.
- The market strongly favors guest-friendly terms, with 100.0% of listings offering Flexible or Moderate policies. This suggests guests in Chatham may expect booking flexibility.
Recommendations for Hosts
- Consider adopting a Flexible policy to align with the 100% market standard in Chatham.
- Given the high prevalence of Flexible policies (100%), offering this can enhance booking appeal, especially during shoulder seasons.
- Regularly review your cancellation policy against competitors and market demand shifts in Chatham.
Chatham STR Booking Lead Time Analysis (2025)
Average Booking Lead Time by Month
Booking Lead Time Insights for Chatham
- The overall average booking lead time for vacation rentals in Chatham is 34 days.
- Guests book furthest in advance for stays during May (average 76 days), likely coinciding with peak travel demand or local events.
- The shortest booking windows occur for stays in June (average 0 days), indicating more last-minute travel plans during this time.
- Seasonally, Spring (65 days avg.) sees the longest lead times, while Summer (7 days avg.) has the shortest, reflecting typical travel planning cycles.
Recommendations for Hosts
- Use the overall average lead time (34 days) as a baseline for your pricing and availability strategy in Chatham.
- For May stays, consider implementing length-of-stay discounts or slightly higher rates for bookings made less than 76 days out to capitalize on advance planning.
- During June, focus on last-minute booking availability and promotions, as guests book with very short notice (0 days avg.).
- Target marketing efforts for the Spring season well in advance (at least 65 days) to capture early planners.
- Monitor your own booking lead times against these Chatham averages to identify opportunities for dynamic pricing adjustments.
Popular & Essential Airbnb Amenities in Chatham (2025)
Amenity Prevalence
Amenity Insights for Chatham
- Essential amenities in Chatham that guests expect include: Refrigerator, Air conditioning, Microwave, Heating, Coffee maker, Lake access, Hot water, Kitchen, TV. Lacking these (any) could significantly impact bookings.
- Popular amenities like Stove are common but not universal. Offering these can provide a competitive edge.
Recommendations for Hosts
- Ensure your listing includes all essential amenities for Chatham: Refrigerator, Air conditioning, Microwave, Heating, Coffee maker, Lake access, Hot water, Kitchen, TV.
- Prioritize adding missing essentials: Kitchen, TV.
- Consider adding popular differentiators like Stove to increase appeal.
- Highlight unique or less common amenities you offer (e.g., hot tub, dedicated workspace, EV charger) in your listing description and photos.
- Regularly check competitor amenities in Chatham to stay competitive.
Chatham Airbnb Guest Demographics & Profile Analysis (2025)
Guest Profile Summary for Chatham
- The typical guest profile for Airbnb in Chatham consists of primarily domestic travelers (78%), often arriving from nearby Opelousas, typically belonging to the Post-2000s (Gen Z/Alpha) group (50%), primarily speaking English or Spanish.
- Domestic travelers account for 77.8% of guests.
- Key international markets include United States (77.8%) and United Kingdom (22.2%).
- Top languages spoken are English (77.8%) followed by Spanish (11.1%).
- A significant demographic segment is the Post-2000s (Gen Z/Alpha) group, representing 50% of guests.
Recommendations for Hosts
- Target domestic marketing efforts towards travelers from Opelousas and Gluckstadt.
- Tailor amenities and listing descriptions to appeal to the dominant Post-2000s (Gen Z/Alpha) demographic (e.g., highlight fast WiFi, smart home features, local guides).
- Highlight unique local experiences or amenities relevant to the primary guest profile.
- Consider seasonal promotions aligned with peak travel times for key origin markets.
Nearby Short-Term Rental Market Comparison
How does the Chatham Airbnb market stack up against its neighbors? Compare key performance metrics like average monthly revenue, ADR, and occupancy rates in surrounding areas to understand the broader regional STR landscape.
| Market | Active Properties | Monthly Revenue | Daily Rate | Avg. Occupancy |
|---|---|---|---|---|
| Fountain Lake | 10 | $2,949 | $243.93 | 46% |
| Cleveland | 15 | $2,343 | $199.10 | 43% |
| Greenwood | 13 | $2,210 | $259.59 | 32% |
| Pearl | 11 | $2,054 | $183.01 | 44% |
| Greenville | 15 | $2,033 | $241.42 | 34% |
| Stuttgart | 13 | $1,990 | $346.49 | 36% |
| Farmerville | 28 | $1,981 | $177.34 | 40% |
| Brandon | 71 | $1,731 | $166.13 | 44% |
| Ruston | 68 | $1,676 | $164.00 | 41% |
| Southaven | 70 | $1,668 | $189.12 | 39% |