Bay St. Louis Airbnb Market Analysis 2025: Short Term Rental Data & Vacation Rental Statistics in Mississippi, United States
Is Airbnb profitable in Bay St. Louis in 2025? Explore comprehensive Airbnb analytics for Bay St. Louis, Mississippi, United States to uncover income potential. This 2025 STR market report for Bay St. Louis, based on AirROI data from April 2024 to March 2025, reveals key trends in the niche market of 22 active listings.
Whether you're considering an Airbnb investment in Bay St. Louis, optimizing your existing vacation rental, or exploring rental arbitrage opportunities, understanding the Bay St. Louis Airbnb data is crucial. Leveraging the low regulation environment is key to maximizing your short term rental income potential. Let's dive into the specifics.
Key Bay St. Louis Airbnb Performance Metrics Overview
Monthly Airbnb Revenue Variations & Income Potential in Bay St. Louis (2025)
Understanding the monthly revenue variations for Airbnb listings in Bay St. Louis is key to maximizing your short term rental income potential. Seasonality significantly impacts earnings. Our analysis, based on data from the past 12 months, shows that the peak revenue month for STRs in Bay St. Louis is typically June, while September often presents the lowest earnings, highlighting opportunities for strategic pricing adjustments during shoulder and low seasons. Explore the typical Airbnb income in Bay St. Louis across different performance tiers:
- Best-in-class properties (Top 10%) achieve $4,219+ monthly, often utilizing dynamic pricing and superior guest experiences.
- Strong performing properties (Top 25%) earn $2,686 or more, indicating effective management and desirable locations/amenities.
- Typical properties (Median) generate around $1,653 per month, representing the average market performance.
- Entry-level properties (Bottom 25%) see earnings around $905, often with potential for optimization.
Average Monthly Airbnb Earnings Trend in Bay St. Louis
Bay St. Louis Airbnb Occupancy Rate Trends (2025)
Maximize your bookings by understanding the Bay St. Louis STR occupancy trends. Seasonal demand shifts significantly influence how often properties are booked. Typically, Junesees the highest demand (peak season occupancy), while January experiences the lowest (low season). Effective strategies, like adjusting minimum stays or offering promotions, can boost occupancy during slower periods. Here's how different property tiers perform in Bay St. Louis:
- Best-in-class properties (Top 10%) achieve 71%+ occupancy, indicating high desirability and potentially optimized availability.
- Strong performing properties (Top 25%) maintain 56% or higher occupancy, suggesting good market fit and guest satisfaction.
- Typical properties (Median) have an occupancy rate around 38%.
- Entry-level properties (Bottom 25%) average 22% occupancy, potentially facing higher vacancy.
Average Monthly Occupancy Rate Trend in Bay St. Louis
Average Daily Rate (ADR) Airbnb Trends in Bay St. Louis (2025)
Effective short term rental pricing strategy in Bay St. Louis involves understanding monthly ADR fluctuations. The Average Daily Rate (ADR) for Airbnb in Bay St. Louis typically peaks in December and dips lowest during November. Leveraging Airbnb dynamic pricing tools or strategies based on this seasonality can significantly boost revenue. Here's a look at the typical nightly rates achieved:
- Best-in-class properties (Top 10%) command rates of $262+ per night, often due to premium features or locations.
- Strong performing properties (Top 25%) achieve nightly rates of $185 or more.
- Typical properties (Median) charge around $132 per night.
- Entry-level properties (Bottom 25%) earn around $100 per night.
Average Daily Rate (ADR) Trend by Month in Bay St. Louis
Get Live Bay St. Louis Market Intelligence 👇

Explore Real-time Analytics
Airbnb Seasonality Analysis & Trends in Bay St. Louis (2025)
Peak Season (June, May, December)
- Revenue averages $3,220 per month
- Occupancy rates average 45.0%
- Daily rates average $186
Shoulder Season
- Revenue averages $2,195 per month
- Occupancy maintains around 39.9%
- Daily rates hold near $182
Low Season (August, September, October)
- Revenue drops to average $1,457 per month
- Occupancy decreases to average 34.1%
- Daily rates adjust to average $155
Seasonality Insights for Bay St. Louis
- The Airbnb seasonality in Bay St. Louis shows highly seasonal trends requiring careful strategy. While the sections above show seasonal averages, it's also insightful to look at the extremes:
- During the high season, the absolute peak month showcases Bay St. Louis's highest earning potential, with monthly revenues capable of climbing to $3,378, occupancy reaching a high of 57.2%, and ADRs peaking at $234.
- Conversely, the slowest single month of the year, typically falling within the low season, marks the market's lowest point. In this month, revenue might dip to $1,296, occupancy could drop to 30.7%, and ADRs may adjust down to $136.
- Understanding both the seasonal averages and these monthly peaks and troughs in revenue, occupancy, and ADR is crucial for maximizing your Airbnb profit potential in Bay St. Louis.
Seasonal Strategies for Maximizing Profit
- Peak Season: Maximize revenue through premium pricing and potentially longer minimum stays. Ensure high availability.
- Low Season: Offer competitive pricing, special promotions (e.g., extended stay discounts), and flexible cancellation policies. Target off-season travelers like remote workers or budget-conscious guests.
- Shoulder Seasons: Implement dynamic pricing that balances peak and low rates. Target weekend travelers or specific events. Offer slightly more flexible terms than peak season.
- Regularly analyze your own performance against these Bay St. Louis seasonality benchmarks and adjust your pricing and availability strategy accordingly.
Best Areas for Airbnb Investment in Bay St. Louis (2025)
Exploring the top neighborhoods for short-term rentals in Bay St. Louis? This section highlights key areas, outlining why they are attractive for hosts and guests, along with notable local attractions. Consider these locations based on your target guest profile and investment strategy.
| Neighborhood / Area | Why Host Here? (Target Guests & Appeal) | Key Attractions & Landmarks |
|---|---|---|
| Old Town Historic District | Charming area with Historic buildings, great for tourists interested in the local history and culture. Close to shops and restaurants, and near the beach. | Bay St. Louis Historic District, Bougainvillea Manor, Historic R. C. Smith House, Local art galleries, Old Town Merchants |
| Bay St. Louis Beach | Direct beach access makes this a prime location for vacationers looking for sun and sand. Family-friendly atmosphere with plenty of activities. | Beachfront access, Fishing and boating opportunities, Water sports, Nearby beachfront restaurants, Scenic views |
| The Pass Christian | Popular nearby town with great dining and beach access, attracting visitors who want a quieter experience. Known for its upscale homes and charm. | Pass Christian Beach, The Pass Christian Yacht Club, Local shops and dining, Live Oak Avenue, Old Town historic area |
| Bay St. Louis Marina | Great for those who enjoy boating and fishing. The marina area offers beautiful views and a relaxed atmosphere, popular with locals and visitors alike. | Bay St. Louis Marina, Fishing charters, Waterfront dining, Beach park, Scenic waterfront views |
| Waveland Beach | Quieter beach area that appeals to families and travelers seeking a peaceful getaway. Offers great local attractions and is just a short drive from Bay St. Louis. | Waveland Beach, Waveland Community Center, Local playgrounds and parks, Nearby nature trails, Dining options along the beach |
| Louisiana Purchase | A neighborhood recognized for its laid-back lifestyle and proximity to nature trails. Popular among those who enjoy outdoor activities. | Nature trails, Birdwatching opportunities, Local parks, Quiet residential streets, Nearby water activities |
| Bayou View | A residential area with beautiful views and access to local amenities. Attracting families and long-term guests that appreciate something homey. | Local parks, Community activities, Nearby shopping, Scenic views of the bay, Family-friendly environment |
| Pine Grove | A hidden gem that boasts a peaceful atmosphere with community charm. Attractive for those seeking long term rentals and a neighborly feel. | Community parks, Local shops, Events and fairs, Family-friendly activities, Nature walks |
Understanding Airbnb License Requirements & STR Laws in Bay St. Louis (2025)
While Bay St. Louis, Mississippi, United States currently shows low STR regulations, specific Airbnb license requirements might still exist or change. Always verify the latest short term rental regulations and Airbnb license requirements directly with local government authorities for Bay St. Louis to ensure full compliance before hosting.
(Source: AirROI data, 2025, finding no licensed listings among those analyzed)
Top Performing Airbnb Properties in Bay St. Louis (2025)
Benchmark your potential! Explore examples of top-performing Airbnb properties in Bay St. Louisbased on Trailing Twelve Month (TTM) revenue. Analyze their characteristics, revenue, occupancy rate, and ADR to understand what drives success in this market.

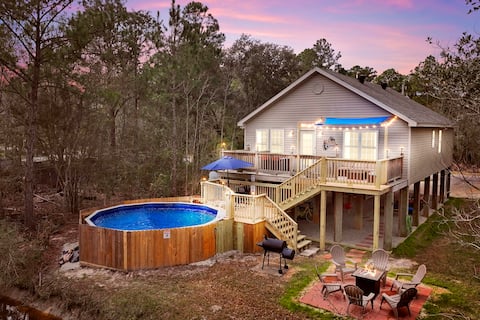
Modern Bayou Home | Pool and Tennis Court
Entire Place • 5 bedrooms
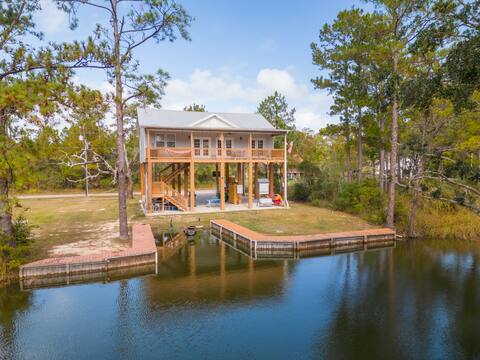
Waterfront Pool, Hot Tub, Game Area Bay St. Louis
Entire Place • 3 bedrooms
New Home Waterfront Near NOLA Gulf Beach Casino
Entire Place • 3 bedrooms

Bay-Cay Getaway! Beaching-Casino-Grilling-Swimming
Entire Place • 1 bedroom

Nature Escape in Bay St. Louis
Entire Place • 3 bedrooms
Beautiful home away from home(II)
Entire Place • 3 bedrooms
Note: Performance varies based on location, size, amenities, seasonality, and management quality. Data reflects the past 12 months.
Top Performing Airbnb Hosts in Bay St. Louis (2025)
Learn from the best! This table showcases top-performing Airbnb hosts in Bay St. Louis based on the number of properties managed and estimated total revenue over the past year. Analyze their scale and performance metrics.
| Host Name | Properties | Grossing Revenue | Stay Reviews | Avg Rating |
|---|---|---|---|---|
| Host #276892829 | 1 | $75,126 | 8 | 4.75/5.0 |
| Jeremy And Katrina | 1 | $52,650 | 50 | 4.92/5.0 |
| Mirela | 2 | $41,531 | 40 | 4.96/5.0 |
| Dmitry | 1 | $28,446 | 101 | 4.83/5.0 |
| Scotty | 1 | $27,143 | 234 | 4.94/5.0 |
| Konti | 1 | $27,040 | 74 | 4.72/5.0 |
| Linda & Tom | 1 | $19,154 | 47 | 4.72/5.0 |
| Jerry & Nela | 1 | $17,931 | 67 | 4.87/5.0 |
| Host #223586252 | 1 | $14,832 | 3 | 5.00/5.0 |
| Lauren | 1 | $14,718 | 64 | 4.91/5.0 |
Analyzing the strategies of top hosts, such as their property selection, pricing, and guest communication, can offer valuable lessons for optimizing your own Airbnb operations in Bay St. Louis.
Dive Deeper: Advanced Bay St. Louis STR Market Data (2025)
Ready to unlock more insights? AirROI provides access to advanced metrics and comprehensive Airbnb data for Bay St. Louis. Explore detailed analytics beyond this report to refine your investment strategy, optimize pricing, and maximize your vacation rental profits.
Explore Advanced MetricsBay St. Louis Short-Term Rental Market Composition (2025): Property & Room Types
Room Type Distribution
Property Type Distribution
Market Composition Insights for Bay St. Louis
- The Bay St. Louis Airbnb market composition is heavily skewed towards Entire Home/Apt listings, which make up 86.4% of the 22 active rentals. This indicates strong guest preference for privacy and space.
- Looking at the property type distribution in Bay St. Louis, House properties are the most common (86.4%), reflecting the local real estate landscape.
- Houses represent a significant 86.4% portion, catering likely to families or larger groups.
- The presence of 9.1% Hotel/Boutique listings indicates integration with traditional hospitality.
- Smaller segments like others (combined 4.5%) offer potential for unique stay experiences.
Bay St. Louis Airbnb Room Capacity Analysis (2025): Bedroom Distribution
Distribution of Listings by Number of Bedrooms
Room Capacity Insights for Bay St. Louis
- The dominant room capacity in Bay St. Louis is 3 bedrooms listings, making up 50% of the market. This suggests a strong demand for properties suitable for families or small groups.
- Together, 3 bedrooms and 1 bedroom properties represent 72.7% of the active Airbnb listings in Bay St. Louis, indicating a high concentration in these sizes.
- A significant 54.5% of listings offer 3+ bedrooms, catering to larger groups and families seeking more space in Bay St. Louis.
Bay St. Louis Vacation Rental Guest Capacity Trends (2025)
Distribution of Listings by Guest Capacity
Guest Capacity Insights for Bay St. Louis
- The most common guest capacity trend in Bay St. Louis vacation rentals is listings accommodating 8+ guests (31.8%). This suggests the primary traveler segment is likely larger groups.
- Properties designed for 8+ guests and 6 guests dominate the Bay St. Louis STR market, accounting for 54.5% of listings.
- 59.0% of properties accommodate 6+ guests, serving the market segment for larger families or group travel in Bay St. Louis.
- On average, properties in Bay St. Louis are equipped to host 5.0 guests.
Bay St. Louis Airbnb Booking Patterns (2025): Available vs. Booked Days
Available Days Distribution
Booked Days Distribution
Booking Pattern Insights for Bay St. Louis
- The most common availability pattern in Bay St. Louis falls within the 181-270 days range, representing 54.5% of listings. This suggests many properties have significant open periods on their calendars.
- Approximately 81.8% of listings show high availability (181+ days open annually), indicating potential for increased bookings or specific owner usage patterns.
- For booked days, the 91-180 days range is most frequent in Bay St. Louis (54.5%), reflecting common guest stay durations or potential owner blocking patterns.
- A notable 18.1% of properties secure long booking periods (181+ days booked per year), highlighting successful long-term rental strategies or significant owner usage.
Bay St. Louis Airbnb Minimum Stay Requirements Analysis
Distribution of Listings by Minimum Night Requirement
1 Night
7 listings
38.9% of total
2 Nights
8 listings
44.4% of total
4-6 Nights
1 listings
5.6% of total
30+ Nights
2 listings
11.1% of total
Key Insights
- The most prevalent minimum stay requirement in Bay St. Louis is 2 Nights, adopted by 44.4% of listings. This highlights the market's preference for shorter, flexible bookings.
- A strong majority (83.3%) of the Bay St. Louis Airbnb data shows acceptance of very short stays (1-2 nights), indicating a dynamic, high-turnover market.
- A significant segment (11.1%) caters to monthly stays (30+ nights) in Bay St. Louis, pointing to opportunities in the extended-stay market.
Recommendations
- Align with the market by considering a 2 Nights minimum stay, as 44.4% of Bay St. Louis hosts use this setting.
- Explore offering discounts for stays of 30+ nights to attract the 11.1% of the market seeking extended stays.
- Adjust minimum nights based on seasonality – potentially shorter during low season and longer during peak demand periods in Bay St. Louis.
Bay St. Louis Airbnb Cancellation Policy Trends Analysis (2025)
Flexible
6 listings
31.6% of total
Moderate
7 listings
36.8% of total
Firm
3 listings
15.8% of total
Strict
3 listings
15.8% of total
Cancellation Policy Insights for Bay St. Louis
- The prevailing Airbnb cancellation policy trend in Bay St. Louis is Moderate, used by 36.8% of listings.
- There's a relatively balanced mix between guest-friendly (68.4%) and stricter (31.6%) policies, offering choices for different guest needs.
Recommendations for Hosts
- Consider adopting a Moderate policy to align with the 36.8% market standard in Bay St. Louis.
- Regularly review your cancellation policy against competitors and market demand shifts in Bay St. Louis.
Bay St. Louis STR Booking Lead Time Analysis (2025)
Average Booking Lead Time by Month
Booking Lead Time Insights for Bay St. Louis
- The overall average booking lead time for vacation rentals in Bay St. Louis is 36 days.
- Guests book furthest in advance for stays during September (average 46 days), likely coinciding with peak travel demand or local events.
- The shortest booking windows occur for stays in January (average 15 days), indicating more last-minute travel plans during this time.
- Seasonally, Fall (44 days avg.) sees the longest lead times, while Winter (26 days avg.) has the shortest, reflecting typical travel planning cycles.
Recommendations for Hosts
- Use the overall average lead time (36 days) as a baseline for your pricing and availability strategy in Bay St. Louis.
- Target marketing efforts for the Fall season well in advance (at least 44 days) to capture early planners.
- Monitor your own booking lead times against these Bay St. Louis averages to identify opportunities for dynamic pricing adjustments.
Popular & Essential Airbnb Amenities in Bay St. Louis (2025)
Amenity Prevalence
Amenity Insights for Bay St. Louis
- Essential amenities in Bay St. Louis that guests expect include: Free parking on premises, Smoke alarm, Air conditioning, TV, Wifi. Lacking these (any) could significantly impact bookings.
- Popular amenities like Hot water, Heating, Essentials are common but not universal. Offering these can provide a competitive edge.
Recommendations for Hosts
- Ensure your listing includes all essential amenities for Bay St. Louis: Free parking on premises, Smoke alarm, Air conditioning, TV, Wifi.
- Prioritize adding missing essentials: Free parking on premises, Smoke alarm, Air conditioning, TV, Wifi.
- Consider adding popular differentiators like Hot water or Heating to increase appeal.
- Highlight unique or less common amenities you offer (e.g., hot tub, dedicated workspace, EV charger) in your listing description and photos.
- Regularly check competitor amenities in Bay St. Louis to stay competitive.
Bay St. Louis Airbnb Guest Demographics & Profile Analysis (2025)
Guest Profile Summary for Bay St. Louis
- The typical guest profile for Airbnb in Bay St. Louis consists of primarily domestic travelers (99%), often arriving from nearby New Orleans, typically belonging to the Post-2000s (Gen Z/Alpha) group (50%), primarily speaking English or Spanish.
- Domestic travelers account for 99.0% of guests.
- Key international markets include United States (99%) and Taiwan (0.5%).
- Top languages spoken are English (85.6%) followed by Spanish (6.4%).
- A significant demographic segment is the Post-2000s (Gen Z/Alpha) group, representing 50% of guests.
Recommendations for Hosts
- Target domestic marketing efforts towards travelers from New Orleans and Baton Rouge.
- Tailor amenities and listing descriptions to appeal to the dominant Post-2000s (Gen Z/Alpha) demographic (e.g., highlight fast WiFi, smart home features, local guides).
- Highlight unique local experiences or amenities relevant to the primary guest profile.
- Consider seasonal promotions aligned with peak travel times for key origin markets.
Nearby Short-Term Rental Market Comparison
How does the Bay St. Louis Airbnb market stack up against its neighbors? Compare key performance metrics like average monthly revenue, ADR, and occupancy rates in surrounding areas to understand the broader regional STR landscape.
| Market | Active Properties | Monthly Revenue | Daily Rate | Avg. Occupancy |
|---|---|---|---|---|
| Plaquemines Parish | 17 | $5,731 | $403.09 | 44% |
| New Orleans | 4,773 | $3,257 | $265.83 | 44% |
| Dauphin Island | 533 | $3,115 | $314.20 | 37% |
| Grand Isle | 85 | $3,090 | $396.15 | 33% |
| Petal | 13 | $2,931 | $201.09 | 49% |
| Covington | 54 | $2,880 | $217.27 | 45% |
| Abita Springs | 18 | $2,702 | $185.36 | 48% |
| Chauvin | 15 | $2,698 | $268.15 | 32% |
| Pass Christian | 151 | $2,558 | $254.21 | 36% |
| Prairieville | 17 | $2,478 | $194.92 | 42% |