Windemere Township Airbnb Market Analysis 2026: Short Term Rental Data & Vacation Rental Statistics in Minnesota, United States
Is Airbnb profitable in Windemere Township in 2026? Explore comprehensive Airbnb analytics for Windemere Township, Minnesota, United States to uncover income potential. This 2026 STR market report for Windemere Township, based on AirROI data from February 2025 to January 2026, reveals key trends in the niche market of 19 active listings.
Whether you're considering an Airbnb investment in Windemere Township, optimizing your existing vacation rental, or exploring rental arbitrage opportunities, understanding the Windemere Township Airbnb data is crucial. Leveraging the low regulation environment is key to maximizing your short term rental income potential. Let's dive into the specifics.
Key Windemere Township Airbnb Performance Metrics Overview
Monthly Airbnb Revenue Variations & Income Potential in Windemere Township (2026)
Understanding the monthly revenue variations for Airbnb listings in Windemere Township is key to maximizing your short term rental income potential. Seasonality significantly impacts earnings. Our analysis, based on data from the past 12 months, shows that the peak revenue month for STRs in Windemere Township is typically July, while February often presents the lowest earnings, highlighting opportunities for strategic pricing adjustments during shoulder and low seasons. Explore the typical Airbnb income in Windemere Township across different performance tiers:
- Best-in-class properties (Top 10%) achieve $6,773+ monthly, often utilizing dynamic pricing and superior guest experiences.
- Strong performing properties (Top 25%) earn $5,253 or more, indicating effective management and desirable locations/amenities.
- Typical properties (Median) generate around $3,536 per month, representing the average market performance.
- Entry-level properties (Bottom 25%) see earnings around $2,331, often with potential for optimization.
Average Monthly Airbnb Earnings Trend in Windemere Township
Windemere Township Airbnb Occupancy Rate Trends (2026)
Maximize your bookings by understanding the Windemere Township STR occupancy trends. Seasonal demand shifts significantly influence how often properties are booked. Typically, Julysees the highest demand (peak season occupancy), while December experiences the lowest (low season). Effective strategies, like adjusting minimum stays or offering promotions, can boost occupancy during slower periods. Here's how different property tiers perform in Windemere Township:
- Best-in-class properties (Top 10%) achieve 73%+ occupancy, indicating high desirability and potentially optimized availability.
- Strong performing properties (Top 25%) maintain 63% or higher occupancy, suggesting good market fit and guest satisfaction.
- Typical properties (Median) have an occupancy rate around 49%.
- Entry-level properties (Bottom 25%) average 32% occupancy, potentially facing higher vacancy.
Average Monthly Occupancy Rate Trend in Windemere Township
Average Daily Rate (ADR) Airbnb Trends in Windemere Township (2026)
Effective short term rental pricing strategy in Windemere Township involves understanding monthly ADR fluctuations. The Average Daily Rate (ADR) for Airbnb in Windemere Township typically peaks in June and dips lowest during February. Leveraging Airbnb dynamic pricing tools or strategies based on this seasonality can significantly boost revenue. Here's a look at the typical nightly rates achieved:
- Best-in-class properties (Top 10%) command rates of $439+ per night, often due to premium features or locations.
- Strong performing properties (Top 25%) achieve nightly rates of $380 or more.
- Typical properties (Median) charge around $250 per night.
- Entry-level properties (Bottom 25%) earn around $184 per night.
Average Daily Rate (ADR) Trend by Month in Windemere Township
Get Live Windemere Township Market Intelligence 👇

Explore Real-time Analytics
Airbnb Seasonality Analysis & Trends in Windemere Township (2026)
Peak Season (July, August, June)
- Revenue averages $6,928 per month
- Occupancy rates average 75.2%
- Daily rates average $295
Shoulder Season
- Revenue averages $3,236 per month
- Occupancy maintains around 41.3%
- Daily rates hold near $279
Low Season (February, March, April)
- Revenue drops to average $2,030 per month
- Occupancy decreases to average 35.9%
- Daily rates adjust to average $261
Seasonality Insights for Windemere Township
- The Airbnb seasonality in Windemere Township shows highly seasonal trends requiring careful strategy. While the sections above show seasonal averages, it's also insightful to look at the extremes:
- During the high season, the absolute peak month showcases Windemere Township's highest earning potential, with monthly revenues capable of climbing to $7,594, occupancy reaching a high of 81.2%, and ADRs peaking at $301.
- Conversely, the slowest single month of the year, typically falling within the low season, marks the market's lowest point. In this month, revenue might dip to $1,636, occupancy could drop to 32.0%, and ADRs may adjust down to $248.
- Understanding both the seasonal averages and these monthly peaks and troughs in revenue, occupancy, and ADR is crucial for maximizing your Airbnb profit potential in Windemere Township.
Seasonal Strategies for Maximizing Profit
- Peak Season: Maximize revenue through premium pricing and potentially longer minimum stays. Ensure high availability.
- Low Season: Offer competitive pricing, special promotions (e.g., extended stay discounts), and flexible cancellation policies. Target off-season travelers like remote workers or budget-conscious guests.
- Shoulder Seasons: Implement dynamic pricing that balances peak and low rates. Target weekend travelers or specific events. Offer slightly more flexible terms than peak season.
- Regularly analyze your own performance against these Windemere Township seasonality benchmarks and adjust your pricing and availability strategy accordingly.
Best Areas for Airbnb Investment in Windemere Township (2026)
Exploring the top neighborhoods for short-term rentals in Windemere Township? This section highlights key areas, outlining why they are attractive for hosts and guests, along with notable local attractions. Consider these locations based on your target guest profile and investment strategy.
| Neighborhood / Area | Why Host Here? (Target Guests & Appeal) | Key Attractions & Landmarks |
|---|---|---|
| Lakefront | A picturesque area with beautiful views of the lake, perfect for those seeking a serene getaway. It's popular among families and couples looking for a vacation retreat. | Lake Windermeer, Windermeer State Park, Scenic walking trails, Picnic areas, Fishing spots |
| Downtown Windemere | The heart of the township, offering convenient access to local businesses and amenities. Great for guests who want to explore local culture and dining. | Local cafes and restaurants, Windemere Historical Society, Art galleries, Community events |
| Hiking Trails | Surrounding areas filled with stunning hiking paths attract outdoor enthusiasts. Ideal for guests interested in nature and adventure. | Windemere Hiking Trail, Scenic overlooks, Nature observation, Wildlife spotting |
| Winter Sports Area | Known for winter activities, this area draws in tourists seeking skiing and snowboarding experiences. | Ski resorts, Snowshoeing trails, Ice fishing spots, Winter festivals |
| Golf Course Area | Perfect for golf enthusiasts, with several well-maintained golf courses in the vicinity, catering to both novices and experienced players. | Windemere Golf Course, Driving range, Golf clubs and stores |
| Family Recreation | An ideal area for families, featuring parks, play areas, and family-friendly attractions. | Kids' playgrounds, Picnic spots, Sports fields, Family events |
| Historical Sites | Rich in history, this area attracts tourists interested in the cultural heritage of Windemere. | Old Windemere Church, Local museums, Historical landmarks |
| Wildlife Reserves | Offering a unique chance to connect with nature, this area is perfect for eco-tourists and wildlife lovers. | Wildlife reserves, Bird watching, Nature trails |
Understanding Airbnb License Requirements & STR Laws in Windemere Township (2026)
While Windemere Township, Minnesota, United States currently shows low STR regulations, specific Airbnb license requirements might still exist or change. Always verify the latest short term rental regulations and Airbnb license requirements directly with local government authorities for Windemere Township to ensure full compliance before hosting.
(Source: AirROI data, 2026, finding no licensed listings among those analyzed)
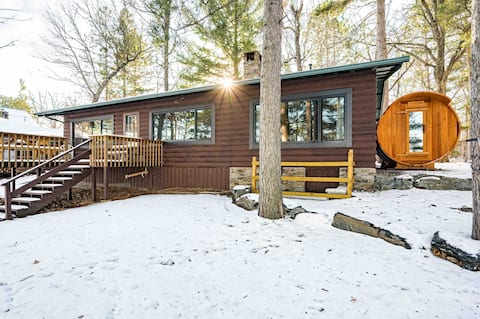
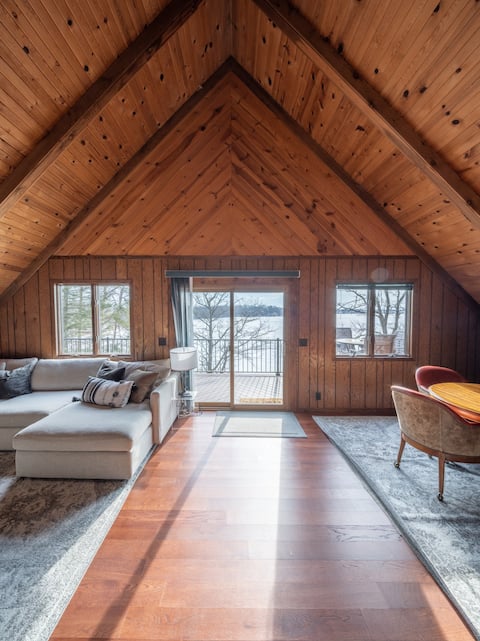
Top Performing Airbnb Properties in Windemere Township (2026)
Benchmark your potential! Explore examples of top-performing Airbnb properties in Windemere Townshipbased on Trailing Twelve Month (TTM) revenue. Analyze their characteristics, revenue, occupancy rate, and ADR to understand what drives success in this market.

4br/2ba lakefront. Hot tub. Pontoon.Near trails
Entire Place • 4 bedrooms
WhisperingPines- SAUNA-GOLF-Fish-Hot Tub-SWIM
Entire Place • 2 bedrooms
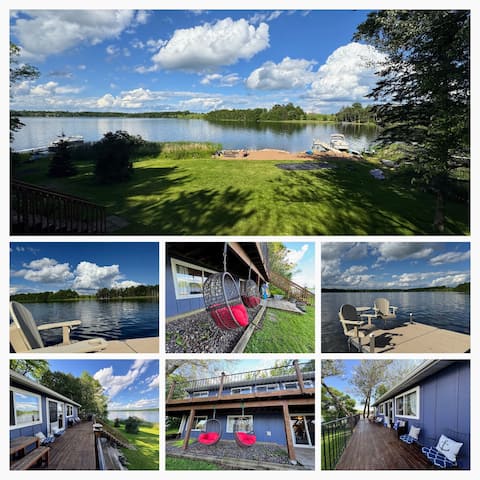
Two Acres On The Lake - Beach, Games and Sauna
Entire Place • 3 bedrooms

3b+loft/2ba. Level lot.Hot tub.Near trails.Pontoon
Entire Place • 3 bedrooms
Modern A-Frame Cabin w/ Amazing Sunrise Lake Views
Entire Place • 3 bedrooms
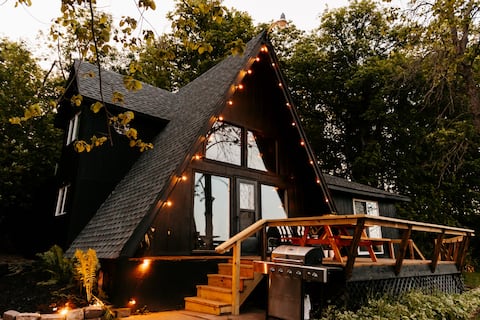
Peaceful A-frame cabin on Sturgeon Island
Entire Place • 3 bedrooms
Note: Performance varies based on location, size, amenities, seasonality, and management quality. Data reflects the past 12 months.
Top Performing Airbnb Hosts in Windemere Township (2026)
Learn from the best! This table showcases top-performing Airbnb hosts in Windemere Township based on the number of properties managed and estimated total revenue over the past year. Analyze their scale and performance metrics.
| Host Name | Properties | Grossing Revenue | Stay Reviews | Avg Rating |
|---|---|---|---|---|
| Katie | 3 | $144,194 | 121 | 4.99/5.0 |
| Skylor | 2 | $86,038 | 299 | 4.91/5.0 |
| Brian | 1 | $66,605 | 120 | 4.89/5.0 |
| Eric | 2 | $64,310 | 123 | 4.85/5.0 |
| Elizabeth | 1 | $50,462 | 218 | 4.79/5.0 |
| Marissa | 1 | $50,210 | 140 | 4.95/5.0 |
| Terry | 1 | $40,822 | 2 | Not Rated |
| Carri | 1 | $38,172 | 90 | 4.99/5.0 |
| Adam | 1 | $38,051 | 15 | 5.00/5.0 |
| Brett | 1 | $36,666 | 56 | 4.96/5.0 |
Analyzing the strategies of top hosts, such as their property selection, pricing, and guest communication, can offer valuable lessons for optimizing your own Airbnb operations in Windemere Township.
Dive Deeper: Advanced Windemere Township STR Market Data (2026)
Ready to unlock more insights? AirROI provides access to advanced metrics and comprehensive Airbnb data for Windemere Township. Explore detailed analytics beyond this report to refine your investment strategy, optimize pricing, and maximize your vacation rental profits.
Explore Advanced MetricsWindemere Township Short-Term Rental Market Composition (2026): Property & Room Types
Room Type Distribution
Property Type Distribution
Market Composition Insights for Windemere Township
- The Windemere Township Airbnb market composition is heavily skewed towards Entire Home/Apt listings, which make up 100% of the 19 active rentals. This indicates strong guest preference for privacy and space.
- Looking at the property type distribution in Windemere Township, Outdoor/Unique properties are the most common (73.7%), reflecting the local real estate landscape.
- Houses represent a significant 26.3% portion, catering likely to families or larger groups.
Windemere Township Airbnb Room Capacity Analysis (2026): Bedroom Distribution
Distribution of Listings by Number of Bedrooms
Room Capacity Insights for Windemere Township
- The dominant room capacity in Windemere Township is 3 bedrooms listings, making up 47.4% of the market. This suggests a strong demand for properties suitable for families or small groups.
- Together, 3 bedrooms and 2 bedrooms properties represent 79.0% of the active Airbnb listings in Windemere Township, indicating a high concentration in these sizes.
- A significant 63.2% of listings offer 3+ bedrooms, catering to larger groups and families seeking more space in Windemere Township.
Windemere Township Vacation Rental Guest Capacity Trends (2026)
Distribution of Listings by Guest Capacity
Guest Capacity Insights for Windemere Township
- The most common guest capacity trend in Windemere Township vacation rentals is listings accommodating 8+ guests (47.4%). This suggests the primary traveler segment is likely larger groups.
- Properties designed for 8+ guests and 6 guests dominate the Windemere Township STR market, accounting for 73.7% of listings.
- 79.0% of properties accommodate 6+ guests, serving the market segment for larger families or group travel in Windemere Township.
- On average, properties in Windemere Township are equipped to host 6.6 guests.
Windemere Township Airbnb Booking Patterns (2026): Available vs. Booked Days
Available Days Distribution
Booked Days Distribution
Booking Pattern Insights for Windemere Township
- The most common availability pattern in Windemere Township falls within the 181-270 days range, representing 68.4% of listings. This suggests many properties have significant open periods on their calendars.
- Approximately 84.2% of listings show high availability (181+ days open annually), indicating potential for increased bookings or specific owner usage patterns.
- For booked days, the 91-180 days range is most frequent in Windemere Township (68.4%), reflecting common guest stay durations or potential owner blocking patterns.
- A notable 15.8% of properties secure long booking periods (181+ days booked per year), highlighting successful long-term rental strategies or significant owner usage.
Windemere Township Airbnb Minimum Stay Requirements Analysis
Distribution of Listings by Minimum Night Requirement
1 Night
2 listings
10.5% of total
2 Nights
5 listings
26.3% of total
3 Nights
1 listings
5.3% of total
30+ Nights
11 listings
57.9% of total
Key Insights
- The most prevalent minimum stay requirement in Windemere Township is 30+ Nights, adopted by 57.9% of listings. This highlights the market's preference for longer commitments.
- A significant segment (57.9%) caters to monthly stays (30+ nights) in Windemere Township, pointing to opportunities in the extended-stay market.
Recommendations
- Align with the market by considering a 30+ Nights minimum stay, as 57.9% of Windemere Township hosts use this setting.
- If feasible, allowing 1-night stays, especially midweek or during low season, could capture last-minute bookings, as only 10.5% currently do.
- Explore offering discounts for stays of 30+ nights to attract the 57.9% of the market seeking extended stays.
- Adjust minimum nights based on seasonality – potentially shorter during low season and longer during peak demand periods in Windemere Township.
Windemere Township Airbnb Cancellation Policy Trends Analysis (2026)
Super Strict 60 Days
1 listings
5.3% of total
Flexible
2 listings
10.5% of total
Moderate
2 listings
10.5% of total
Firm
13 listings
68.4% of total
Strict
1 listings
5.3% of total
Cancellation Policy Insights for Windemere Township
- The prevailing Airbnb cancellation policy trend in Windemere Township is Firm, used by 68.4% of listings.
- A majority (73.7%) of hosts in Windemere Township utilize Firm or Strict policies, indicating a market where hosts prioritize booking security.
- Strict cancellation policies are quite rare (5.3%), potentially making listings with this policy less competitive unless justified by high demand or property type.
Recommendations for Hosts
- Consider adopting a Firm policy to align with the 68.4% market standard in Windemere Township.
- Using a Strict policy might deter some guests, as only 5.3% of listings use it. Evaluate if potential revenue protection outweighs possible lower booking rates.
- Regularly review your cancellation policy against competitors and market demand shifts in Windemere Township.
Windemere Township STR Booking Lead Time Analysis (2026)
Average Booking Lead Time by Month
Booking Lead Time Insights for Windemere Township
- The overall average booking lead time for vacation rentals in Windemere Township is 65 days.
- Guests book furthest in advance for stays during July (average 133 days), likely coinciding with peak travel demand or local events.
- The shortest booking windows occur for stays in March (average 10 days), indicating more last-minute travel plans during this time.
- Seasonally, Summer (110 days avg.) sees the longest lead times, while Winter (25 days avg.) has the shortest, reflecting typical travel planning cycles.
Recommendations for Hosts
- Use the overall average lead time (65 days) as a baseline for your pricing and availability strategy in Windemere Township.
- For July stays, consider implementing length-of-stay discounts or slightly higher rates for bookings made less than 133 days out to capitalize on advance planning.
- During March, focus on last-minute booking availability and promotions, as guests book with very short notice (10 days avg.).
- Target marketing efforts for the Summer season well in advance (at least 110 days) to capture early planners.
- Monitor your own booking lead times against these Windemere Township averages to identify opportunities for dynamic pricing adjustments.
Popular & Essential Airbnb Amenities in Windemere Township (2026)
Amenity Prevalence
Amenity Insights for Windemere Township
- Essential amenities in Windemere Township that guests expect include: Free parking on premises, TV, Hot water, Kitchen, Smoke alarm. Lacking these (any) could significantly impact bookings.
- Popular amenities like Heating, Bed linens, Dishes and silverware are common but not universal. Offering these can provide a competitive edge.
Recommendations for Hosts
- Ensure your listing includes all essential amenities for Windemere Township: Free parking on premises, TV, Hot water, Kitchen, Smoke alarm.
- Consider adding popular differentiators like Heating or Bed linens to increase appeal.
- Highlight unique or less common amenities you offer (e.g., hot tub, dedicated workspace, EV charger) in your listing description and photos.
- Regularly check competitor amenities in Windemere Township to stay competitive.
Windemere Township Airbnb Guest Demographics & Profile Analysis (2026)
Guest Profile Summary for Windemere Township
- The typical guest profile for Airbnb in Windemere Township consists of primarily domestic travelers (97%), often arriving from nearby Minneapolis, typically belonging to the Post-2000s (Gen Z/Alpha) group (50%), primarily speaking English or Spanish.
- Domestic travelers account for 96.6% of guests.
- Key international markets include United States (96.6%) and Australia (1%).
- Top languages spoken are English (83.1%) followed by Spanish (9.6%).
- A significant demographic segment is the Post-2000s (Gen Z/Alpha) group, representing 50% of guests.
Recommendations for Hosts
- Target domestic marketing efforts towards travelers from Minneapolis and Saint Paul.
- Tailor amenities and listing descriptions to appeal to the dominant Post-2000s (Gen Z/Alpha) demographic (e.g., highlight fast WiFi, smart home features, local guides).
- Highlight unique local experiences or amenities relevant to the primary guest profile.
- Consider seasonal promotions aligned with peak travel times for key origin markets.
Nearby Short-Term Rental Market Comparison
How does the Windemere Township Airbnb market stack up against its neighbors? Compare key performance metrics like average monthly revenue, ADR, and occupancy rates in surrounding areas to understand the broader regional STR landscape.
| Market | Active Properties | Monthly Revenue | Daily Rate | Avg. Occupancy |
|---|---|---|---|---|
| Town of Minong | 21 | $5,818 | $576.90 | 41% |
| Lake No. 2 | 24 | $5,702 | $377.58 | 51% |
| Shoreview | 12 | $5,525 | $470.30 | 56% |
| Town of Clover | 13 | $5,047 | $303.16 | 53% |
| Morse Township | 11 | $4,903 | $340.12 | 53% |
| Forest Lake | 25 | $4,839 | $398.24 | 47% |
| Grand Lake Township | 11 | $4,834 | $345.41 | 46% |
| Silver Creek Township | 19 | $4,600 | $348.22 | 53% |
| Hillman | 10 | $4,599 | $424.33 | 40% |
| Fridley | 26 | $4,404 | $294.56 | 54% |