Saint Paul Airbnb Market Analysis 2026: Short Term Rental Data & Vacation Rental Statistics in Minnesota, United States
Is Airbnb profitable in Saint Paul in 2026? Explore comprehensive Airbnb analytics for Saint Paul, Minnesota, United States to uncover income potential. This 2026 STR market report for Saint Paul, based on AirROI data from February 2025 to January 2026, reveals key trends in the market of 621 active listings.
Whether you're considering an Airbnb investment in Saint Paul, optimizing your existing vacation rental, or exploring rental arbitrage opportunities, understanding the Saint Paul Airbnb data is crucial. Understanding the local regulations is key to maximizing your short term rental income potential. Let's dive into the specifics.
Key Saint Paul Airbnb Performance Metrics Overview
Monthly Airbnb Revenue Variations & Income Potential in Saint Paul (2026)
Understanding the monthly revenue variations for Airbnb listings in Saint Paul is key to maximizing your short term rental income potential. Seasonality significantly impacts earnings. Our analysis, based on data from the past 12 months, shows that the peak revenue month for STRs in Saint Paul is typically August, while February often presents the lowest earnings, highlighting opportunities for strategic pricing adjustments during shoulder and low seasons. Explore the typical Airbnb income in Saint Paul across different performance tiers:
- Best-in-class properties (Top 10%) achieve $5,960+ monthly, often utilizing dynamic pricing and superior guest experiences.
- Strong performing properties (Top 25%) earn $3,844 or more, indicating effective management and desirable locations/amenities.
- Typical properties (Median) generate around $2,327 per month, representing the average market performance.
- Entry-level properties (Bottom 25%) see earnings around $1,199, often with potential for optimization.
Average Monthly Airbnb Earnings Trend in Saint Paul
Saint Paul Airbnb Occupancy Rate Trends (2026)
Maximize your bookings by understanding the Saint Paul STR occupancy trends. Seasonal demand shifts significantly influence how often properties are booked. Typically, Augustsees the highest demand (peak season occupancy), while January experiences the lowest (low season). Effective strategies, like adjusting minimum stays or offering promotions, can boost occupancy during slower periods. Here's how different property tiers perform in Saint Paul:
- Best-in-class properties (Top 10%) achieve 84%+ occupancy, indicating high desirability and potentially optimized availability.
- Strong performing properties (Top 25%) maintain 71% or higher occupancy, suggesting good market fit and guest satisfaction.
- Typical properties (Median) have an occupancy rate around 51%.
- Entry-level properties (Bottom 25%) average 32% occupancy, potentially facing higher vacancy.
Average Monthly Occupancy Rate Trend in Saint Paul
Average Daily Rate (ADR) Airbnb Trends in Saint Paul (2026)
Effective short term rental pricing strategy in Saint Paul involves understanding monthly ADR fluctuations. The Average Daily Rate (ADR) for Airbnb in Saint Paul typically peaks in December and dips lowest during February. Leveraging Airbnb dynamic pricing tools or strategies based on this seasonality can significantly boost revenue. Here's a look at the typical nightly rates achieved:
- Best-in-class properties (Top 10%) command rates of $313+ per night, often due to premium features or locations.
- Strong performing properties (Top 25%) achieve nightly rates of $209 or more.
- Typical properties (Median) charge around $132 per night.
- Entry-level properties (Bottom 25%) earn around $85 per night.
Average Daily Rate (ADR) Trend by Month in Saint Paul
Get Live Saint Paul Market Intelligence 👇

Explore Real-time Analytics
Airbnb Seasonality Analysis & Trends in Saint Paul (2026)
Peak Season (August, July, June)
- Revenue averages $3,790 per month
- Occupancy rates average 60.4%
- Daily rates average $174
Shoulder Season
- Revenue averages $2,943 per month
- Occupancy maintains around 49.9%
- Daily rates hold near $174
Low Season (January, February, March)
- Revenue drops to average $2,139 per month
- Occupancy decreases to average 42.0%
- Daily rates adjust to average $156
Seasonality Insights for Saint Paul
- The Airbnb seasonality in Saint Paul shows highly seasonal trends requiring careful strategy. While the sections above show seasonal averages, it's also insightful to look at the extremes:
- During the high season, the absolute peak month showcases Saint Paul's highest earning potential, with monthly revenues capable of climbing to $3,917, occupancy reaching a high of 64.0%, and ADRs peaking at $179.
- Conversely, the slowest single month of the year, typically falling within the low season, marks the market's lowest point. In this month, revenue might dip to $1,837, occupancy could drop to 35.5%, and ADRs may adjust down to $141.
- Understanding both the seasonal averages and these monthly peaks and troughs in revenue, occupancy, and ADR is crucial for maximizing your Airbnb profit potential in Saint Paul.
Seasonal Strategies for Maximizing Profit
- Peak Season: Maximize revenue through premium pricing and potentially longer minimum stays. Ensure high availability.
- Low Season: Offer competitive pricing, special promotions (e.g., extended stay discounts), and flexible cancellation policies. Target off-season travelers like remote workers or budget-conscious guests.
- Shoulder Seasons: Implement dynamic pricing that balances peak and low rates. Target weekend travelers or specific events. Offer slightly more flexible terms than peak season.
- Regularly analyze your own performance against these Saint Paul seasonality benchmarks and adjust your pricing and availability strategy accordingly.
Best Areas for Airbnb Investment in Saint Paul (2026)
Exploring the top neighborhoods for short-term rentals in Saint Paul? This section highlights key areas, outlining why they are attractive for hosts and guests, along with notable local attractions. Consider these locations based on your target guest profile and investment strategy.
| Neighborhood / Area | Why Host Here? (Target Guests & Appeal) | Key Attractions & Landmarks |
|---|---|---|
| Downtown Saint Paul | The heart of the city, with a blend of business, culture, and entertainment. It features many restaurants, bars, and venues, making it a prime location for visitors. | Xcel Energy Center, Science Museum of Minnesota, Ordway Center for the Performing Arts, Rice Park, Union Depot |
| Summit Hill | A historic neighborhood known for its beautiful architecture and proximity to Fort Snelling State Park. Popular among families and tourists seeking a quieter stay close to nature. | Summit Avenue, Historic mansions, Fort Snelling State Park, Cafes and shops along Grand Avenue, Minnesota Historical Society |
| Highland Park | A residential area that offers a suburban feel with access to parks and the Mississippi River. Ideal for families and visitors who enjoy outdoor activities. | Highland Park, Crosby Farm Regional Park, Watergate Marina, Highland Village shopping, The Mississippi River |
| Grand Avenue | Known for its shopping, dining, and vibrant local culture. Attracts both locals and tourists looking for a more laid-back urban experience. | Shopping boutiques, Local restaurants, The Grand Avenue Festival, Cafes and bakeries, Summit Hill Historic District |
| Lowertown | An artsy neighborhood with a burgeoning creative scene, featuring galleries, restaurants, and the historic train depot. Great for young visitors and arts enthusiasts. | Lowertown Common, Cooks of Crocus Hill, Saint Paul Farmers' Market, Artists' studios, Historic Lowertown |
| Midway | Situated between Saint Paul and Minneapolis, this area offers easy access to both cities. Attractive to business travelers and visitors attending events at the nearby convention centers. | Hamline University, Midway Center, Bus and light rail lines, Parks and recreational areas, Local eateries |
| West 7th | Rich with cultures and cuisines, this area is popular for its diverse community and close proximity to the river. Ideal for foodies and those looking for a unique dining experience. | Fort Snelling State Park, International market, Local breweries, Parks along the river, Historic sites |
| Como Park | Known for its beautiful park and zoo, this area attracts families, nature lovers, and those looking for a peaceful stay in a natural setting. | Como Park Zoo and Conservatory, Como Lake, Pavilion and amusement park, Walking trails, Cross-country skiing in winter |
Understanding Airbnb License Requirements & STR Laws in Saint Paul (2026)
With 26% of listings showing registration in 2026, understanding potential Airbnb license requirements is crucial in Saint Paul. Always verify the latest short term rental regulations and Airbnb license requirements directly with local government authorities for Saint Paul to ensure full compliance before hosting.
(Source: AirROI data, 2026, based on 26% licensed listings)
Top Performing Airbnb Properties in Saint Paul (2026)
Benchmark your potential! Explore examples of top-performing Airbnb properties in Saint Paulbased on Trailing Twelve Month (TTM) revenue. Analyze their characteristics, revenue, occupancy rate, and ADR to understand what drives success in this market.
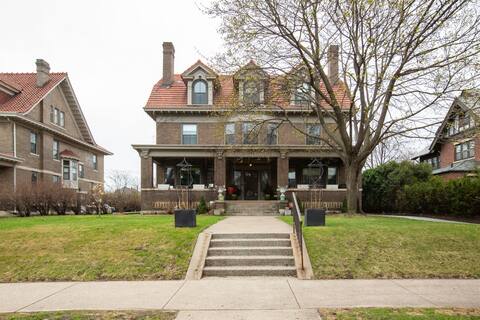
9 Bedrm Summit Mansion w/swimming pool & hot tub
Entire Place • 9 bedrooms
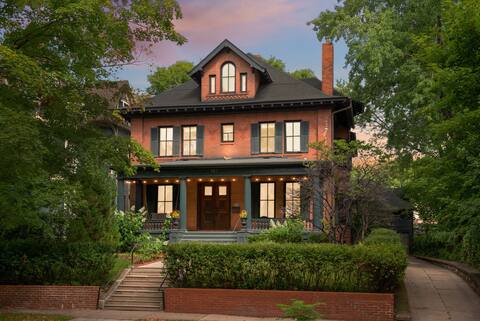
Historic District Holiday Family HQ
Entire Place • 4 bedrooms

5 Min To Stadium, Hot Tub, Mini Golf, Arcade, King
Entire Place • 5 bedrooms
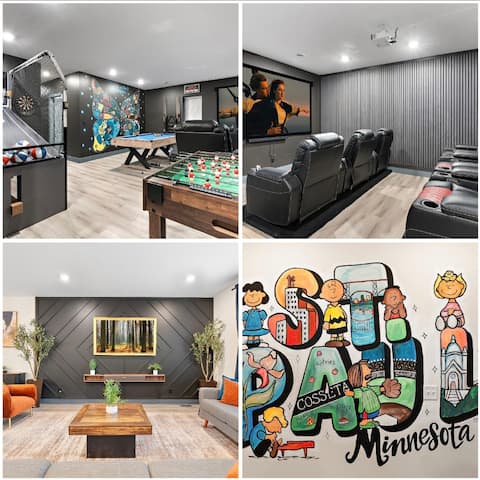
Sleeps14 GameRoom Sauna Hottub Murals HomeTheatre
Entire Place • 5 bedrooms

St. Paul's Best View: The Prospect House
Entire Place • 5 bedrooms
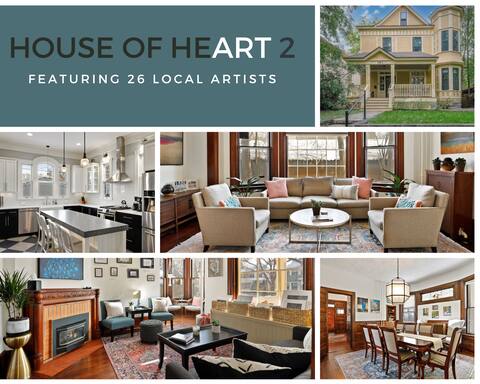
Summit Hill Art House for Groups
Entire Place • 6 bedrooms
Note: Performance varies based on location, size, amenities, seasonality, and management quality. Data reflects the past 12 months.
Top Performing Airbnb Hosts in Saint Paul (2026)
Learn from the best! This table showcases top-performing Airbnb hosts in Saint Paul based on the number of properties managed and estimated total revenue over the past year. Analyze their scale and performance metrics.
| Host Name | Properties | Grossing Revenue | Stay Reviews | Avg Rating |
|---|---|---|---|---|
| Brittany | 13 | $415,710 | 220 | 4.88/5.0 |
| Rachael | 4 | $286,453 | 529 | 4.89/5.0 |
| Brenda | 2 | $257,507 | 149 | 4.96/5.0 |
| Tanya | 3 | $247,143 | 425 | 4.93/5.0 |
| Kevin | 5 | $223,470 | 411 | 4.99/5.0 |
| Lucy | 5 | $214,689 | 320 | 4.98/5.0 |
| Jessica | 45 | $212,724 | 913 | 4.67/5.0 |
| Rachael | 3 | $202,351 | 204 | 4.84/5.0 |
| Michael | 2 | $190,638 | 206 | 4.97/5.0 |
| Jean-Claude | 4 | $190,055 | 1526 | 4.97/5.0 |
Analyzing the strategies of top hosts, such as their property selection, pricing, and guest communication, can offer valuable lessons for optimizing your own Airbnb operations in Saint Paul.
Dive Deeper: Advanced Saint Paul STR Market Data (2026)
Ready to unlock more insights? AirROI provides access to advanced metrics and comprehensive Airbnb data for Saint Paul. Explore detailed analytics beyond this report to refine your investment strategy, optimize pricing, and maximize your vacation rental profits.
Explore Advanced MetricsSaint Paul Short-Term Rental Market Composition (2026): Property & Room Types
Room Type Distribution
Property Type Distribution
Market Composition Insights for Saint Paul
- The Saint Paul Airbnb market composition is heavily skewed towards Entire Home/Apt listings, which make up 75% of the 621 active rentals. This indicates strong guest preference for privacy and space.
- Looking at the property type distribution in Saint Paul, House properties are the most common (60.7%), reflecting the local real estate landscape.
- Houses represent a significant 60.7% portion, catering likely to families or larger groups.
- The presence of 5.3% Hotel/Boutique listings indicates integration with traditional hospitality.
- Smaller segments like others, unique stays (combined 4.6%) offer potential for unique stay experiences.
Saint Paul Airbnb Room Capacity Analysis (2026): Bedroom Distribution
Distribution of Listings by Number of Bedrooms
Room Capacity Insights for Saint Paul
- The dominant room capacity in Saint Paul is 1 bedroom listings, making up 23.2% of the market. This suggests a strong demand for properties suitable for couples or solo travelers.
- Together, 1 bedroom and 2 bedrooms properties represent 46.2% of the active Airbnb listings in Saint Paul, indicating a high concentration in these sizes.
- A significant 30.4% of listings offer 3+ bedrooms, catering to larger groups and families seeking more space in Saint Paul.
Saint Paul Vacation Rental Guest Capacity Trends (2026)
Distribution of Listings by Guest Capacity
Guest Capacity Insights for Saint Paul
- The most common guest capacity trend in Saint Paul vacation rentals is listings accommodating 4 guests (17.7%). This suggests the primary traveler segment is likely small families or groups.
- Properties designed for 4 guests and 8+ guests dominate the Saint Paul STR market, accounting for 35.4% of listings.
- 32.1% of properties accommodate 6+ guests, serving the market segment for larger families or group travel in Saint Paul.
- On average, properties in Saint Paul are equipped to host 3.8 guests.
Saint Paul Airbnb Booking Patterns (2026): Available vs. Booked Days
Available Days Distribution
Booked Days Distribution
Booking Pattern Insights for Saint Paul
- The most common availability pattern in Saint Paul falls within the 181-270 days range, representing 34.5% of listings. This suggests many properties have significant open periods on their calendars.
- Approximately 64.3% of listings show high availability (181+ days open annually), indicating potential for increased bookings or specific owner usage patterns.
- For booked days, the 91-180 days range is most frequent in Saint Paul (34.8%), reflecting common guest stay durations or potential owner blocking patterns.
- A notable 36.9% of properties secure long booking periods (181+ days booked per year), highlighting successful long-term rental strategies or significant owner usage.
Saint Paul Airbnb Minimum Stay Requirements Analysis
Distribution of Listings by Minimum Night Requirement
1 Night
140 listings
22.5% of total
2 Nights
148 listings
23.8% of total
3 Nights
35 listings
5.6% of total
4-6 Nights
56 listings
9% of total
7-29 Nights
49 listings
7.9% of total
30+ Nights
193 listings
31.1% of total
Key Insights
- The most prevalent minimum stay requirement in Saint Paul is 30+ Nights, adopted by 31.1% of listings. This highlights the market's preference for longer commitments.
- A significant segment (31.1%) caters to monthly stays (30+ nights) in Saint Paul, pointing to opportunities in the extended-stay market.
Recommendations
- Align with the market by considering a 30+ Nights minimum stay, as 31.1% of Saint Paul hosts use this setting.
- If feasible, allowing 1-night stays, especially midweek or during low season, could capture last-minute bookings, as only 22.5% currently do.
- Explore offering discounts for stays of 30+ nights to attract the 31.1% of the market seeking extended stays.
- Adjust minimum nights based on seasonality – potentially shorter during low season and longer during peak demand periods in Saint Paul.
Saint Paul Airbnb Cancellation Policy Trends Analysis (2026)
Limited
10 listings
1.6% of total
Super Strict 30 Days
1 listings
0.2% of total
Super Strict 60 Days
1 listings
0.2% of total
Flexible
141 listings
22.7% of total
Moderate
168 listings
27.1% of total
Firm
184 listings
29.6% of total
Strict
116 listings
18.7% of total
Cancellation Policy Insights for Saint Paul
- The prevailing Airbnb cancellation policy trend in Saint Paul is Firm, used by 29.6% of listings.
- There's a relatively balanced mix between guest-friendly (49.8%) and stricter (48.3%) policies, offering choices for different guest needs.
Recommendations for Hosts
- Consider adopting a Firm policy to align with the 29.6% market standard in Saint Paul.
- Regularly review your cancellation policy against competitors and market demand shifts in Saint Paul.
Saint Paul STR Booking Lead Time Analysis (2026)
Average Booking Lead Time by Month
Booking Lead Time Insights for Saint Paul
- The overall average booking lead time for vacation rentals in Saint Paul is 38 days.
- Guests book furthest in advance for stays during July (average 60 days), likely coinciding with peak travel demand or local events.
- The shortest booking windows occur for stays in February (average 24 days), indicating more last-minute travel plans during this time.
- Seasonally, Summer (53 days avg.) sees the longest lead times, while Winter (32 days avg.) has the shortest, reflecting typical travel planning cycles.
Recommendations for Hosts
- Use the overall average lead time (38 days) as a baseline for your pricing and availability strategy in Saint Paul.
- For July stays, consider implementing length-of-stay discounts or slightly higher rates for bookings made less than 60 days out to capitalize on advance planning.
- Target marketing efforts for the Summer season well in advance (at least 53 days) to capture early planners.
- Monitor your own booking lead times against these Saint Paul averages to identify opportunities for dynamic pricing adjustments.
Popular & Essential Airbnb Amenities in Saint Paul (2026)
Amenity Prevalence
Amenity Insights for Saint Paul
- Essential amenities in Saint Paul that guests expect include: Wifi, Smoke alarm, Heating, Hot water, Air conditioning, Carbon monoxide alarm. Lacking these (any) could significantly impact bookings.
- Popular amenities like TV, Kitchen, Dishes and silverware are common but not universal. Offering these can provide a competitive edge.
Recommendations for Hosts
- Ensure your listing includes all essential amenities for Saint Paul: Wifi, Smoke alarm, Heating, Hot water, Air conditioning, Carbon monoxide alarm.
- Prioritize adding missing essentials: Wifi, Smoke alarm, Heating, Hot water, Air conditioning, Carbon monoxide alarm.
- Consider adding popular differentiators like TV or Kitchen to increase appeal.
- Highlight unique or less common amenities you offer (e.g., hot tub, dedicated workspace, EV charger) in your listing description and photos.
- Regularly check competitor amenities in Saint Paul to stay competitive.
Saint Paul Airbnb Guest Demographics & Profile Analysis (2026)
Guest Profile Summary for Saint Paul
- The typical guest profile for Airbnb in Saint Paul consists of primarily domestic travelers (95%), often arriving from nearby Minneapolis, typically belonging to the Post-2000s (Gen Z/Alpha) group (50%), primarily speaking English or Spanish.
- Domestic travelers account for 94.8% of guests.
- Key international markets include United States (94.8%) and Canada (1.5%).
- Top languages spoken are English (71.4%) followed by Spanish (12.2%).
- A significant demographic segment is the Post-2000s (Gen Z/Alpha) group, representing 50% of guests.
Recommendations for Hosts
- Target domestic marketing efforts towards travelers from Minneapolis and Saint Paul.
- Tailor amenities and listing descriptions to appeal to the dominant Post-2000s (Gen Z/Alpha) demographic (e.g., highlight fast WiFi, smart home features, local guides).
- Highlight unique local experiences or amenities relevant to the primary guest profile.
- Consider seasonal promotions aligned with peak travel times for key origin markets.
Nearby Short-Term Rental Market Comparison
How does the Saint Paul Airbnb market stack up against its neighbors? Compare key performance metrics like average monthly revenue, ADR, and occupancy rates in surrounding areas to understand the broader regional STR landscape.
| Market | Active Properties | Monthly Revenue | Daily Rate | Avg. Occupancy |
|---|---|---|---|---|
| Hastings | 14 | $6,579 | $481.32 | 46% |
| Shoreview | 12 | $5,525 | $470.30 | 56% |
| Forest Lake | 25 | $4,839 | $398.24 | 47% |
| Wayzata | 20 | $4,819 | $432.69 | 50% |
| Mound | 15 | $4,463 | $459.67 | 48% |
| Fridley | 26 | $4,404 | $294.56 | 54% |
| Scandia | 13 | $4,256 | $429.44 | 41% |
| Town of Georgetown | 18 | $4,200 | $607.30 | 34% |
| Stillwater | 55 | $4,146 | $369.15 | 41% |
| Excelsior | 27 | $4,076 | $399.51 | 42% |