Marcell Airbnb Market Analysis 2026: Short Term Rental Data & Vacation Rental Statistics in Minnesota, United States
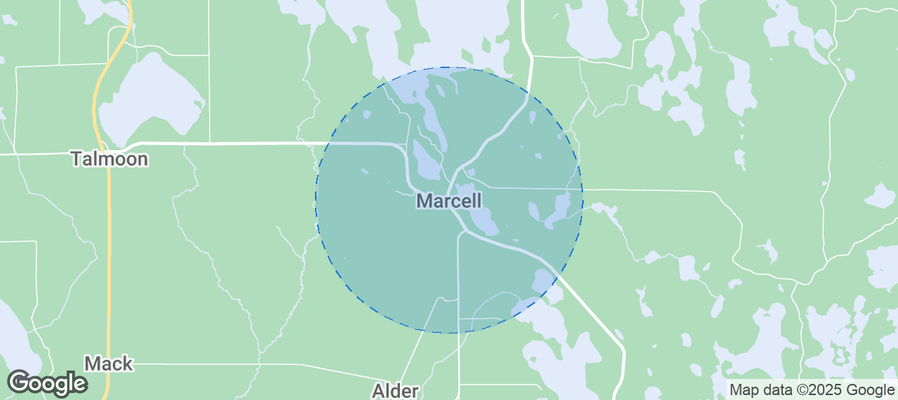
Is Airbnb profitable in Marcell in 2026? Explore comprehensive Airbnb analytics for Marcell, Minnesota, United States to uncover income potential. This 2026 STR market report for Marcell, based on AirROI data from February 2025 to January 2026, reveals key trends in the niche market of 23 active listings.
Whether you're considering an Airbnb investment in Marcell, optimizing your existing vacation rental, or exploring rental arbitrage opportunities, understanding the Marcell Airbnb data is crucial. Leveraging the low regulation environment is key to maximizing your short term rental income potential. Let's dive into the specifics.
Key Marcell Airbnb Performance Metrics Overview
Monthly Airbnb Revenue Variations & Income Potential in Marcell (2026)
Understanding the monthly revenue variations for Airbnb listings in Marcell is key to maximizing your short term rental income potential. Seasonality significantly impacts earnings. Our analysis, based on data from the past 12 months, shows that the peak revenue month for STRs in Marcell is typically July, while March often presents the lowest earnings, highlighting opportunities for strategic pricing adjustments during shoulder and low seasons. Explore the typical Airbnb income in Marcell across different performance tiers:
- Best-in-class properties (Top 10%) achieve $5,923+ monthly, often utilizing dynamic pricing and superior guest experiences.
- Strong performing properties (Top 25%) earn $4,777 or more, indicating effective management and desirable locations/amenities.
- Typical properties (Median) generate around $2,725 per month, representing the average market performance.
- Entry-level properties (Bottom 25%) see earnings around $1,495, often with potential for optimization.
Average Monthly Airbnb Earnings Trend in Marcell
Marcell Airbnb Occupancy Rate Trends (2026)
Maximize your bookings by understanding the Marcell STR occupancy trends. Seasonal demand shifts significantly influence how often properties are booked. Typically, Augustsees the highest demand (peak season occupancy), while March experiences the lowest (low season). Effective strategies, like adjusting minimum stays or offering promotions, can boost occupancy during slower periods. Here's how different property tiers perform in Marcell:
- Best-in-class properties (Top 10%) achieve 66%+ occupancy, indicating high desirability and potentially optimized availability.
- Strong performing properties (Top 25%) maintain 49% or higher occupancy, suggesting good market fit and guest satisfaction.
- Typical properties (Median) have an occupancy rate around 30%.
- Entry-level properties (Bottom 25%) average 19% occupancy, potentially facing higher vacancy.
Average Monthly Occupancy Rate Trend in Marcell
Average Daily Rate (ADR) Airbnb Trends in Marcell (2026)
Effective short term rental pricing strategy in Marcell involves understanding monthly ADR fluctuations. The Average Daily Rate (ADR) for Airbnb in Marcell typically peaks in June and dips lowest during February. Leveraging Airbnb dynamic pricing tools or strategies based on this seasonality can significantly boost revenue. Here's a look at the typical nightly rates achieved:
- Best-in-class properties (Top 10%) command rates of $490+ per night, often due to premium features or locations.
- Strong performing properties (Top 25%) achieve nightly rates of $350 or more.
- Typical properties (Median) charge around $242 per night.
- Entry-level properties (Bottom 25%) earn around $198 per night.
Average Daily Rate (ADR) Trend by Month in Marcell
Get Live Marcell Market Intelligence 👇
Explore Real-time Analytics
Airbnb Seasonality Analysis & Trends in Marcell (2026)
Peak Season (July, August, June)
- Revenue averages $5,711 per month
- Occupancy rates average 56.2%
- Daily rates average $309
Shoulder Season
- Revenue averages $2,809 per month
- Occupancy maintains around 32.1%
- Daily rates hold near $290
Low Season (February, March, December)
- Revenue drops to average $1,463 per month
- Occupancy decreases to average 20.0%
- Daily rates adjust to average $275
Seasonality Insights for Marcell
- The Airbnb seasonality in Marcell shows highly seasonal trends requiring careful strategy. While the sections above show seasonal averages, it's also insightful to look at the extremes:
- During the high season, the absolute peak month showcases Marcell's highest earning potential, with monthly revenues capable of climbing to $6,271, occupancy reaching a high of 60.4%, and ADRs peaking at $319.
- Conversely, the slowest single month of the year, typically falling within the low season, marks the market's lowest point. In this month, revenue might dip to $874, occupancy could drop to 12.9%, and ADRs may adjust down to $264.
- Understanding both the seasonal averages and these monthly peaks and troughs in revenue, occupancy, and ADR is crucial for maximizing your Airbnb profit potential in Marcell.
Seasonal Strategies for Maximizing Profit
- Peak Season: Maximize revenue through premium pricing and potentially longer minimum stays. Ensure high availability.
- Low Season: Offer competitive pricing, special promotions (e.g., extended stay discounts), and flexible cancellation policies. Target off-season travelers like remote workers or budget-conscious guests.
- Shoulder Seasons: Implement dynamic pricing that balances peak and low rates. Target weekend travelers or specific events. Offer slightly more flexible terms than peak season.
- Regularly analyze your own performance against these Marcell seasonality benchmarks and adjust your pricing and availability strategy accordingly.
Best Areas for Airbnb Investment in Marcell (2026)
Exploring the top neighborhoods for short-term rentals in Marcell? This section highlights key areas, outlining why they are attractive for hosts and guests, along with notable local attractions. Consider these locations based on your target guest profile and investment strategy.
| Neighborhood / Area | Why Host Here? (Target Guests & Appeal) | Key Attractions & Landmarks |
|---|---|---|
| Sand Lake | A popular destination for outdoor enthusiasts, offering beautiful lake views and access to numerous recreational activities such as fishing, boating, and hiking. Perfect for families and nature lovers looking for a serene getaway. | Sand Lake, Chippewa National Forest, Hiking trails, Fishing spots, Boating access |
| Itasca State Park | Home to the headwaters of the Mississippi River, Itasca State Park is a stunning natural area that attracts tourists year-round for hiking, biking, and camping. An excellent location for those seeking an immersive nature experience. | Itasca State Park, Mississippi River Headwaters, Hiking trails, Wildlife watching, Lakes and beaches |
| Leech Lake | One of the largest lakes in Minnesota, Leech Lake is known for its excellent fishing, beautiful scenery, and recreational opportunities. A hotspot for sportsmen and outdoor activities. | Leech Lake, Fishing and boating, Public access points, Campgrounds, Nature trails |
| Boy River | A small and charming area known for its proximity to lakes and wilderness areas, ideal for those looking for a peaceful retreat surrounded by natural beauty. | Boy River, Access to lakes, Wildlife areas, Hiking trails, Fishing spots |
| Pine River | A quaint town with rich history and access to the Crow Wing River, popular for its outdoor activities and a gateway to the Paul Bunyan State Forest. | Crow Wing River, Paul Bunyan State Forest, Historical sites, Wildlife areas, Pine River Trail |
| Crosby | Earning a reputation for its outdoor recreation, Crosby is known for mountain biking, fishing, and a friendly small-town atmosphere, making it perfect for families and adventurers. | Crosby Mine Lake, Cuyuna Country State Recreation Area, Mountain biking trails, Fishing spots, Crosby Memorial Park |
| Nisswa | A charming and vibrant community located in the Brainerd Lakes Area, Nisswa features several lakes, a beautiful downtown, and numerous shops and restaurants, attracting tourists year-round. | Nisswa Lake, Downtown Nisswa, Shopping and dining, Brainerd Lakes Area, Cultural events |
| Brainerd | Known for its lakes, parks, and recreational facilities, Brainerd is a prime location for visitors seeking a mix of outdoor activities and urban amenities, making it a popular family vacation spot. | Brainerd International Raceway, Crow Wing State Park, Nisswa Lake, Shopping and dining, Cultural attractions |
Understanding Airbnb License Requirements & STR Laws in Marcell (2026)
While Marcell, Minnesota, United States currently shows low STR regulations, specific Airbnb license requirements might still exist or change. Always verify the latest short term rental regulations and Airbnb license requirements directly with local government authorities for Marcell to ensure full compliance before hosting.
(Source: AirROI data, 2026, finding no licensed listings among those analyzed)
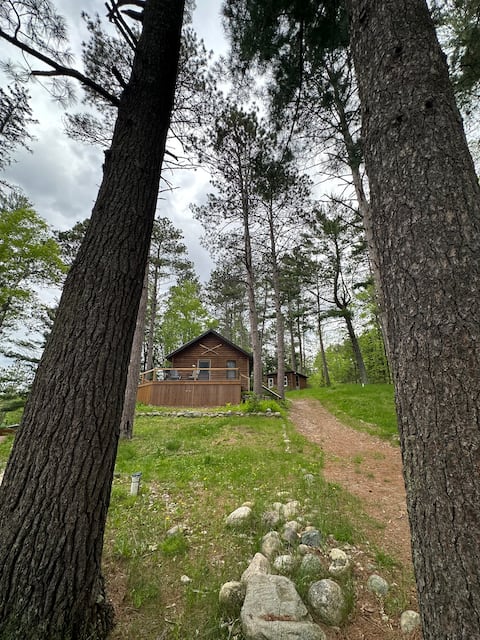
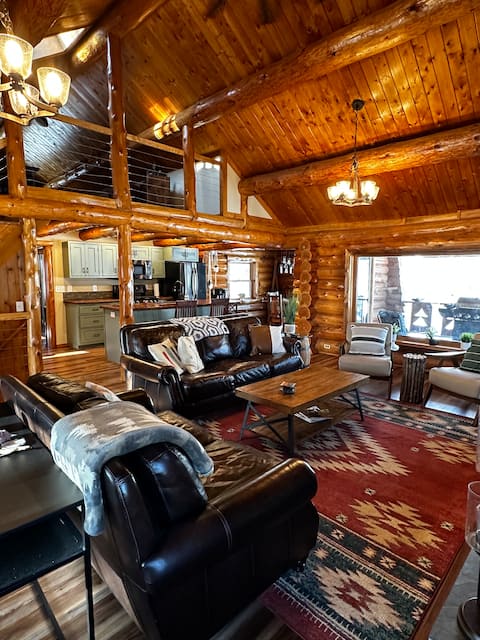
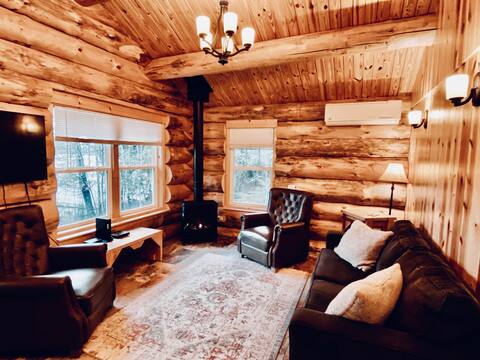
Top Performing Airbnb Properties in Marcell (2026)
Benchmark your potential! Explore examples of top-performing Airbnb properties in Marcellbased on Trailing Twelve Month (TTM) revenue. Analyze their characteristics, revenue, occupancy rate, and ADR to understand what drives success in this market.

LAKE LUXE! PoolTable-Wifi-Jacuzzi-Trails Closeby!
Entire Place • 5 bedrooms
Perfect for big groups(3 cabins, 2 lakes, 1 sauna)
Entire Place • 5 bedrooms
Log Cabin on Caribou Lake/Chippewa National Forest
Entire Place • 3 bedrooms
NEW LAKE CABIN! Jacuzzi~Wifi~Quiet~Trails Closeby!
Entire Place • 2 bedrooms

Cozy Stone Cottage overlooking Smith Lake
Entire Place • 2 bedrooms
Clubhouse Lake Home*GameRm*Sauna*PingPong/Pool Tbl
Entire Place • 5 bedrooms
Note: Performance varies based on location, size, amenities, seasonality, and management quality. Data reflects the past 12 months.
Top Performing Airbnb Hosts in Marcell (2026)
Learn from the best! This table showcases top-performing Airbnb hosts in Marcell based on the number of properties managed and estimated total revenue over the past year. Analyze their scale and performance metrics.
| Host Name | Properties | Grossing Revenue | Stay Reviews | Avg Rating |
|---|---|---|---|---|
| Kristen | 9 | $148,914 | 123 | 4.94/5.0 |
| Margaret Aka Peg | 5 | $122,090 | 336 | 4.91/5.0 |
| Sandra | 2 | $68,016 | 97 | 4.87/5.0 |
| Robert | 2 | $66,021 | 23 | 4.94/5.0 |
| Katherine | 1 | $50,805 | 45 | 5.00/5.0 |
| Ryan | 1 | $48,893 | 77 | 4.99/5.0 |
| Richard | 1 | $33,755 | 29 | 4.90/5.0 |
| Ann Marie | 1 | $32,994 | 14 | 5.00/5.0 |
| Maria | 1 | $12,890 | 10 | 4.80/5.0 |
Analyzing the strategies of top hosts, such as their property selection, pricing, and guest communication, can offer valuable lessons for optimizing your own Airbnb operations in Marcell.
Dive Deeper: Advanced Marcell STR Market Data (2026)
Ready to unlock more insights? AirROI provides access to advanced metrics and comprehensive Airbnb data for Marcell. Explore detailed analytics beyond this report to refine your investment strategy, optimize pricing, and maximize your vacation rental profits.
Explore Advanced MetricsMarcell Short-Term Rental Market Composition (2026): Property & Room Types
Room Type Distribution
Property Type Distribution
Market Composition Insights for Marcell
- The Marcell Airbnb market composition is heavily skewed towards Entire Home/Apt listings, which make up 100% of the 23 active rentals. This indicates strong guest preference for privacy and space.
- Looking at the property type distribution in Marcell, Outdoor/Unique properties are the most common (78.3%), reflecting the local real estate landscape.
- Houses represent a significant 17.4% portion, catering likely to families or larger groups.
- Smaller segments like others (combined 4.3%) offer potential for unique stay experiences.
Marcell Airbnb Room Capacity Analysis (2026): Bedroom Distribution
Distribution of Listings by Number of Bedrooms
Room Capacity Insights for Marcell
- The dominant room capacity in Marcell is 2 bedrooms listings, making up 39.1% of the market. This suggests a strong demand for properties suitable for couples or solo travelers.
- Together, 2 bedrooms and 5+ bedrooms properties represent 60.8% of the active Airbnb listings in Marcell, indicating a high concentration in these sizes.
- A significant 47.8% of listings offer 3+ bedrooms, catering to larger groups and families seeking more space in Marcell.
Marcell Vacation Rental Guest Capacity Trends (2026)
Distribution of Listings by Guest Capacity
Guest Capacity Insights for Marcell
- The most common guest capacity trend in Marcell vacation rentals is listings accommodating 8+ guests (39.1%). This suggests the primary traveler segment is likely larger groups.
- Properties designed for 8+ guests and 6 guests dominate the Marcell STR market, accounting for 60.8% of listings.
- 60.8% of properties accommodate 6+ guests, serving the market segment for larger families or group travel in Marcell.
- On average, properties in Marcell are equipped to host 6.0 guests.
Marcell Airbnb Booking Patterns (2026): Available vs. Booked Days
Available Days Distribution
Booked Days Distribution
Booking Pattern Insights for Marcell
- The most common availability pattern in Marcell falls within the 271-366 days range, representing 60.9% of listings. This suggests many properties have significant open periods on their calendars.
- Approximately 95.7% of listings show high availability (181+ days open annually), indicating potential for increased bookings or specific owner usage patterns.
- For booked days, the 91-180 days range is most frequent in Marcell (39.1%), reflecting common guest stay durations or potential owner blocking patterns.
- A notable 4.3% of properties secure long booking periods (181+ days booked per year), highlighting successful long-term rental strategies or significant owner usage.
Marcell Airbnb Minimum Stay Requirements Analysis
Distribution of Listings by Minimum Night Requirement
1 Night
1 listings
4.3% of total
2 Nights
4 listings
17.4% of total
3 Nights
1 listings
4.3% of total
4-6 Nights
2 listings
8.7% of total
30+ Nights
15 listings
65.2% of total
Key Insights
- The most prevalent minimum stay requirement in Marcell is 30+ Nights, adopted by 65.2% of listings. This highlights the market's preference for longer commitments.
- A significant segment (65.2%) caters to monthly stays (30+ nights) in Marcell, pointing to opportunities in the extended-stay market.
Recommendations
- Align with the market by considering a 30+ Nights minimum stay, as 65.2% of Marcell hosts use this setting.
- If feasible, allowing 1-night stays, especially midweek or during low season, could capture last-minute bookings, as only 4.3% currently do.
- Explore offering discounts for stays of 30+ nights to attract the 65.2% of the market seeking extended stays.
- Adjust minimum nights based on seasonality – potentially shorter during low season and longer during peak demand periods in Marcell.
Marcell Airbnb Cancellation Policy Trends Analysis (2026)
Flexible
2 listings
8.7% of total
Moderate
1 listings
4.3% of total
Firm
10 listings
43.5% of total
Strict
10 listings
43.5% of total
Cancellation Policy Insights for Marcell
- The prevailing Airbnb cancellation policy trend in Marcell is Firm, used by 43.5% of listings.
- A majority (87.0%) of hosts in Marcell utilize Firm or Strict policies, indicating a market where hosts prioritize booking security.
Recommendations for Hosts
- Consider adopting a Firm policy to align with the 43.5% market standard in Marcell.
- With 43.5% using Strict terms, this is a viable option in Marcell, particularly for high-value properties or during peak demand periods.
- Regularly review your cancellation policy against competitors and market demand shifts in Marcell.
Marcell STR Booking Lead Time Analysis (2026)
Average Booking Lead Time by Month
Booking Lead Time Insights for Marcell
- The overall average booking lead time for vacation rentals in Marcell is 88 days.
- Guests book furthest in advance for stays during July (average 130 days), likely coinciding with peak travel demand or local events.
- The shortest booking windows occur for stays in March (average 21 days), indicating more last-minute travel plans during this time.
- Seasonally, Summer (118 days avg.) sees the longest lead times, while Winter (46 days avg.) has the shortest, reflecting typical travel planning cycles.
Recommendations for Hosts
- Use the overall average lead time (88 days) as a baseline for your pricing and availability strategy in Marcell.
- For July stays, consider implementing length-of-stay discounts or slightly higher rates for bookings made less than 130 days out to capitalize on advance planning.
- Target marketing efforts for the Summer season well in advance (at least 118 days) to capture early planners.
- Monitor your own booking lead times against these Marcell averages to identify opportunities for dynamic pricing adjustments.
Popular & Essential Airbnb Amenities in Marcell (2026)
Amenity Prevalence
No amenities with partial availability (less than 100%) were found to display in the chart. All essential amenities might be present in all listings. Check insights below.
Amenity Insights for Marcell
- Essential amenities in Marcell that guests expect include: Hot water, Kitchen, Dishes and silverware, Wifi, Fire pit, Stove, Fire extinguisher, Heating, Toaster, Free parking on premises. Lacking these (any) could significantly impact bookings.
Recommendations for Hosts
- Ensure your listing includes all essential amenities for Marcell: Hot water, Kitchen, Dishes and silverware, Wifi, Fire pit, Stove, Fire extinguisher, Heating, Toaster, Free parking on premises.
- Highlight unique or less common amenities you offer (e.g., hot tub, dedicated workspace, EV charger) in your listing description and photos.
- Regularly check competitor amenities in Marcell to stay competitive.
Marcell Airbnb Guest Demographics & Profile Analysis (2026)
Guest Profile Summary for Marcell
- The typical guest profile for Airbnb in Marcell consists of primarily domestic travelers (96%), often arriving from nearby Minneapolis, typically belonging to the Post-2000s (Gen Z/Alpha) group (50%), primarily speaking English or Spanish.
- Domestic travelers account for 95.6% of guests.
- Key international markets include United States (95.6%) and South Korea (1.5%).
- Top languages spoken are English (67.7%) followed by Spanish (16.1%).
- A significant demographic segment is the Post-2000s (Gen Z/Alpha) group, representing 50% of guests.
Recommendations for Hosts
- Target domestic marketing efforts towards travelers from Minneapolis and Saint Paul.
- Tailor amenities and listing descriptions to appeal to the dominant Post-2000s (Gen Z/Alpha) demographic (e.g., highlight fast WiFi, smart home features, local guides).
- Highlight unique local experiences or amenities relevant to the primary guest profile.
- Consider seasonal promotions aligned with peak travel times for key origin markets.
Nearby Short-Term Rental Market Comparison
How does the Marcell Airbnb market stack up against its neighbors? Compare key performance metrics like average monthly revenue, ADR, and occupancy rates in surrounding areas to understand the broader regional STR landscape.
| Market | Active Properties | Monthly Revenue | Daily Rate | Avg. Occupancy |
|---|---|---|---|---|
| Grand Lake Township | 11 | $4,834 | $345.41 | 46% |
| Hillman | 10 | $4,599 | $424.33 | 40% |
| Nisswa | 86 | $4,162 | $449.59 | 36% |
| Crosslake | 88 | $4,094 | $467.60 | 40% |
| East Side Township | 13 | $4,009 | $440.04 | 36% |
| Lake Shore | 23 | $3,998 | $495.81 | 37% |
| Pequot Lakes | 65 | $3,948 | $440.68 | 41% |
| Hermantown | 21 | $3,608 | $346.40 | 49% |
| Baxter | 13 | $3,607 | $417.09 | 41% |
| Deerwood | 31 | $3,538 | $415.59 | 39% |