Grand Rapids Airbnb Market Analysis 2026: Short Term Rental Data & Vacation Rental Statistics in Minnesota, United States
Is Airbnb profitable in Grand Rapids in 2026? Explore comprehensive Airbnb analytics for Grand Rapids, Minnesota, United States to uncover income potential. This 2026 STR market report for Grand Rapids, based on AirROI data from February 2025 to January 2026, reveals key trends in the niche market of 50 active listings.
Whether you're considering an Airbnb investment in Grand Rapids, optimizing your existing vacation rental, or exploring rental arbitrage opportunities, understanding the Grand Rapids Airbnb data is crucial. Leveraging the low regulation environment is key to maximizing your short term rental income potential. Let's dive into the specifics.
Key Grand Rapids Airbnb Performance Metrics Overview
Monthly Airbnb Revenue Variations & Income Potential in Grand Rapids (2026)
Understanding the monthly revenue variations for Airbnb listings in Grand Rapids is key to maximizing your short term rental income potential. Seasonality significantly impacts earnings. Our analysis, based on data from the past 12 months, shows that the peak revenue month for STRs in Grand Rapids is typically July, while February often presents the lowest earnings, highlighting opportunities for strategic pricing adjustments during shoulder and low seasons. Explore the typical Airbnb income in Grand Rapids across different performance tiers:
- Best-in-class properties (Top 10%) achieve $7,388+ monthly, often utilizing dynamic pricing and superior guest experiences.
- Strong performing properties (Top 25%) earn $4,413 or more, indicating effective management and desirable locations/amenities.
- Typical properties (Median) generate around $2,465 per month, representing the average market performance.
- Entry-level properties (Bottom 25%) see earnings around $1,156, often with potential for optimization.
Average Monthly Airbnb Earnings Trend in Grand Rapids
Grand Rapids Airbnb Occupancy Rate Trends (2026)
Maximize your bookings by understanding the Grand Rapids STR occupancy trends. Seasonal demand shifts significantly influence how often properties are booked. Typically, Julysees the highest demand (peak season occupancy), while January experiences the lowest (low season). Effective strategies, like adjusting minimum stays or offering promotions, can boost occupancy during slower periods. Here's how different property tiers perform in Grand Rapids:
- Best-in-class properties (Top 10%) achieve 74%+ occupancy, indicating high desirability and potentially optimized availability.
- Strong performing properties (Top 25%) maintain 57% or higher occupancy, suggesting good market fit and guest satisfaction.
- Typical properties (Median) have an occupancy rate around 37%.
- Entry-level properties (Bottom 25%) average 18% occupancy, potentially facing higher vacancy.
Average Monthly Occupancy Rate Trend in Grand Rapids
Average Daily Rate (ADR) Airbnb Trends in Grand Rapids (2026)
Effective short term rental pricing strategy in Grand Rapids involves understanding monthly ADR fluctuations. The Average Daily Rate (ADR) for Airbnb in Grand Rapids typically peaks in June and dips lowest during February. Leveraging Airbnb dynamic pricing tools or strategies based on this seasonality can significantly boost revenue. Here's a look at the typical nightly rates achieved:
- Best-in-class properties (Top 10%) command rates of $394+ per night, often due to premium features or locations.
- Strong performing properties (Top 25%) achieve nightly rates of $297 or more.
- Typical properties (Median) charge around $210 per night.
- Entry-level properties (Bottom 25%) earn around $166 per night.
Average Daily Rate (ADR) Trend by Month in Grand Rapids
Get Live Grand Rapids Market Intelligence 👇

Explore Real-time Analytics
Airbnb Seasonality Analysis & Trends in Grand Rapids (2026)
Peak Season (July, August, June)
- Revenue averages $5,468 per month
- Occupancy rates average 52.3%
- Daily rates average $265
Shoulder Season
- Revenue averages $3,009 per month
- Occupancy maintains around 38.1%
- Daily rates hold near $245
Low Season (January, February, November)
- Revenue drops to average $2,127 per month
- Occupancy decreases to average 29.0%
- Daily rates adjust to average $233
Seasonality Insights for Grand Rapids
- The Airbnb seasonality in Grand Rapids shows highly seasonal trends requiring careful strategy. While the sections above show seasonal averages, it's also insightful to look at the extremes:
- During the high season, the absolute peak month showcases Grand Rapids's highest earning potential, with monthly revenues capable of climbing to $6,057, occupancy reaching a high of 55.9%, and ADRs peaking at $274.
- Conversely, the slowest single month of the year, typically falling within the low season, marks the market's lowest point. In this month, revenue might dip to $1,753, occupancy could drop to 23.0%, and ADRs may adjust down to $221.
- Understanding both the seasonal averages and these monthly peaks and troughs in revenue, occupancy, and ADR is crucial for maximizing your Airbnb profit potential in Grand Rapids.
Seasonal Strategies for Maximizing Profit
- Peak Season: Maximize revenue through premium pricing and potentially longer minimum stays. Ensure high availability.
- Low Season: Offer competitive pricing, special promotions (e.g., extended stay discounts), and flexible cancellation policies. Target off-season travelers like remote workers or budget-conscious guests.
- Shoulder Seasons: Implement dynamic pricing that balances peak and low rates. Target weekend travelers or specific events. Offer slightly more flexible terms than peak season.
- Regularly analyze your own performance against these Grand Rapids seasonality benchmarks and adjust your pricing and availability strategy accordingly.
Best Areas for Airbnb Investment in Grand Rapids (2026)
Exploring the top neighborhoods for short-term rentals in Grand Rapids? This section highlights key areas, outlining why they are attractive for hosts and guests, along with notable local attractions. Consider these locations based on your target guest profile and investment strategy.
| Neighborhood / Area | Why Host Here? (Target Guests & Appeal) | Key Attractions & Landmarks |
|---|---|---|
| Downtown Grand Rapids | Vibrant urban center with a mix of art, culture, and dining. Attracts both tourists and business travelers with its events and attractions. | Grand Rapids Art Museum, DeVos Place, Van Andel Arena, Grand Rapids Public Museum, Frederik Meijer Gardens & Sculpture Park |
| Heritage Hill | Historic neighborhood known for its beautiful architecture and proximity to downtown. Popular with visitors interested in history and culture. | Heritage Hill Historic District, Blandford Nature Center, Voigt Park, St. Cecilia Music Center |
| Eastown | Trendy neighborhood with a unique blend of shops, restaurants, and nightlife. Appeals to a younger, hip crowd. | Eastown shopping district, The Brick Road, Louis Street, local breweries and coffee shops |
| Michigan Street | Up-and-coming area with a focus on new developments and local businesses. Close to medical mile and universities, attracting students and healthcare visitors. | Spectrum Health, Grand Valley State University, local eateries and shops, public art |
| Grand River | Scenic waterfront area great for nature lovers and outdoor activities, drawing visitors for river activities and parks. | Riverwalk, Canal Park, Rosa Parks Circle, Fishing and kayaking spots |
| Kentwood | Family-friendly suburb that offers a quieter residence with easy access to Grand Rapids attractions. Good for long-term stays. | Parks and recreational areas, Woodland Mall, local dining options |
| Forest Hills | Affluent suburban area known for its schools and family-friendly environment. Attracts families looking for a peaceful stay near the city. | Forest Hills Fine Arts Center, local parks, golf courses |
| Standale | Growing community with a small-town feel but close to larger city amenities. Attractive for visitors wanting a local experience. | Local shops and restaurants, Grand Valley State University - Standale Campus, Proximity to parks |
Understanding Airbnb License Requirements & STR Laws in Grand Rapids (2026)
While Grand Rapids, Minnesota, United States currently shows low STR regulations, specific Airbnb license requirements might still exist or change. Always verify the latest short term rental regulations and Airbnb license requirements directly with local government authorities for Grand Rapids to ensure full compliance before hosting.
(Source: AirROI data, 2026, finding no licensed listings among those analyzed)
Top Performing Airbnb Properties in Grand Rapids (2026)
Benchmark your potential! Explore examples of top-performing Airbnb properties in Grand Rapidsbased on Trailing Twelve Month (TTM) revenue. Analyze their characteristics, revenue, occupancy rate, and ADR to understand what drives success in this market.
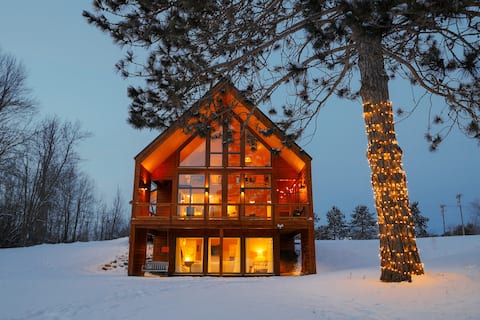
The Nordic Nest Vacation Home with Indoor Sauna
Entire Place • 4 bedrooms
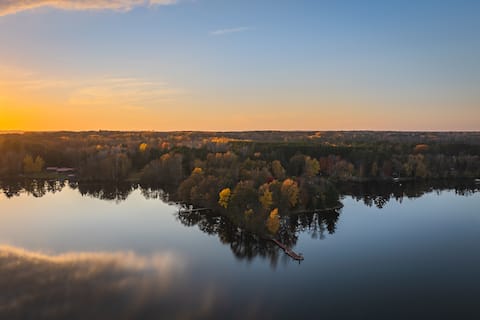
Private Peninsula Group Getaway with Sauna
Entire Place • 6 bedrooms

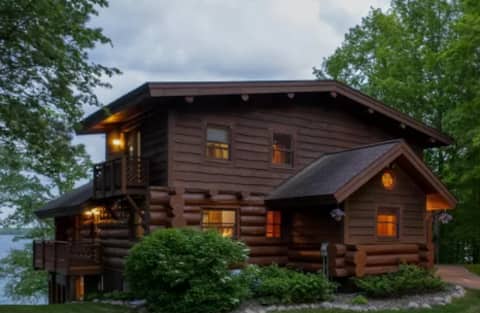
Lake Home on Pokegama w/dock, sauna, game room.
Entire Place • 6 bedrooms

Blue Lagoon Lodge on Deer Lake! Hot Tub & Views
Entire Place • 4 bedrooms
Spacious Log Cabin on Bass Lake
Entire Place • 4 bedrooms

Prairie Lake Estate
Entire Place • 4 bedrooms
Note: Performance varies based on location, size, amenities, seasonality, and management quality. Data reflects the past 12 months.
Top Performing Airbnb Hosts in Grand Rapids (2026)
Learn from the best! This table showcases top-performing Airbnb hosts in Grand Rapids based on the number of properties managed and estimated total revenue over the past year. Analyze their scale and performance metrics.
| Host Name | Properties | Grossing Revenue | Stay Reviews | Avg Rating |
|---|---|---|---|---|
| Emily | 4 | $250,946 | 504 | 4.97/5.0 |
| Michael | 1 | $137,530 | 62 | 4.98/5.0 |
| Leisha | 8 | $108,498 | 262 | 4.52/5.0 |
| Dante | 1 | $100,517 | 18 | 4.94/5.0 |
| Jess | 1 | $96,696 | 51 | 5.00/5.0 |
| Sarah | 3 | $70,343 | 566 | 4.95/5.0 |
| Scott | 1 | $63,664 | 86 | 4.98/5.0 |
| Rebecca | 1 | $57,245 | 4 | 4.75/5.0 |
| Maria | 2 | $46,475 | 22 | 5.00/5.0 |
| Heidi | 1 | $44,335 | 109 | 4.94/5.0 |
Analyzing the strategies of top hosts, such as their property selection, pricing, and guest communication, can offer valuable lessons for optimizing your own Airbnb operations in Grand Rapids.
Dive Deeper: Advanced Grand Rapids STR Market Data (2026)
Ready to unlock more insights? AirROI provides access to advanced metrics and comprehensive Airbnb data for Grand Rapids. Explore detailed analytics beyond this report to refine your investment strategy, optimize pricing, and maximize your vacation rental profits.
Explore Advanced MetricsGrand Rapids Short-Term Rental Market Composition (2026): Property & Room Types
Room Type Distribution
Property Type Distribution
Market Composition Insights for Grand Rapids
- The Grand Rapids Airbnb market composition is heavily skewed towards Entire Home/Apt listings, which make up 88% of the 50 active rentals. This indicates strong guest preference for privacy and space.
- Looking at the property type distribution in Grand Rapids, Outdoor/Unique properties are the most common (50%), reflecting the local real estate landscape.
- Houses represent a significant 24% portion, catering likely to families or larger groups.
- The presence of 10% Hotel/Boutique listings indicates integration with traditional hospitality.
- Smaller segments like unique stays (combined 2.0%) offer potential for unique stay experiences.
Grand Rapids Airbnb Room Capacity Analysis (2026): Bedroom Distribution
Distribution of Listings by Number of Bedrooms
Room Capacity Insights for Grand Rapids
- The dominant room capacity in Grand Rapids is 2 bedrooms listings, making up 34% of the market. This suggests a strong demand for properties suitable for couples or solo travelers.
- Together, 2 bedrooms and 3 bedrooms properties represent 52.0% of the active Airbnb listings in Grand Rapids, indicating a high concentration in these sizes.
- A significant 40.0% of listings offer 3+ bedrooms, catering to larger groups and families seeking more space in Grand Rapids.
Grand Rapids Vacation Rental Guest Capacity Trends (2026)
Distribution of Listings by Guest Capacity
Guest Capacity Insights for Grand Rapids
- The most common guest capacity trend in Grand Rapids vacation rentals is listings accommodating 8+ guests (36%). This suggests the primary traveler segment is likely larger groups.
- Properties designed for 8+ guests and 4 guests dominate the Grand Rapids STR market, accounting for 62.0% of listings.
- 54.0% of properties accommodate 6+ guests, serving the market segment for larger families or group travel in Grand Rapids.
- On average, properties in Grand Rapids are equipped to host 5.6 guests.
Grand Rapids Airbnb Booking Patterns (2026): Available vs. Booked Days
Available Days Distribution
Booked Days Distribution
Booking Pattern Insights for Grand Rapids
- The most common availability pattern in Grand Rapids falls within the 271-366 days range, representing 52% of listings. This suggests many properties have significant open periods on their calendars.
- Approximately 82.0% of listings show high availability (181+ days open annually), indicating potential for increased bookings or specific owner usage patterns.
- For booked days, the 91-180 days range is most frequent in Grand Rapids (32%), reflecting common guest stay durations or potential owner blocking patterns.
- A notable 20.0% of properties secure long booking periods (181+ days booked per year), highlighting successful long-term rental strategies or significant owner usage.
Grand Rapids Airbnb Minimum Stay Requirements Analysis
Distribution of Listings by Minimum Night Requirement
1 Night
18 listings
36% of total
2 Nights
12 listings
24% of total
3 Nights
2 listings
4% of total
4-6 Nights
3 listings
6% of total
7-29 Nights
2 listings
4% of total
30+ Nights
13 listings
26% of total
Key Insights
- The most prevalent minimum stay requirement in Grand Rapids is 1 Night, adopted by 36% of listings. This highlights the market's preference for shorter, flexible bookings.
- A significant segment (26%) caters to monthly stays (30+ nights) in Grand Rapids, pointing to opportunities in the extended-stay market.
Recommendations
- Align with the market by considering a 1 Night minimum stay, as 36% of Grand Rapids hosts use this setting.
- Explore offering discounts for stays of 30+ nights to attract the 26% of the market seeking extended stays.
- Adjust minimum nights based on seasonality – potentially shorter during low season and longer during peak demand periods in Grand Rapids.
Grand Rapids Airbnb Cancellation Policy Trends Analysis (2026)
Super Strict 60 Days
1 listings
2% of total
Flexible
11 listings
22% of total
Moderate
11 listings
22% of total
Firm
22 listings
44% of total
Strict
5 listings
10% of total
Cancellation Policy Insights for Grand Rapids
- The prevailing Airbnb cancellation policy trend in Grand Rapids is Firm, used by 44% of listings.
- A majority (54.0%) of hosts in Grand Rapids utilize Firm or Strict policies, indicating a market where hosts prioritize booking security.
Recommendations for Hosts
- Consider adopting a Firm policy to align with the 44% market standard in Grand Rapids.
- Using a Strict policy might deter some guests, as only 10% of listings use it. Evaluate if potential revenue protection outweighs possible lower booking rates.
- Regularly review your cancellation policy against competitors and market demand shifts in Grand Rapids.
Grand Rapids STR Booking Lead Time Analysis (2026)
Average Booking Lead Time by Month
Booking Lead Time Insights for Grand Rapids
- The overall average booking lead time for vacation rentals in Grand Rapids is 69 days.
- Guests book furthest in advance for stays during July (average 120 days), likely coinciding with peak travel demand or local events.
- The shortest booking windows occur for stays in October (average 25 days), indicating more last-minute travel plans during this time.
- Seasonally, Summer (98 days avg.) sees the longest lead times, while Winter (41 days avg.) has the shortest, reflecting typical travel planning cycles.
Recommendations for Hosts
- Use the overall average lead time (69 days) as a baseline for your pricing and availability strategy in Grand Rapids.
- For July stays, consider implementing length-of-stay discounts or slightly higher rates for bookings made less than 120 days out to capitalize on advance planning.
- Target marketing efforts for the Summer season well in advance (at least 98 days) to capture early planners.
- Monitor your own booking lead times against these Grand Rapids averages to identify opportunities for dynamic pricing adjustments.
Popular & Essential Airbnb Amenities in Grand Rapids (2026)
Amenity Prevalence
Amenity Insights for Grand Rapids
- Essential amenities in Grand Rapids that guests expect include: Free parking on premises, Wifi, Smoke alarm, Heating. Lacking these (any) could significantly impact bookings.
- Popular amenities like TV, Air conditioning, Kitchen are common but not universal. Offering these can provide a competitive edge.
Recommendations for Hosts
- Ensure your listing includes all essential amenities for Grand Rapids: Free parking on premises, Wifi, Smoke alarm, Heating.
- Prioritize adding missing essentials: Smoke alarm, Heating.
- Consider adding popular differentiators like TV or Air conditioning to increase appeal.
- Highlight unique or less common amenities you offer (e.g., hot tub, dedicated workspace, EV charger) in your listing description and photos.
- Regularly check competitor amenities in Grand Rapids to stay competitive.
Grand Rapids Airbnb Guest Demographics & Profile Analysis (2026)
Guest Profile Summary for Grand Rapids
- The typical guest profile for Airbnb in Grand Rapids consists of primarily domestic travelers (97%), often arriving from nearby Minneapolis, typically belonging to the Post-2000s (Gen Z/Alpha) group (50%), primarily speaking English or Spanish.
- Domestic travelers account for 97.2% of guests.
- Key international markets include United States (97.2%) and Italy (0.9%).
- Top languages spoken are English (73.8%) followed by Spanish (12.5%).
- A significant demographic segment is the Post-2000s (Gen Z/Alpha) group, representing 50% of guests.
Recommendations for Hosts
- Target domestic marketing efforts towards travelers from Minneapolis and Saint Paul.
- Tailor amenities and listing descriptions to appeal to the dominant Post-2000s (Gen Z/Alpha) demographic (e.g., highlight fast WiFi, smart home features, local guides).
- Highlight unique local experiences or amenities relevant to the primary guest profile.
- Consider seasonal promotions aligned with peak travel times for key origin markets.
Nearby Short-Term Rental Market Comparison
How does the Grand Rapids Airbnb market stack up against its neighbors? Compare key performance metrics like average monthly revenue, ADR, and occupancy rates in surrounding areas to understand the broader regional STR landscape.
| Market | Active Properties | Monthly Revenue | Daily Rate | Avg. Occupancy |
|---|---|---|---|---|
| Grand Lake Township | 11 | $4,834 | $345.41 | 46% |
| Hillman | 10 | $4,599 | $424.33 | 40% |
| Nisswa | 86 | $4,162 | $449.59 | 36% |
| Crosslake | 88 | $4,094 | $467.60 | 40% |
| East Side Township | 13 | $4,009 | $440.04 | 36% |
| Lake Shore | 23 | $3,998 | $495.81 | 37% |
| Pequot Lakes | 65 | $3,948 | $440.68 | 41% |
| Hermantown | 21 | $3,608 | $346.40 | 49% |
| Baxter | 13 | $3,607 | $417.09 | 41% |
| Deerwood | 31 | $3,538 | $415.59 | 39% |