Golden Valley Airbnb Market Analysis 2026: Short Term Rental Data & Vacation Rental Statistics in Minnesota, United States
Is Airbnb profitable in Golden Valley in 2026? Explore comprehensive Airbnb analytics for Golden Valley, Minnesota, United States to uncover income potential. This 2026 STR market report for Golden Valley, based on AirROI data from February 2025 to January 2026, reveals key trends in the niche market of 22 active listings.
Whether you're considering an Airbnb investment in Golden Valley, optimizing your existing vacation rental, or exploring rental arbitrage opportunities, understanding the Golden Valley Airbnb data is crucial. Leveraging the low regulation environment is key to maximizing your short term rental income potential. Let's dive into the specifics.
Key Golden Valley Airbnb Performance Metrics Overview
Monthly Airbnb Revenue Variations & Income Potential in Golden Valley (2026)
Understanding the monthly revenue variations for Airbnb listings in Golden Valley is key to maximizing your short term rental income potential. Seasonality significantly impacts earnings. Our analysis, based on data from the past 12 months, shows that the peak revenue month for STRs in Golden Valley is typically July, while March often presents the lowest earnings, highlighting opportunities for strategic pricing adjustments during shoulder and low seasons. Explore the typical Airbnb income in Golden Valley across different performance tiers:
- Best-in-class properties (Top 10%) achieve $7,115+ monthly, often utilizing dynamic pricing and superior guest experiences.
- Strong performing properties (Top 25%) earn $4,620 or more, indicating effective management and desirable locations/amenities.
- Typical properties (Median) generate around $1,761 per month, representing the average market performance.
- Entry-level properties (Bottom 25%) see earnings around $1,001, often with potential for optimization.
Average Monthly Airbnb Earnings Trend in Golden Valley
Golden Valley Airbnb Occupancy Rate Trends (2026)
Maximize your bookings by understanding the Golden Valley STR occupancy trends. Seasonal demand shifts significantly influence how often properties are booked. Typically, Julysees the highest demand (peak season occupancy), while January experiences the lowest (low season). Effective strategies, like adjusting minimum stays or offering promotions, can boost occupancy during slower periods. Here's how different property tiers perform in Golden Valley:
- Best-in-class properties (Top 10%) achieve 79%+ occupancy, indicating high desirability and potentially optimized availability.
- Strong performing properties (Top 25%) maintain 66% or higher occupancy, suggesting good market fit and guest satisfaction.
- Typical properties (Median) have an occupancy rate around 47%.
- Entry-level properties (Bottom 25%) average 33% occupancy, potentially facing higher vacancy.
Average Monthly Occupancy Rate Trend in Golden Valley
Average Daily Rate (ADR) Airbnb Trends in Golden Valley (2026)
Effective short term rental pricing strategy in Golden Valley involves understanding monthly ADR fluctuations. The Average Daily Rate (ADR) for Airbnb in Golden Valley typically peaks in November and dips lowest during February. Leveraging Airbnb dynamic pricing tools or strategies based on this seasonality can significantly boost revenue. Here's a look at the typical nightly rates achieved:
- Best-in-class properties (Top 10%) command rates of $503+ per night, often due to premium features or locations.
- Strong performing properties (Top 25%) achieve nightly rates of $281 or more.
- Typical properties (Median) charge around $163 per night.
- Entry-level properties (Bottom 25%) earn around $70 per night.
Average Daily Rate (ADR) Trend by Month in Golden Valley
Get Live Golden Valley Market Intelligence 👇

Explore Real-time Analytics
Airbnb Seasonality Analysis & Trends in Golden Valley (2026)
Peak Season (July, October, June)
- Revenue averages $3,653 per month
- Occupancy rates average 57.0%
- Daily rates average $222
Shoulder Season
- Revenue averages $3,155 per month
- Occupancy maintains around 47.7%
- Daily rates hold near $219
Low Season (January, February, March)
- Revenue drops to average $2,117 per month
- Occupancy decreases to average 39.8%
- Daily rates adjust to average $202
Seasonality Insights for Golden Valley
- The Airbnb seasonality in Golden Valley shows moderate seasonality with distinct peak and low periods. While the sections above show seasonal averages, it's also insightful to look at the extremes:
- During the high season, the absolute peak month showcases Golden Valley's highest earning potential, with monthly revenues capable of climbing to $3,772, occupancy reaching a high of 66.0%, and ADRs peaking at $235.
- Conversely, the slowest single month of the year, typically falling within the low season, marks the market's lowest point. In this month, revenue might dip to $2,037, occupancy could drop to 33.7%, and ADRs may adjust down to $182.
- Understanding both the seasonal averages and these monthly peaks and troughs in revenue, occupancy, and ADR is crucial for maximizing your Airbnb profit potential in Golden Valley.
Seasonal Strategies for Maximizing Profit
- Peak Season: Maximize revenue through premium pricing and potentially longer minimum stays. Ensure high availability.
- Low Season: Offer competitive pricing, special promotions (e.g., extended stay discounts), and flexible cancellation policies. Target off-season travelers like remote workers or budget-conscious guests.
- Shoulder Seasons: Implement dynamic pricing that balances peak and low rates. Target weekend travelers or specific events. Offer slightly more flexible terms than peak season.
- Regularly analyze your own performance against these Golden Valley seasonality benchmarks and adjust your pricing and availability strategy accordingly.
Best Areas for Airbnb Investment in Golden Valley (2026)
Exploring the top neighborhoods for short-term rentals in Golden Valley? This section highlights key areas, outlining why they are attractive for hosts and guests, along with notable local attractions. Consider these locations based on your target guest profile and investment strategy.
| Neighborhood / Area | Why Host Here? (Target Guests & Appeal) | Key Attractions & Landmarks |
|---|---|---|
| Friendly Hills | A welcoming neighborhood known for its family-friendly atmosphere and proximity to parks. Ideal for families and those looking for a tranquil stay while being close to local attractions. | Golden Valley Park, Northwood Park, Bassett Creek, Wisconsin Avenue Park |
| Glenwood | A suburban area with easy access to Minneapolis, making it perfect for business travelers and those wanting to explore the Twin Cities. | Theo Wirth Park, Golden Valley Country Club, Wirth Lake, Bike trails and walking paths |
| Brookview | Close to Brookview Community Center and ideal for guests looking to enjoy recreational activities. Great for families and group travelers. | Brookview Community Center, Minnehaha Creek, Golden Valley Golf Course |
| Hwy 169 Corridor | Well-connected via major highways, this area offers convenience for guests looking to explore beyond Golden Valley. Perfect for those who want to venture into Minneapolis and surrounding suburbs. | Plymouth Creek Center, Restaurants along Highway 169, Easy access to shopping centers |
| Golden Valley Town Center | Central area with shops and restaurants, making it convenient for travelers to enjoy local dining and activities. | The Town Center, Local dining options, Community events |
| North Golden Valley | A quieter part of the city with residential charm, appealing to travelers looking for a homely atmosphere. | Nature trails, Small parks, Community spaces |
| West Golden Valley | Close to freeway access and offers various lodging options. Good for travelers needing quick access to Minneapolis amenities. | Nearby shopping districts, Parks and recreation areas |
| East Golden Valley | A growing area with access to retail and dining, ideal for tourists wanting a mix of local culture and convenience. | Local cafes, Shopping options, Parks nearby |
Understanding Airbnb License Requirements & STR Laws in Golden Valley (2026)
While Golden Valley, Minnesota, United States currently shows low STR regulations, specific Airbnb license requirements might still exist or change. Always verify the latest short term rental regulations and Airbnb license requirements directly with local government authorities for Golden Valley to ensure full compliance before hosting.
(Source: AirROI data, 2026, finding no licensed listings among those analyzed)
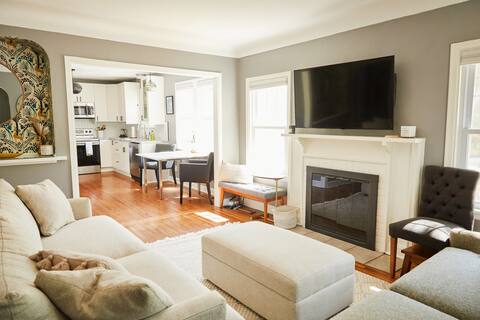
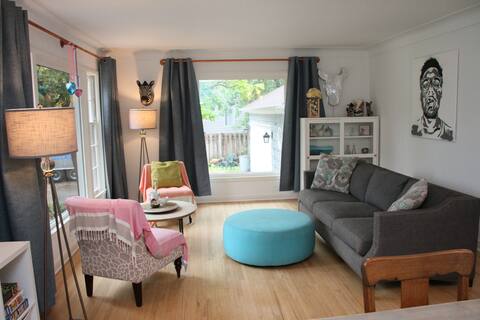
Top Performing Airbnb Properties in Golden Valley (2026)
Benchmark your potential! Explore examples of top-performing Airbnb properties in Golden Valleybased on Trailing Twelve Month (TTM) revenue. Analyze their characteristics, revenue, occupancy rate, and ADR to understand what drives success in this market.

Luxury 5500 Sq ft Executive Home
Entire Place • 5 bedrooms
"City Cabin" steps to Theo Wirth, mins to downtown
Entire Place • 3 bedrooms

Minneapolis Home w/Luxuries! Hot Tub, Gym
Entire Place • 5 bedrooms

Minne-home (right side) in Golden Valley
Entire Place • 3 bedrooms
Casa Kelly - Pet Friendly! Pickleball Nearby!
Entire Place • 4 bedrooms

Minne-home (left side) in Golden Valley
Entire Place • 3 bedrooms
Note: Performance varies based on location, size, amenities, seasonality, and management quality. Data reflects the past 12 months.
Top Performing Airbnb Hosts in Golden Valley (2026)
Learn from the best! This table showcases top-performing Airbnb hosts in Golden Valley based on the number of properties managed and estimated total revenue over the past year. Analyze their scale and performance metrics.
| Host Name | Properties | Grossing Revenue | Stay Reviews | Avg Rating |
|---|---|---|---|---|
| Marcel | 1 | $109,286 | 118 | 4.98/5.0 |
| Tasha | 2 | $93,817 | 57 | 4.96/5.0 |
| Markie | 1 | $69,855 | 94 | 4.99/5.0 |
| Daniel | 1 | $62,500 | 45 | 4.91/5.0 |
| RedAwning Vacation Rentals | 1 | $35,488 | 19 | 4.84/5.0 |
| Minnestay | 1 | $30,394 | 18 | 4.94/5.0 |
| Nate | 1 | $27,796 | 41 | 4.93/5.0 |
| Ryan | 3 | $25,963 | 592 | 4.87/5.0 |
| Laura | 1 | $21,921 | 49 | 4.94/5.0 |
| Ms. Edna | 3 | $21,611 | 66 | 4.77/5.0 |
Analyzing the strategies of top hosts, such as their property selection, pricing, and guest communication, can offer valuable lessons for optimizing your own Airbnb operations in Golden Valley.
Dive Deeper: Advanced Golden Valley STR Market Data (2026)
Ready to unlock more insights? AirROI provides access to advanced metrics and comprehensive Airbnb data for Golden Valley. Explore detailed analytics beyond this report to refine your investment strategy, optimize pricing, and maximize your vacation rental profits.
Explore Advanced MetricsGolden Valley Short-Term Rental Market Composition (2026): Property & Room Types
Room Type Distribution
Property Type Distribution
Market Composition Insights for Golden Valley
- The Golden Valley Airbnb market composition is heavily skewed towards Entire Home/Apt listings, which make up 63.6% of the 22 active rentals. This indicates strong guest preference for privacy and space.
- However, a notable 36.4% share for Private Rooms suggests opportunities for budget-conscious travelers or hosts renting out spare rooms.
- Looking at the property type distribution in Golden Valley, House properties are the most common (95.5%), reflecting the local real estate landscape.
- Houses represent a significant 95.5% portion, catering likely to families or larger groups.
- Smaller segments like apartment/condo (combined 4.5%) offer potential for unique stay experiences.
Golden Valley Airbnb Room Capacity Analysis (2026): Bedroom Distribution
Distribution of Listings by Number of Bedrooms
Room Capacity Insights for Golden Valley
- The dominant room capacity in Golden Valley is 3 bedrooms listings, making up 27.3% of the market. This suggests a strong demand for properties suitable for families or small groups.
- Together, 3 bedrooms and 5+ bedrooms properties represent 40.9% of the active Airbnb listings in Golden Valley, indicating a high concentration in these sizes.
- A significant 45.4% of listings offer 3+ bedrooms, catering to larger groups and families seeking more space in Golden Valley.
Golden Valley Vacation Rental Guest Capacity Trends (2026)
Distribution of Listings by Guest Capacity
Guest Capacity Insights for Golden Valley
- The most common guest capacity trend in Golden Valley vacation rentals is listings accommodating 2 guests (13.6%). This suggests the primary traveler segment is likely couples or solo travelers.
- Properties designed for 2 guests and 4 guests dominate the Golden Valley STR market, accounting for 27.2% of listings.
- 27.2% of properties accommodate 6+ guests, serving the market segment for larger families or group travel in Golden Valley.
- On average, properties in Golden Valley are equipped to host 3.3 guests.
Golden Valley Airbnb Booking Patterns (2026): Available vs. Booked Days
Available Days Distribution
Booked Days Distribution
Booking Pattern Insights for Golden Valley
- The most common availability pattern in Golden Valley falls within the 271-366 days range, representing 40.9% of listings. This suggests many properties have significant open periods on their calendars.
- Approximately 63.6% of listings show high availability (181+ days open annually), indicating potential for increased bookings or specific owner usage patterns.
- For booked days, the 31-90 days range is most frequent in Golden Valley (31.8%), reflecting common guest stay durations or potential owner blocking patterns.
- A notable 36.3% of properties secure long booking periods (181+ days booked per year), highlighting successful long-term rental strategies or significant owner usage.
Golden Valley Airbnb Minimum Stay Requirements Analysis
Distribution of Listings by Minimum Night Requirement
1 Night
5 listings
22.7% of total
2 Nights
6 listings
27.3% of total
3 Nights
2 listings
9.1% of total
4-6 Nights
1 listings
4.5% of total
30+ Nights
8 listings
36.4% of total
Key Insights
- The most prevalent minimum stay requirement in Golden Valley is 30+ Nights, adopted by 36.4% of listings. This highlights the market's preference for longer commitments.
- A significant segment (36.4%) caters to monthly stays (30+ nights) in Golden Valley, pointing to opportunities in the extended-stay market.
Recommendations
- Align with the market by considering a 30+ Nights minimum stay, as 36.4% of Golden Valley hosts use this setting.
- If feasible, allowing 1-night stays, especially midweek or during low season, could capture last-minute bookings, as only 22.7% currently do.
- Explore offering discounts for stays of 30+ nights to attract the 36.4% of the market seeking extended stays.
- Adjust minimum nights based on seasonality – potentially shorter during low season and longer during peak demand periods in Golden Valley.
Golden Valley Airbnb Cancellation Policy Trends Analysis (2026)
Flexible
6 listings
27.3% of total
Moderate
4 listings
18.2% of total
Firm
7 listings
31.8% of total
Strict
5 listings
22.7% of total
Cancellation Policy Insights for Golden Valley
- The prevailing Airbnb cancellation policy trend in Golden Valley is Firm, used by 31.8% of listings.
- A majority (54.5%) of hosts in Golden Valley utilize Firm or Strict policies, indicating a market where hosts prioritize booking security.
Recommendations for Hosts
- Consider adopting a Firm policy to align with the 31.8% market standard in Golden Valley.
- Regularly review your cancellation policy against competitors and market demand shifts in Golden Valley.
Golden Valley STR Booking Lead Time Analysis (2026)
Average Booking Lead Time by Month
Booking Lead Time Insights for Golden Valley
- The overall average booking lead time for vacation rentals in Golden Valley is 40 days.
- Guests book furthest in advance for stays during July (average 68 days), likely coinciding with peak travel demand or local events.
- The shortest booking windows occur for stays in February (average 20 days), indicating more last-minute travel plans during this time.
- Seasonally, Summer (62 days avg.) sees the longest lead times, while Winter (33 days avg.) has the shortest, reflecting typical travel planning cycles.
Recommendations for Hosts
- Use the overall average lead time (40 days) as a baseline for your pricing and availability strategy in Golden Valley.
- For July stays, consider implementing length-of-stay discounts or slightly higher rates for bookings made less than 68 days out to capitalize on advance planning.
- Target marketing efforts for the Summer season well in advance (at least 62 days) to capture early planners.
- Monitor your own booking lead times against these Golden Valley averages to identify opportunities for dynamic pricing adjustments.
Popular & Essential Airbnb Amenities in Golden Valley (2026)
Amenity Prevalence
No amenities with partial availability (less than 100%) were found to display in the chart. All essential amenities might be present in all listings. Check insights below.
Amenity Insights for Golden Valley
- Essential amenities in Golden Valley that guests expect include: Smoke alarm, Shampoo, Microwave, Carbon monoxide alarm, Hot water, Iron, Coffee maker, Dishes and silverware, Heating, Free parking on premises. Lacking these (any) could significantly impact bookings.
Recommendations for Hosts
- Ensure your listing includes all essential amenities for Golden Valley: Smoke alarm, Shampoo, Microwave, Carbon monoxide alarm, Hot water, Iron, Coffee maker, Dishes and silverware, Heating, Free parking on premises.
- Highlight unique or less common amenities you offer (e.g., hot tub, dedicated workspace, EV charger) in your listing description and photos.
- Regularly check competitor amenities in Golden Valley to stay competitive.
Golden Valley Airbnb Guest Demographics & Profile Analysis (2026)
Guest Profile Summary for Golden Valley
- The typical guest profile for Airbnb in Golden Valley consists of primarily domestic travelers (93%), often arriving from nearby Minneapolis, typically belonging to the Post-2000s (Gen Z/Alpha) group (50%), primarily speaking English or Spanish.
- Domestic travelers account for 92.9% of guests.
- Key international markets include United States (92.9%) and Canada (2.4%).
- Top languages spoken are English (79.7%) followed by Spanish (5.4%).
- A significant demographic segment is the Post-2000s (Gen Z/Alpha) group, representing 50% of guests.
Recommendations for Hosts
- Target domestic marketing efforts towards travelers from Minneapolis and West Fargo.
- Tailor amenities and listing descriptions to appeal to the dominant Post-2000s (Gen Z/Alpha) demographic (e.g., highlight fast WiFi, smart home features, local guides).
- Highlight unique local experiences or amenities relevant to the primary guest profile.
- Consider seasonal promotions aligned with peak travel times for key origin markets.
Nearby Short-Term Rental Market Comparison
How does the Golden Valley Airbnb market stack up against its neighbors? Compare key performance metrics like average monthly revenue, ADR, and occupancy rates in surrounding areas to understand the broader regional STR landscape.
| Market | Active Properties | Monthly Revenue | Daily Rate | Avg. Occupancy |
|---|---|---|---|---|
| Hastings | 14 | $6,579 | $481.32 | 46% |
| Shoreview | 12 | $5,525 | $470.30 | 56% |
| Forest Lake | 25 | $4,839 | $398.24 | 47% |
| Wayzata | 20 | $4,819 | $432.69 | 50% |
| Mound | 15 | $4,463 | $459.67 | 48% |
| Fridley | 26 | $4,404 | $294.56 | 54% |
| Scandia | 13 | $4,256 | $429.44 | 41% |
| Town of Georgetown | 18 | $4,200 | $607.30 | 34% |
| Stillwater | 55 | $4,146 | $369.15 | 41% |
| Excelsior | 27 | $4,076 | $399.51 | 42% |