Twin Lake Airbnb Market Analysis 2025: Short Term Rental Data & Vacation Rental Statistics in Michigan, United States
Is Airbnb profitable in Twin Lake in 2025? Explore comprehensive Airbnb analytics for Twin Lake, Michigan, United States to uncover income potential. This 2025 STR market report for Twin Lake, based on AirROI data from June 2024 to May 2025, reveals key trends in the niche market of 19 active listings.
Whether you're considering an Airbnb investment in Twin Lake, optimizing your existing vacation rental, or exploring rental arbitrage opportunities, understanding the Twin Lake Airbnb data is crucial. Leveraging the low regulation environment is key to maximizing your short term rental income potential. Let's dive into the specifics.
Key Twin Lake Airbnb Performance Metrics Overview
Monthly Airbnb Revenue Variations & Income Potential in Twin Lake (2025)
Understanding the monthly revenue variations for Airbnb listings in Twin Lake is key to maximizing your short term rental income potential. Seasonality significantly impacts earnings. Our analysis, based on data from the past 12 months, shows that the peak revenue month for STRs in Twin Lake is typically July, while March often presents the lowest earnings, highlighting opportunities for strategic pricing adjustments during shoulder and low seasons. Explore the typical Airbnb income in Twin Lake across different performance tiers:
- Best-in-class properties (Top 10%) achieve $7,740+ monthly, often utilizing dynamic pricing and superior guest experiences.
- Strong performing properties (Top 25%) earn $4,426 or more, indicating effective management and desirable locations/amenities.
- Typical properties (Median) generate around $2,159 per month, representing the average market performance.
- Entry-level properties (Bottom 25%) see earnings around $1,348, often with potential for optimization.
Average Monthly Airbnb Earnings Trend in Twin Lake
Twin Lake Airbnb Occupancy Rate Trends (2025)
Maximize your bookings by understanding the Twin Lake STR occupancy trends. Seasonal demand shifts significantly influence how often properties are booked. Typically, Junesees the highest demand (peak season occupancy), while May experiences the lowest (low season). Effective strategies, like adjusting minimum stays or offering promotions, can boost occupancy during slower periods. Here's how different property tiers perform in Twin Lake:
- Best-in-class properties (Top 10%) achieve 76%+ occupancy, indicating high desirability and potentially optimized availability.
- Strong performing properties (Top 25%) maintain 61% or higher occupancy, suggesting good market fit and guest satisfaction.
- Typical properties (Median) have an occupancy rate around 34%.
- Entry-level properties (Bottom 25%) average 22% occupancy, potentially facing higher vacancy.
Average Monthly Occupancy Rate Trend in Twin Lake
Average Daily Rate (ADR) Airbnb Trends in Twin Lake (2025)
Effective short term rental pricing strategy in Twin Lake involves understanding monthly ADR fluctuations. The Average Daily Rate (ADR) for Airbnb in Twin Lake typically peaks in April and dips lowest during December. Leveraging Airbnb dynamic pricing tools or strategies based on this seasonality can significantly boost revenue. Here's a look at the typical nightly rates achieved:
- Best-in-class properties (Top 10%) command rates of $1,085+ per night, often due to premium features or locations.
- Strong performing properties (Top 25%) achieve nightly rates of $531 or more.
- Typical properties (Median) charge around $340 per night.
- Entry-level properties (Bottom 25%) earn around $156 per night.
Average Daily Rate (ADR) Trend by Month in Twin Lake
Get Live Twin Lake Market Intelligence 👇

Explore Real-time Analytics
Airbnb Seasonality Analysis & Trends in Twin Lake (2025)
Peak Season (July, August, June)
- Revenue averages $6,740 per month
- Occupancy rates average 67.5%
- Daily rates average $458
Shoulder Season
- Revenue averages $2,875 per month
- Occupancy maintains around 37.9%
- Daily rates hold near $564
Low Season (January, March, December)
- Revenue drops to average $1,142 per month
- Occupancy decreases to average 28.6%
- Daily rates adjust to average $542
Seasonality Insights for Twin Lake
- The Airbnb seasonality in Twin Lake shows highly seasonal trends requiring careful strategy. While the sections above show seasonal averages, it's also insightful to look at the extremes:
- During the high season, the absolute peak month showcases Twin Lake's highest earning potential, with monthly revenues capable of climbing to $8,156, occupancy reaching a high of 77.2%, and ADRs peaking at $710.
- Conversely, the slowest single month of the year, typically falling within the low season, marks the market's lowest point. In this month, revenue might dip to $1,071, occupancy could drop to 19.4%, and ADRs may adjust down to $422.
- Understanding both the seasonal averages and these monthly peaks and troughs in revenue, occupancy, and ADR is crucial for maximizing your Airbnb profit potential in Twin Lake.
Seasonal Strategies for Maximizing Profit
- Peak Season: Maximize revenue through premium pricing and potentially longer minimum stays. Ensure high availability.
- Low Season: Offer competitive pricing, special promotions (e.g., extended stay discounts), and flexible cancellation policies. Target off-season travelers like remote workers or budget-conscious guests.
- Shoulder Seasons: Implement dynamic pricing that balances peak and low rates. Target weekend travelers or specific events. Offer slightly more flexible terms than peak season.
- Regularly analyze your own performance against these Twin Lake seasonality benchmarks and adjust your pricing and availability strategy accordingly.
Best Areas for Airbnb Investment in Twin Lake (2025)
Exploring the top neighborhoods for short-term rentals in Twin Lake? This section highlights key areas, outlining why they are attractive for hosts and guests, along with notable local attractions. Consider these locations based on your target guest profile and investment strategy.
| Neighborhood / Area | Why Host Here? (Target Guests & Appeal) | Key Attractions & Landmarks |
|---|---|---|
| Lake Michigan Shoreline | Beautiful sandy beaches and stunning sunsets make this area appealing for tourists. Ideal for vacation rentals with a focus on waterfront properties. | Lake Michigan, Pere Marquette Park, Silver Lake State Park, Saugatuck Dunes State Park, Silver Lake, Little Sable Point Lighthouse |
| Twin Lake Access Area | A serene and tranquil setting perfect for nature lovers and those looking for a peaceful retreat. Close proximity to multiple lakes and parks. | Twin Lake, Twin Lake Park, Hart-Montague Bike Trail, Manistee National Forest, Nearby fishing spots |
| Muskegon | A larger nearby city offering a variety of attractions, vibrant downtown, and a growing tourism sector. Great for those offering urban-style rental experiences. | Muskegon State Park, Lake Express Ferry, Muskegon Museum of Art, Hoffmaster State Park, Muskegon Channel, Michigan's Adventure Amusement Park |
| Whitehall | A quaint town with a charming downtown area and access to beautiful lakes. Great for family vacations and outdoor activities. | White Lake, Pere Marquette Lake, Downtown Whitehall, Shelby State Park, Nearby wineries |
| Pentwater | A picturesque village known for its fresh fish and charming downtown, popular among tourists during the summer months. | Pentwater Lake, Pentwater Harbor, Charles Mears State Park, Pentwater Historical Society Museum, Lake Michigan beaches |
| Hart | Known for its outdoor recreation opportunities, including boating and hiking, Hart is a great destination for nature-focused renters. | Hart Lake, Hart Historic District, Silver Lake State Park, Nearby trails, Fishing opportunities |
| New Era | Small town charm with access to nature and cultural experiences, ideal for tranquil living and vacation rentals focused on relaxation. | Silver Lake State Park, Nearby dunes, Local farms, Manistee National Forest trails, Coastal lakes |
| Oceana County | Offers a diverse range of outdoor activities, including hiking, fishing, and beach access, attracting families and outdoor enthusiasts. | Lake Michigan, Oceana State Park, Pine River, Local artisanal markets, Fishing spots |
Understanding Airbnb License Requirements & STR Laws in Twin Lake (2025)
While Twin Lake, Michigan, United States currently shows low STR regulations, specific Airbnb license requirements might still exist or change. Always verify the latest short term rental regulations and Airbnb license requirements directly with local government authorities for Twin Lake to ensure full compliance before hosting.
(Source: AirROI data, 2025, finding no licensed listings among those analyzed)
Top Performing Airbnb Properties in Twin Lake (2025)
Benchmark your potential! Explore examples of top-performing Airbnb properties in Twin Lakebased on Trailing Twelve Month (TTM) revenue. Analyze their characteristics, revenue, occupancy rate, and ADR to understand what drives success in this market.
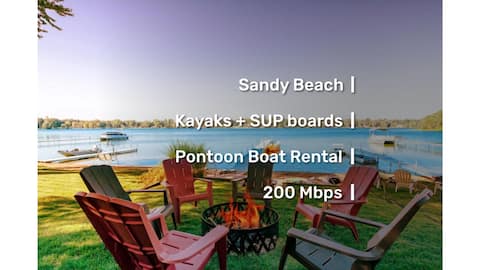
Lakefront + Beach | Pontoon Boat Rental | Firepit
Entire Place • 3 bedrooms
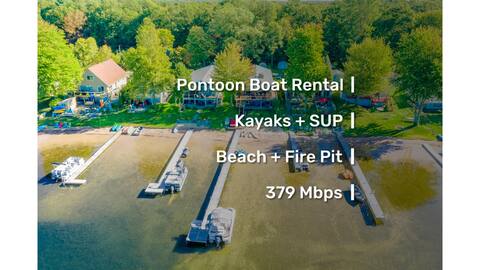
Beach | Kayaks + SUP | Pontoon Boat | HotTub + BBQ
Entire Place • 3 bedrooms

South Shore Resort-Entire Resort
Private Room • 18 bedrooms
South Shore Resort - The Lodge
Entire Place • 7 bedrooms

Lakefront Views Fire Pit Fishing Sleeps 12
Entire Place • 3 bedrooms

Grandma's lake house
Entire Place • 5 bedrooms
Note: Performance varies based on location, size, amenities, seasonality, and management quality. Data reflects the past 12 months.
Top Performing Airbnb Hosts in Twin Lake (2025)
Learn from the best! This table showcases top-performing Airbnb hosts in Twin Lake based on the number of properties managed and estimated total revenue over the past year. Analyze their scale and performance metrics.
| Host Name | Properties | Grossing Revenue | Stay Reviews | Avg Rating |
|---|---|---|---|---|
| Host #168700444 | 6 | $136,290 | 5 | N/A/5.0 |
| Kathy | 2 | $127,339 | 188 | 4.84/5.0 |
| Michelle (Mike) | 2 | $48,873 | 145 | 4.99/5.0 |
| Kevin | 1 | $28,872 | 57 | 4.88/5.0 |
| Colin | 1 | $25,935 | 123 | 4.82/5.0 |
| Nancy | 1 | $24,816 | 32 | 5.00/5.0 |
| Russell | 1 | $18,019 | 45 | 5.00/5.0 |
| Arthur | 1 | $12,188 | 26 | 4.77/5.0 |
| Brian | 1 | $11,032 | 185 | 4.98/5.0 |
| Mary | 1 | $9,506 | 8 | 4.50/5.0 |
Analyzing the strategies of top hosts, such as their property selection, pricing, and guest communication, can offer valuable lessons for optimizing your own Airbnb operations in Twin Lake.
Dive Deeper: Advanced Twin Lake STR Market Data (2025)
Ready to unlock more insights? AirROI provides access to advanced metrics and comprehensive Airbnb data for Twin Lake. Explore detailed analytics beyond this report to refine your investment strategy, optimize pricing, and maximize your vacation rental profits.
Explore Advanced MetricsTwin Lake Short-Term Rental Market Composition (2025): Property & Room Types
Room Type Distribution
Property Type Distribution
Market Composition Insights for Twin Lake
- The Twin Lake Airbnb market composition is heavily skewed towards Entire Home/Apt listings, which make up 89.5% of the 19 active rentals. This indicates strong guest preference for privacy and space.
- Looking at the property type distribution in Twin Lake, House properties are the most common (57.9%), reflecting the local real estate landscape.
- Houses represent a significant 57.9% portion, catering likely to families or larger groups.
- The presence of 5.3% Hotel/Boutique listings indicates integration with traditional hospitality.
Twin Lake Airbnb Room Capacity Analysis (2025): Bedroom Distribution
Distribution of Listings by Number of Bedrooms
Room Capacity Insights for Twin Lake
- The dominant room capacity in Twin Lake is 3 bedrooms listings, making up 26.3% of the market. This suggests a strong demand for properties suitable for families or small groups.
- Together, 3 bedrooms and 2 bedrooms properties represent 52.6% of the active Airbnb listings in Twin Lake, indicating a high concentration in these sizes.
- A significant 52.6% of listings offer 3+ bedrooms, catering to larger groups and families seeking more space in Twin Lake.
Twin Lake Vacation Rental Guest Capacity Trends (2025)
Distribution of Listings by Guest Capacity
Guest Capacity Insights for Twin Lake
- The most common guest capacity trend in Twin Lake vacation rentals is listings accommodating 8+ guests (47.4%). This suggests the primary traveler segment is likely larger groups.
- Properties designed for 8+ guests and 6 guests dominate the Twin Lake STR market, accounting for 63.2% of listings.
- 63.2% of properties accommodate 6+ guests, serving the market segment for larger families or group travel in Twin Lake.
- On average, properties in Twin Lake are equipped to host 6.0 guests.
Twin Lake Airbnb Booking Patterns (2025): Available vs. Booked Days
Available Days Distribution
Booked Days Distribution
Booking Pattern Insights for Twin Lake
- The most common availability pattern in Twin Lake falls within the 271-366 days range, representing 63.2% of listings. This suggests many properties have significant open periods on their calendars.
- Approximately 89.5% of listings show high availability (181+ days open annually), indicating potential for increased bookings or specific owner usage patterns.
- For booked days, the 31-90 days range is most frequent in Twin Lake (42.1%), reflecting common guest stay durations or potential owner blocking patterns.
- A notable 15.8% of properties secure long booking periods (181+ days booked per year), highlighting successful long-term rental strategies or significant owner usage.
Twin Lake Airbnb Minimum Stay Requirements Analysis
Distribution of Listings by Minimum Night Requirement
1 Night
2 listings
15.4% of total
2 Nights
6 listings
46.2% of total
3 Nights
2 listings
15.4% of total
4-6 Nights
1 listings
7.7% of total
30+ Nights
2 listings
15.4% of total
Key Insights
- The most prevalent minimum stay requirement in Twin Lake is 2 Nights, adopted by 46.2% of listings. This highlights the market's preference for shorter, flexible bookings.
- A strong majority (61.6%) of the Twin Lake Airbnb data shows acceptance of very short stays (1-2 nights), indicating a dynamic, high-turnover market.
- A significant segment (15.4%) caters to monthly stays (30+ nights) in Twin Lake, pointing to opportunities in the extended-stay market.
Recommendations
- Align with the market by considering a 2 Nights minimum stay, as 46.2% of Twin Lake hosts use this setting.
- If feasible, allowing 1-night stays, especially midweek or during low season, could capture last-minute bookings, as only 15.4% currently do.
- A 2-night minimum appears standard (46.2%). Consider this for weekends or peak periods.
- Explore offering discounts for stays of 30+ nights to attract the 15.4% of the market seeking extended stays.
- Adjust minimum nights based on seasonality – potentially shorter during low season and longer during peak demand periods in Twin Lake.
Twin Lake Airbnb Cancellation Policy Trends Analysis (2025)
Flexible
3 listings
23.1% of total
Moderate
2 listings
15.4% of total
Firm
6 listings
46.2% of total
Strict
2 listings
15.4% of total
Cancellation Policy Insights for Twin Lake
- The prevailing Airbnb cancellation policy trend in Twin Lake is Firm, used by 46.2% of listings.
- A majority (61.6%) of hosts in Twin Lake utilize Firm or Strict policies, indicating a market where hosts prioritize booking security.
Recommendations for Hosts
- Consider adopting a Firm policy to align with the 46.2% market standard in Twin Lake.
- Regularly review your cancellation policy against competitors and market demand shifts in Twin Lake.
Twin Lake STR Booking Lead Time Analysis (2025)
Average Booking Lead Time by Month
Booking Lead Time Insights for Twin Lake
- The overall average booking lead time for vacation rentals in Twin Lake is 64 days.
- Guests book furthest in advance for stays during June (average 105 days), likely coinciding with peak travel demand or local events.
- The shortest booking windows occur for stays in February (average 22 days), indicating more last-minute travel plans during this time.
- Seasonally, Summer (87 days avg.) sees the longest lead times, while Winter (35 days avg.) has the shortest, reflecting typical travel planning cycles.
Recommendations for Hosts
- Use the overall average lead time (64 days) as a baseline for your pricing and availability strategy in Twin Lake.
- For June stays, consider implementing length-of-stay discounts or slightly higher rates for bookings made less than 105 days out to capitalize on advance planning.
- Target marketing efforts for the Summer season well in advance (at least 87 days) to capture early planners.
- Monitor your own booking lead times against these Twin Lake averages to identify opportunities for dynamic pricing adjustments.
Popular & Essential Airbnb Amenities in Twin Lake (2025)
Amenity Prevalence
Amenity Insights for Twin Lake
- Essential amenities in Twin Lake that guests expect include: Wifi, Free parking on premises, TV, Smoke alarm, Fire extinguisher, Essentials, Heating, Hot water. Lacking these (any) could significantly impact bookings.
- Popular amenities like Washer, Air conditioning are common but not universal. Offering these can provide a competitive edge.
Recommendations for Hosts
- Ensure your listing includes all essential amenities for Twin Lake: Wifi, Free parking on premises, TV, Smoke alarm, Fire extinguisher, Essentials, Heating, Hot water.
- Consider adding popular differentiators like Washer or Air conditioning to increase appeal.
- Highlight unique or less common amenities you offer (e.g., hot tub, dedicated workspace, EV charger) in your listing description and photos.
- Regularly check competitor amenities in Twin Lake to stay competitive.
Twin Lake Airbnb Guest Demographics & Profile Analysis (2025)
Guest Profile Summary for Twin Lake
- The typical guest profile for Airbnb in Twin Lake consists of primarily domestic travelers (100%), often arriving from nearby Phoenix, typically belonging to the Post-2000s (Gen Z/Alpha) group (50%), primarily speaking English or French.
- Domestic travelers account for 100.0% of guests.
- Top languages spoken are English (89.3%) followed by French (1.8%).
- A significant demographic segment is the Post-2000s (Gen Z/Alpha) group, representing 50% of guests.
Recommendations for Hosts
- Target domestic marketing efforts towards travelers from Phoenix and Chicago.
- Tailor amenities and listing descriptions to appeal to the dominant Post-2000s (Gen Z/Alpha) demographic (e.g., highlight fast WiFi, smart home features, local guides).
- Highlight unique local experiences or amenities relevant to the primary guest profile.
- Consider seasonal promotions aligned with peak travel times for key origin markets.
Nearby Short-Term Rental Market Comparison
How does the Twin Lake Airbnb market stack up against its neighbors? Compare key performance metrics like average monthly revenue, ADR, and occupancy rates in surrounding areas to understand the broader regional STR landscape.
| Market | Active Properties | Monthly Revenue | Daily Rate | Avg. Occupancy |
|---|---|---|---|---|
| Town of Nasewaupee | 33 | $5,152 | $373.81 | 51% |
| Port Sheldon Township | 27 | $4,966 | $524.17 | 51% |
| Laketown Township | 63 | $4,922 | $478.94 | 44% |
| Greilickville | 39 | $4,882 | $481.10 | 45% |
| Fennville | 10 | $4,871 | $381.30 | 41% |
| Saugatuck Township | 145 | $4,610 | $466.47 | 42% |
| Town of Holland | 15 | $4,609 | $422.36 | 52% |
| Blair Township | 52 | $4,414 | $459.88 | 43% |
| Ganges Township | 59 | $4,234 | $526.66 | 36% |
| Bingham Township | 27 | $4,140 | $521.70 | 45% |