Sault Ste. Marie Airbnb Market Analysis 2025: Short Term Rental Data & Vacation Rental Statistics in Michigan, United States
Is Airbnb profitable in Sault Ste. Marie in 2025? Explore comprehensive Airbnb analytics for Sault Ste. Marie, Michigan, United States to uncover income potential. This 2025 STR market report for Sault Ste. Marie, based on AirROI data from April 2024 to March 2025, reveals key trends in the niche market of 47 active listings.
Whether you're considering an Airbnb investment in Sault Ste. Marie, optimizing your existing vacation rental, or exploring rental arbitrage opportunities, understanding the Sault Ste. Marie Airbnb data is crucial. Leveraging the low regulation environment is key to maximizing your short term rental income potential. Let's dive into the specifics.
Key Sault Ste. Marie Airbnb Performance Metrics Overview
Monthly Airbnb Revenue Variations & Income Potential in Sault Ste. Marie (2025)
Understanding the monthly revenue variations for Airbnb listings in Sault Ste. Marie is key to maximizing your short term rental income potential. Seasonality significantly impacts earnings. Our analysis, based on data from the past 12 months, shows that the peak revenue month for STRs in Sault Ste. Marie is typically July, while December often presents the lowest earnings, highlighting opportunities for strategic pricing adjustments during shoulder and low seasons. Explore the typical Airbnb income in Sault Ste. Marie across different performance tiers:
- Best-in-class properties (Top 10%) achieve $4,695+ monthly, often utilizing dynamic pricing and superior guest experiences.
- Strong performing properties (Top 25%) earn $3,393 or more, indicating effective management and desirable locations/amenities.
- Typical properties (Median) generate around $2,214 per month, representing the average market performance.
- Entry-level properties (Bottom 25%) see earnings around $1,329, often with potential for optimization.
Average Monthly Airbnb Earnings Trend in Sault Ste. Marie
Sault Ste. Marie Airbnb Occupancy Rate Trends (2025)
Maximize your bookings by understanding the Sault Ste. Marie STR occupancy trends. Seasonal demand shifts significantly influence how often properties are booked. Typically, Julysees the highest demand (peak season occupancy), while December experiences the lowest (low season). Effective strategies, like adjusting minimum stays or offering promotions, can boost occupancy during slower periods. Here's how different property tiers perform in Sault Ste. Marie:
- Best-in-class properties (Top 10%) achieve 81%+ occupancy, indicating high desirability and potentially optimized availability.
- Strong performing properties (Top 25%) maintain 67% or higher occupancy, suggesting good market fit and guest satisfaction.
- Typical properties (Median) have an occupancy rate around 48%.
- Entry-level properties (Bottom 25%) average 33% occupancy, potentially facing higher vacancy.
Average Monthly Occupancy Rate Trend in Sault Ste. Marie
Average Daily Rate (ADR) Airbnb Trends in Sault Ste. Marie (2025)
Effective short term rental pricing strategy in Sault Ste. Marie involves understanding monthly ADR fluctuations. The Average Daily Rate (ADR) for Airbnb in Sault Ste. Marie typically peaks in July and dips lowest during April. Leveraging Airbnb dynamic pricing tools or strategies based on this seasonality can significantly boost revenue. Here's a look at the typical nightly rates achieved:
- Best-in-class properties (Top 10%) command rates of $241+ per night, often due to premium features or locations.
- Strong performing properties (Top 25%) achieve nightly rates of $173 or more.
- Typical properties (Median) charge around $139 per night.
- Entry-level properties (Bottom 25%) earn around $104 per night.
Average Daily Rate (ADR) Trend by Month in Sault Ste. Marie
Get Live Sault Ste. Marie Market Intelligence 👇

Explore Real-time Analytics
Airbnb Seasonality Analysis & Trends in Sault Ste. Marie (2025)
Peak Season (July, August, June)
- Revenue averages $3,778 per month
- Occupancy rates average 71.1%
- Daily rates average $150
Shoulder Season
- Revenue averages $2,431 per month
- Occupancy maintains around 46.7%
- Daily rates hold near $145
Low Season (March, November, December)
- Revenue drops to average $1,436 per month
- Occupancy decreases to average 33.8%
- Daily rates adjust to average $143
Seasonality Insights for Sault Ste. Marie
- The Airbnb seasonality in Sault Ste. Marie shows highly seasonal trends requiring careful strategy. While the sections above show seasonal averages, it's also insightful to look at the extremes:
- During the high season, the absolute peak month showcases Sault Ste. Marie's highest earning potential, with monthly revenues capable of climbing to $3,875, occupancy reaching a high of 76.9%, and ADRs peaking at $151.
- Conversely, the slowest single month of the year, typically falling within the low season, marks the market's lowest point. In this month, revenue might dip to $1,310, occupancy could drop to 31.3%, and ADRs may adjust down to $139.
- Understanding both the seasonal averages and these monthly peaks and troughs in revenue, occupancy, and ADR is crucial for maximizing your Airbnb profit potential in Sault Ste. Marie.
Seasonal Strategies for Maximizing Profit
- Peak Season: Maximize revenue through premium pricing and potentially longer minimum stays. Ensure high availability.
- Low Season: Offer competitive pricing, special promotions (e.g., extended stay discounts), and flexible cancellation policies. Target off-season travelers like remote workers or budget-conscious guests.
- Shoulder Seasons: Implement dynamic pricing that balances peak and low rates. Target weekend travelers or specific events. Offer slightly more flexible terms than peak season.
- Regularly analyze your own performance against these Sault Ste. Marie seasonality benchmarks and adjust your pricing and availability strategy accordingly.
Best Areas for Airbnb Investment in Sault Ste. Marie (2025)
Exploring the top neighborhoods for short-term rentals in Sault Ste. Marie? This section highlights key areas, outlining why they are attractive for hosts and guests, along with notable local attractions. Consider these locations based on your target guest profile and investment strategy.
| Neighborhood / Area | Why Host Here? (Target Guests & Appeal) | Key Attractions & Landmarks |
|---|---|---|
| Downtown Sault Ste. Marie | The heart of the city, offering a mix of dining, shopping, and cultural experiences. Ideal for those seeking convenience and access to local events. | Soo Locks, Lake Superior State University, Kewadin Casino, Sault Ste. Marie Museum, Shawamanang Park |
| Waterfront | Scenic views and outdoor activities make this area popular with tourists. Perfect for visitors looking to enjoy lakeside parks and recreation. | Sault Ste. Marie Boardwalk, Waterfront Park, Lake Huron, Fishing and boating opportunities, Local restaurants with lake views |
| East Side | Quiet residential area that appeals to families and those looking for a relaxing getaway. Close to nature trails and parks. | Fort Brady, Ermatinger-Clergue National Historic Site, Lakeside Park, Sault Ste. Marie Golf Club, Pine River Nature Area |
| West Side | A neighborhood with a rich history and local charm, great for visitors wanting to explore the culture of Sault Ste. Marie. | The Great Lakes Shipwreck Museum, Historic Fort Mackinac, Sault Ste. Marie Public Library, Local art galleries, Community parks |
| Sault Ste. Marie International Bridge | A strategic location for visitors crossing between the US and Canada. Attracts travelers needing easy border access. | View of the St. Marys River, Access to Canadian attractions, Historical landmarks, Souvenir shops, Nearby dining options |
| Gros Cap | A serene area known for its beautiful natural landscapes and outdoor activities. This area is great for nature lovers. | Gros Cap Marina, Hiking trails, Scenic picnics, Bird watching, Fishing areas |
| Sault Ste. Marie North | A more rural setting, appealing to those looking for peace and quiet away from the city. Great for families and nature retreats. | Sault Ste. Marie State Forest, Camping spots, Hiking opportunities, Wildlife viewing, Local farms |
| Sugar Island | An island community offering unique outdoor experiences and a retreat environment perfect for vacationers. | Sugar Island Ferry, Beaches, Fishing and hunting, Nature trails, Community events |
Understanding Airbnb License Requirements & STR Laws in Sault Ste. Marie (2025)
While Sault Ste. Marie, Michigan, United States currently shows low STR regulations, specific Airbnb license requirements might still exist or change. Always verify the latest short term rental regulations and Airbnb license requirements directly with local government authorities for Sault Ste. Marie to ensure full compliance before hosting.
(Source: AirROI data, 2025, finding no licensed listings among those analyzed)
Top Performing Airbnb Properties in Sault Ste. Marie (2025)
Benchmark your potential! Explore examples of top-performing Airbnb properties in Sault Ste. Mariebased on Trailing Twelve Month (TTM) revenue. Analyze their characteristics, revenue, occupancy rate, and ADR to understand what drives success in this market.
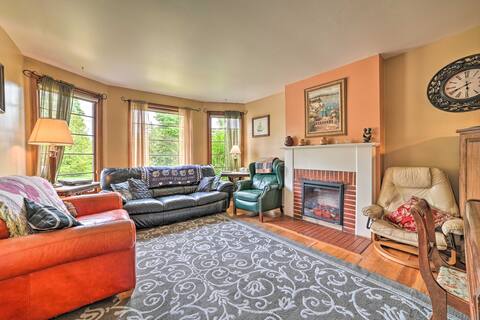
Sault Ste Marie Historic Home, Walk to Town!
Entire Place • 5 bedrooms

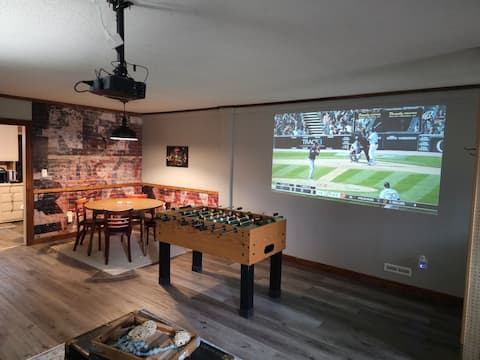
The Triple "R" - Road's End River Retreat!
Entire Place • 5 bedrooms
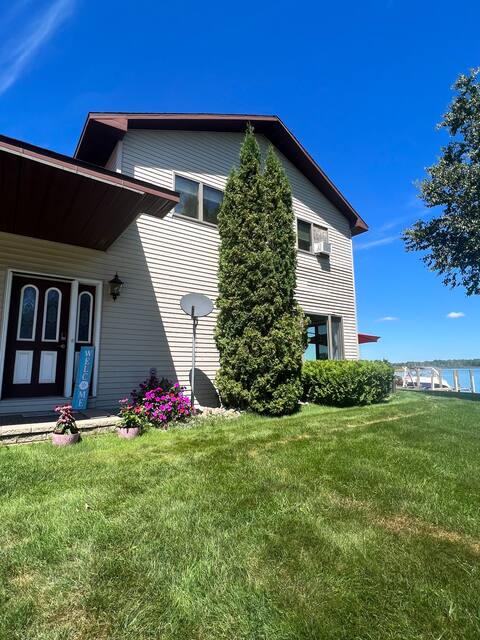
Bring the Whole Family!
Entire Place • 4 bedrooms
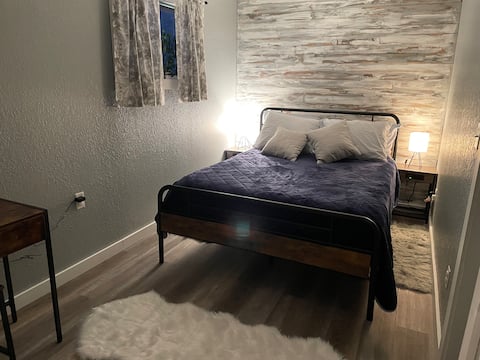
Riverside Retreat
Entire Place • 1 bedroom
Snowmobile trail and beach access near Nan’s Nook
Entire Place • 3 bedrooms
Historic John Quinn Saloon Loft Apartment
Entire Place • 1 bedroom
Note: Performance varies based on location, size, amenities, seasonality, and management quality. Data reflects the past 12 months.
Top Performing Airbnb Hosts in Sault Ste. Marie (2025)
Learn from the best! This table showcases top-performing Airbnb hosts in Sault Ste. Marie based on the number of properties managed and estimated total revenue over the past year. Analyze their scale and performance metrics.
| Host Name | Properties | Grossing Revenue | Stay Reviews | Avg Rating |
|---|---|---|---|---|
| Alekz | 8 | $194,120 | 265 | 4.84/5.0 |
| Danna | 3 | $110,227 | 573 | 4.99/5.0 |
| Evolve | 1 | $77,061 | 52 | 4.75/5.0 |
| Alan | 2 | $69,209 | 52 | 4.92/5.0 |
| Brianna | 1 | $68,447 | 38 | 5.00/5.0 |
| Connie | 2 | $62,528 | 174 | 4.95/5.0 |
| Alex | 2 | $54,462 | 152 | 4.89/5.0 |
| Fred | 2 | $49,572 | 163 | 4.75/5.0 |
| Marc | 1 | $49,396 | 165 | 4.94/5.0 |
| Jennifer | 1 | $41,674 | 26 | 5.00/5.0 |
Analyzing the strategies of top hosts, such as their property selection, pricing, and guest communication, can offer valuable lessons for optimizing your own Airbnb operations in Sault Ste. Marie.
Dive Deeper: Advanced Sault Ste. Marie STR Market Data (2025)
Ready to unlock more insights? AirROI provides access to advanced metrics and comprehensive Airbnb data for Sault Ste. Marie. Explore detailed analytics beyond this report to refine your investment strategy, optimize pricing, and maximize your vacation rental profits.
Explore Advanced MetricsSault Ste. Marie Short-Term Rental Market Composition (2025): Property & Room Types
Room Type Distribution
Property Type Distribution
Market Composition Insights for Sault Ste. Marie
- The Sault Ste. Marie Airbnb market composition is heavily skewed towards Entire Home/Apt listings, which make up 72.3% of the 47 active rentals. This indicates strong guest preference for privacy and space.
- Looking at the property type distribution in Sault Ste. Marie, Apartment/Condo properties are the most common (48.9%), reflecting the local real estate landscape.
- Houses represent a significant 44.7% portion, catering likely to families or larger groups.
- Smaller segments like others, unique stays, outdoor/unique (combined 6.3%) offer potential for unique stay experiences.
Sault Ste. Marie Airbnb Room Capacity Analysis (2025): Bedroom Distribution
Distribution of Listings by Number of Bedrooms
Room Capacity Insights for Sault Ste. Marie
- The dominant room capacity in Sault Ste. Marie is 1 bedroom listings, making up 36.2% of the market. This suggests a strong demand for properties suitable for couples or solo travelers.
- Together, 1 bedroom and 2 bedrooms properties represent 63.9% of the active Airbnb listings in Sault Ste. Marie, indicating a high concentration in these sizes.
- A significant 27.7% of listings offer 3+ bedrooms, catering to larger groups and families seeking more space in Sault Ste. Marie.
Sault Ste. Marie Vacation Rental Guest Capacity Trends (2025)
Distribution of Listings by Guest Capacity
Guest Capacity Insights for Sault Ste. Marie
- The most common guest capacity trend in Sault Ste. Marie vacation rentals is listings accommodating 4 guests (25.5%). This suggests the primary traveler segment is likely small families or groups.
- Properties designed for 4 guests and 2 guests dominate the Sault Ste. Marie STR market, accounting for 44.6% of listings.
- 38.2% of properties accommodate 6+ guests, serving the market segment for larger families or group travel in Sault Ste. Marie.
- On average, properties in Sault Ste. Marie are equipped to host 4.2 guests.
Sault Ste. Marie Airbnb Booking Patterns (2025): Available vs. Booked Days
Available Days Distribution
Booked Days Distribution
Booking Pattern Insights for Sault Ste. Marie
- The most common availability pattern in Sault Ste. Marie falls within the 181-270 days range, representing 46.8% of listings. This suggests many properties have significant open periods on their calendars.
- Approximately 63.8% of listings show high availability (181+ days open annually), indicating potential for increased bookings or specific owner usage patterns.
- For booked days, the 91-180 days range is most frequent in Sault Ste. Marie (42.6%), reflecting common guest stay durations or potential owner blocking patterns.
- A notable 40.4% of properties secure long booking periods (181+ days booked per year), highlighting successful long-term rental strategies or significant owner usage.
Sault Ste. Marie Airbnb Minimum Stay Requirements Analysis
Distribution of Listings by Minimum Night Requirement
1 Night
21 listings
46.7% of total
2 Nights
20 listings
44.4% of total
3 Nights
1 listings
2.2% of total
7-29 Nights
1 listings
2.2% of total
30+ Nights
2 listings
4.4% of total
Key Insights
- The most prevalent minimum stay requirement in Sault Ste. Marie is 1 Night, adopted by 46.7% of listings. This highlights the market's preference for shorter, flexible bookings.
- A strong majority (91.1%) of the Sault Ste. Marie Airbnb data shows acceptance of very short stays (1-2 nights), indicating a dynamic, high-turnover market.
Recommendations
- Align with the market by considering a 1 Night minimum stay, as 46.7% of Sault Ste. Marie hosts use this setting.
- Adjust minimum nights based on seasonality – potentially shorter during low season and longer during peak demand periods in Sault Ste. Marie.
Sault Ste. Marie Airbnb Cancellation Policy Trends Analysis (2025)
Super Strict 30 Days
1 listings
2.7% of total
Flexible
12 listings
32.4% of total
Moderate
12 listings
32.4% of total
Firm
7 listings
18.9% of total
Strict
5 listings
13.5% of total
Cancellation Policy Insights for Sault Ste. Marie
- The prevailing Airbnb cancellation policy trend in Sault Ste. Marie is Flexible, used by 32.4% of listings.
- There's a relatively balanced mix between guest-friendly (64.8%) and stricter (32.4%) policies, offering choices for different guest needs.
Recommendations for Hosts
- Consider adopting a Flexible policy to align with the 32.4% market standard in Sault Ste. Marie.
- Using a Strict policy might deter some guests, as only 13.5% of listings use it. Evaluate if potential revenue protection outweighs possible lower booking rates.
- Regularly review your cancellation policy against competitors and market demand shifts in Sault Ste. Marie.
Sault Ste. Marie STR Booking Lead Time Analysis (2025)
Average Booking Lead Time by Month
Booking Lead Time Insights for Sault Ste. Marie
- The overall average booking lead time for vacation rentals in Sault Ste. Marie is 48 days.
- Guests book furthest in advance for stays during July (average 80 days), likely coinciding with peak travel demand or local events.
- The shortest booking windows occur for stays in November (average 25 days), indicating more last-minute travel plans during this time.
- Seasonally, Summer (72 days avg.) sees the longest lead times, while Winter (43 days avg.) has the shortest, reflecting typical travel planning cycles.
Recommendations for Hosts
- Use the overall average lead time (48 days) as a baseline for your pricing and availability strategy in Sault Ste. Marie.
- For July stays, consider implementing length-of-stay discounts or slightly higher rates for bookings made less than 80 days out to capitalize on advance planning.
- Target marketing efforts for the Summer season well in advance (at least 72 days) to capture early planners.
- Monitor your own booking lead times against these Sault Ste. Marie averages to identify opportunities for dynamic pricing adjustments.
Popular & Essential Airbnb Amenities in Sault Ste. Marie (2025)
Amenity Prevalence
Amenity Insights for Sault Ste. Marie
- Essential amenities in Sault Ste. Marie that guests expect include: Wifi, Hot water, Heating, Smoke alarm. Lacking these (any) could significantly impact bookings.
- Popular amenities like Kitchen, Essentials, TV are common but not universal. Offering these can provide a competitive edge.
Recommendations for Hosts
- Ensure your listing includes all essential amenities for Sault Ste. Marie: Wifi, Hot water, Heating, Smoke alarm.
- Prioritize adding missing essentials: Wifi, Hot water, Heating, Smoke alarm.
- Consider adding popular differentiators like Kitchen or Essentials to increase appeal.
- Highlight unique or less common amenities you offer (e.g., hot tub, dedicated workspace, EV charger) in your listing description and photos.
- Regularly check competitor amenities in Sault Ste. Marie to stay competitive.
Sault Ste. Marie Airbnb Guest Demographics & Profile Analysis (2025)
Guest Profile Summary for Sault Ste. Marie
- The typical guest profile for Airbnb in Sault Ste. Marie consists of primarily domestic travelers (97%), often arriving from nearby Grand Rapids, typically belonging to the Post-2000s (Gen Z/Alpha) group (50%), primarily speaking English or Spanish.
- Domestic travelers account for 97.3% of guests.
- Key international markets include United States (97.3%) and Canada (1.4%).
- Top languages spoken are English (89.3%) followed by Spanish (5.8%).
- A significant demographic segment is the Post-2000s (Gen Z/Alpha) group, representing 50% of guests.
Recommendations for Hosts
- Target domestic marketing efforts towards travelers from Grand Rapids and Traverse City.
- Tailor amenities and listing descriptions to appeal to the dominant Post-2000s (Gen Z/Alpha) demographic (e.g., highlight fast WiFi, smart home features, local guides).
- Highlight unique local experiences or amenities relevant to the primary guest profile.
- Consider seasonal promotions aligned with peak travel times for key origin markets.
Nearby Short-Term Rental Market Comparison
How does the Sault Ste. Marie Airbnb market stack up against its neighbors? Compare key performance metrics like average monthly revenue, ADR, and occupancy rates in surrounding areas to understand the broader regional STR landscape.
| Market | Active Properties | Monthly Revenue | Daily Rate | Avg. Occupancy |
|---|---|---|---|---|
| Friendship Township | 14 | $5,118 | $376.04 | 59% |
| Bay Township | 10 | $4,782 | $550.14 | 44% |
| Livingston Township | 11 | $4,649 | $293.80 | 53% |
| Leelanau Township | 50 | $4,620 | $377.36 | 50% |
| Leland Township | 40 | $4,579 | $568.06 | 37% |
| Walloon Lake | 25 | $4,534 | $401.80 | 44% |
| Beaugrand Township | 16 | $4,296 | $321.54 | 60% |
| Maple River Township | 10 | $4,137 | $332.91 | 45% |
| Charlevoix Township | 29 | $4,067 | $441.77 | 45% |
| West Traverse Township | 36 | $3,878 | $434.63 | 45% |