Marenisco Township Airbnb Market Analysis 2025: Short Term Rental Data & Vacation Rental Statistics in Michigan, United States
Is Airbnb profitable in Marenisco Township in 2025? Explore comprehensive Airbnb analytics for Marenisco Township, Michigan, United States to uncover income potential. This 2025 STR market report for Marenisco Township, based on AirROI data from April 2024 to March 2025, reveals key trends in the niche market of 17 active listings.
Whether you're considering an Airbnb investment in Marenisco Township, optimizing your existing vacation rental, or exploring rental arbitrage opportunities, understanding the Marenisco Township Airbnb data is crucial. Leveraging the low regulation environment is key to maximizing your short term rental income potential. Let's dive into the specifics.
Key Marenisco Township Airbnb Performance Metrics Overview
Monthly Airbnb Revenue Variations & Income Potential in Marenisco Township (2025)
Understanding the monthly revenue variations for Airbnb listings in Marenisco Township is key to maximizing your short term rental income potential. Seasonality significantly impacts earnings. Our analysis, based on data from the past 12 months, shows that the peak revenue month for STRs in Marenisco Township is typically July, while April often presents the lowest earnings, highlighting opportunities for strategic pricing adjustments during shoulder and low seasons. Explore the typical Airbnb income in Marenisco Township across different performance tiers:
- Best-in-class properties (Top 10%) achieve $6,387+ monthly, often utilizing dynamic pricing and superior guest experiences.
- Strong performing properties (Top 25%) earn $4,232 or more, indicating effective management and desirable locations/amenities.
- Typical properties (Median) generate around $2,748 per month, representing the average market performance.
- Entry-level properties (Bottom 25%) see earnings around $1,694, often with potential for optimization.
Average Monthly Airbnb Earnings Trend in Marenisco Township
Marenisco Township Airbnb Occupancy Rate Trends (2025)
Maximize your bookings by understanding the Marenisco Township STR occupancy trends. Seasonal demand shifts significantly influence how often properties are booked. Typically, Februarysees the highest demand (peak season occupancy), while November experiences the lowest (low season). Effective strategies, like adjusting minimum stays or offering promotions, can boost occupancy during slower periods. Here's how different property tiers perform in Marenisco Township:
- Best-in-class properties (Top 10%) achieve 58%+ occupancy, indicating high desirability and potentially optimized availability.
- Strong performing properties (Top 25%) maintain 50% or higher occupancy, suggesting good market fit and guest satisfaction.
- Typical properties (Median) have an occupancy rate around 37%.
- Entry-level properties (Bottom 25%) average 28% occupancy, potentially facing higher vacancy.
Average Monthly Occupancy Rate Trend in Marenisco Township
Average Daily Rate (ADR) Airbnb Trends in Marenisco Township (2025)
Effective short term rental pricing strategy in Marenisco Township involves understanding monthly ADR fluctuations. The Average Daily Rate (ADR) for Airbnb in Marenisco Township typically peaks in January and dips lowest during April. Leveraging Airbnb dynamic pricing tools or strategies based on this seasonality can significantly boost revenue. Here's a look at the typical nightly rates achieved:
- Best-in-class properties (Top 10%) command rates of $362+ per night, often due to premium features or locations.
- Strong performing properties (Top 25%) achieve nightly rates of $304 or more.
- Typical properties (Median) charge around $221 per night.
- Entry-level properties (Bottom 25%) earn around $162 per night.
Average Daily Rate (ADR) Trend by Month in Marenisco Township
Get Live Marenisco Township Market Intelligence 👇

Explore Real-time Analytics
Airbnb Seasonality Analysis & Trends in Marenisco Township (2025)
Peak Season (July, August, February)
- Revenue averages $5,776 per month
- Occupancy rates average 68.9%
- Daily rates average $244
Shoulder Season
- Revenue averages $2,796 per month
- Occupancy maintains around 33.7%
- Daily rates hold near $242
Low Season (March, April, November)
- Revenue drops to average $1,507 per month
- Occupancy decreases to average 20.3%
- Daily rates adjust to average $245
Seasonality Insights for Marenisco Township
- The Airbnb seasonality in Marenisco Township shows highly seasonal trends requiring careful strategy. While the sections above show seasonal averages, it's also insightful to look at the extremes:
- During the high season, the absolute peak month showcases Marenisco Township's highest earning potential, with monthly revenues capable of climbing to $6,432, occupancy reaching a high of 70.7%, and ADRs peaking at $271.
- Conversely, the slowest single month of the year, typically falling within the low season, marks the market's lowest point. In this month, revenue might dip to $1,349, occupancy could drop to 16.2%, and ADRs may adjust down to $223.
- Understanding both the seasonal averages and these monthly peaks and troughs in revenue, occupancy, and ADR is crucial for maximizing your Airbnb profit potential in Marenisco Township.
Seasonal Strategies for Maximizing Profit
- Peak Season: Maximize revenue through premium pricing and potentially longer minimum stays. Ensure high availability.
- Low Season: Offer competitive pricing, special promotions (e.g., extended stay discounts), and flexible cancellation policies. Target off-season travelers like remote workers or budget-conscious guests.
- Shoulder Seasons: Implement dynamic pricing that balances peak and low rates. Target weekend travelers or specific events. Offer slightly more flexible terms than peak season.
- Regularly analyze your own performance against these Marenisco Township seasonality benchmarks and adjust your pricing and availability strategy accordingly.
Best Areas for Airbnb Investment in Marenisco Township (2025)
Exploring the top neighborhoods for short-term rentals in Marenisco Township? This section highlights key areas, outlining why they are attractive for hosts and guests, along with notable local attractions. Consider these locations based on your target guest profile and investment strategy.
| Neighborhood / Area | Why Host Here? (Target Guests & Appeal) | Key Attractions & Landmarks |
|---|---|---|
| Porcupine Mountains Wilderness State Park | A stunning natural area known for its rugged scenery, hiking trails, and beautiful waterfalls. A great location for nature lovers and those seeking outdoor adventures. | Mirror Lake, Presque Isle River, Lake of the Clouds, Mount Hogan, Porcupine Mountains Ski Area |
| Lake Gogebic | The largest lake in Michigan's Upper Peninsula, popular for fishing, boating, and swimming. Offers a peaceful retreat for families and outdoor enthusiasts. | Lake Gogebic State Park, Fishing and boating opportunities, Beaches, Hiking trails, Wildlife watching |
| Black River Harbor | A scenic harbor known for its alluring views, hiking trails, and proximity to the Black River Scenic Byway. Attracts visitors looking for a quiet escape and natural beauty. | Black River Falls, Hiking trails, Scenic overlooks, Wildlife viewing, Fishing opportunities |
| Ironwood | A charming small town with access to various outdoor activities and a rich historical background. Ideal for travelers looking for a quaint stay with local charm. | Copper Peak, Ironwood Area Historical Society, Local shops and restaurants, Biking and hiking trails, Skiing in winter months |
| Ontonagon | A historic village offering beautiful views of the Ontonagon River and Lake Superior. Perfect for history buffs and those wanting a relaxed atmosphere near water activities. | Ontonagon Lighthouse, Porcupine Mountains nearby, Historic downtown, Hiking and biking trails, Fishing spots |
| Bessemer | A small city known for its skiing opportunities and outdoor recreational activities, great for winter sports enthusiasts and summer hikers alike. | Indianhead Mountain Resort, Big Powderhorn Mountain, Local dining options, Snowmobiling and ATV trails, Hiking trails |
| Marenisco | A quiet township that serves as a base for exploring nearby natural attractions. Ideal for travelers seeking solitude and close proximity to nature activities. | Nearby hiking trails, Access to local lakes, Wildlife observation, Quaint local shops, Scenic drives |
| Copper Harbor | A little further afield, this area is famous for its stunning landscapes and outdoor activities. A must-see for enthusiasts of adventure and nature. | Keweenaw National Historical Park, Hiking and mountain biking trails, Beautiful vistas and scenic overlooks, Historic landmarks, Fishing spots |
Understanding Airbnb License Requirements & STR Laws in Marenisco Township (2025)
While Marenisco Township, Michigan, United States currently shows low STR regulations, specific Airbnb license requirements might still exist or change. Always verify the latest short term rental regulations and Airbnb license requirements directly with local government authorities for Marenisco Township to ensure full compliance before hosting.
(Source: AirROI data, 2025, finding no licensed listings among those analyzed)
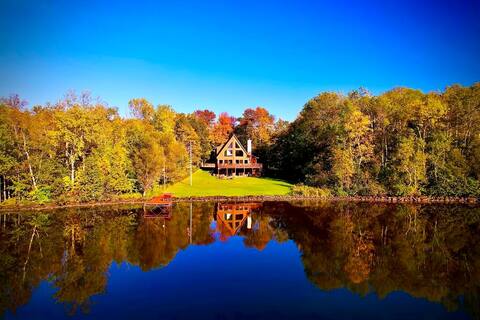
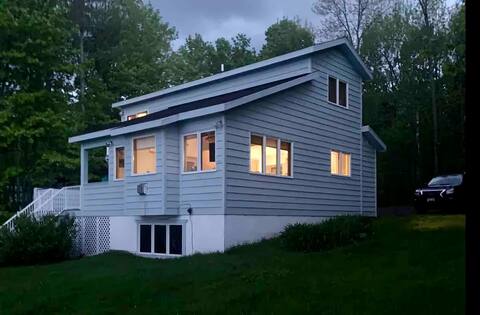
Top Performing Airbnb Properties in Marenisco Township (2025)
Benchmark your potential! Explore examples of top-performing Airbnb properties in Marenisco Townshipbased on Trailing Twelve Month (TTM) revenue. Analyze their characteristics, revenue, occupancy rate, and ADR to understand what drives success in this market.
Elk House Hideaway on Lake Gogebic~Hot Tub & Sauna
Entire Place • 5 bedrooms

Gorgeous Lake Gogebic Home
Entire Place • 3 bedrooms
Teal Wing - Premier Lake Gogebic Vacation Home
Entire Place • 4 bedrooms
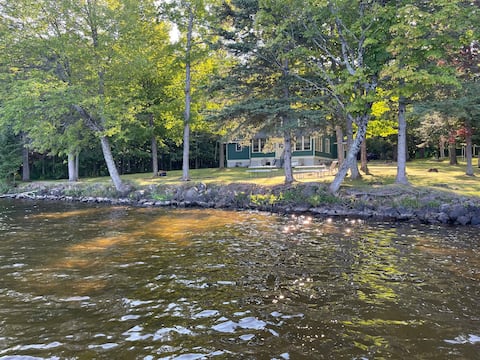
400 feet of private frontage on Lake Gogebic
Entire Place • 4 bedrooms
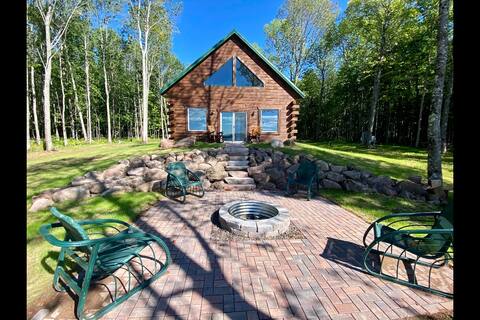
Beautiful New Log Cabin on Lake Gogebic.
Entire Place • 3 bedrooms
Boondockers Cabin on the Lake
Entire Place • 3 bedrooms
Note: Performance varies based on location, size, amenities, seasonality, and management quality. Data reflects the past 12 months.
Top Performing Airbnb Hosts in Marenisco Township (2025)
Learn from the best! This table showcases top-performing Airbnb hosts in Marenisco Township based on the number of properties managed and estimated total revenue over the past year. Analyze their scale and performance metrics.
| Host Name | Properties | Grossing Revenue | Stay Reviews | Avg Rating |
|---|---|---|---|---|
| Helena | 1 | $79,095 | 43 | 4.98/5.0 |
| Frank And Adriana | 1 | $54,108 | 125 | 4.93/5.0 |
| Daniel | 1 | $53,996 | 35 | 5.00/5.0 |
| Holly | 1 | $48,713 | 29 | 4.97/5.0 |
| Dan | 2 | $48,437 | 226 | 4.84/5.0 |
| Chad | 1 | $42,266 | 55 | 4.96/5.0 |
| Lee | 1 | $37,936 | 11 | 4.82/5.0 |
| Lynn | 1 | $35,263 | 37 | 4.81/5.0 |
| Wayne | 1 | $33,987 | 9 | 4.89/5.0 |
| Rick & Rina | 1 | $31,720 | 19 | 4.79/5.0 |
Analyzing the strategies of top hosts, such as their property selection, pricing, and guest communication, can offer valuable lessons for optimizing your own Airbnb operations in Marenisco Township.
Dive Deeper: Advanced Marenisco Township STR Market Data (2025)
Ready to unlock more insights? AirROI provides access to advanced metrics and comprehensive Airbnb data for Marenisco Township. Explore detailed analytics beyond this report to refine your investment strategy, optimize pricing, and maximize your vacation rental profits.
Explore Advanced MetricsMarenisco Township Short-Term Rental Market Composition (2025): Property & Room Types
Room Type Distribution
Property Type Distribution
Market Composition Insights for Marenisco Township
- The Marenisco Township Airbnb market composition is heavily skewed towards Entire Home/Apt listings, which make up 94.1% of the 17 active rentals. This indicates strong guest preference for privacy and space.
- Looking at the property type distribution in Marenisco Township, House properties are the most common (64.7%), reflecting the local real estate landscape.
- Houses represent a significant 64.7% portion, catering likely to families or larger groups.
Marenisco Township Airbnb Room Capacity Analysis (2025): Bedroom Distribution
Distribution of Listings by Number of Bedrooms
Room Capacity Insights for Marenisco Township
- The dominant room capacity in Marenisco Township is 3 bedrooms listings, making up 52.9% of the market. This suggests a strong demand for properties suitable for families or small groups.
- Together, 3 bedrooms and 4 bedrooms properties represent 70.5% of the active Airbnb listings in Marenisco Township, indicating a high concentration in these sizes.
- A significant 76.4% of listings offer 3+ bedrooms, catering to larger groups and families seeking more space in Marenisco Township.
Marenisco Township Vacation Rental Guest Capacity Trends (2025)
Distribution of Listings by Guest Capacity
Guest Capacity Insights for Marenisco Township
- The most common guest capacity trend in Marenisco Township vacation rentals is listings accommodating 8+ guests (70.6%). This suggests the primary traveler segment is likely larger groups.
- Properties designed for 8+ guests and 5 guests dominate the Marenisco Township STR market, accounting for 94.1% of listings.
- 70.6% of properties accommodate 6+ guests, serving the market segment for larger families or group travel in Marenisco Township.
- On average, properties in Marenisco Township are equipped to host 7.1 guests.
Marenisco Township Airbnb Booking Patterns (2025): Available vs. Booked Days
Available Days Distribution
Booked Days Distribution
Booking Pattern Insights for Marenisco Township
- The most common availability pattern in Marenisco Township falls within the 181-270 days range, representing 70.6% of listings. This suggests many properties have significant open periods on their calendars.
- Approximately 94.1% of listings show high availability (181+ days open annually), indicating potential for increased bookings or specific owner usage patterns.
- For booked days, the 91-180 days range is most frequent in Marenisco Township (70.6%), reflecting common guest stay durations or potential owner blocking patterns.
- A notable 5.9% of properties secure long booking periods (181+ days booked per year), highlighting successful long-term rental strategies or significant owner usage.
Marenisco Township Airbnb Minimum Stay Requirements Analysis
Distribution of Listings by Minimum Night Requirement
1 Night
1 listings
6.3% of total
2 Nights
4 listings
25% of total
3 Nights
6 listings
37.5% of total
4-6 Nights
1 listings
6.3% of total
30+ Nights
4 listings
25% of total
Key Insights
- The most prevalent minimum stay requirement in Marenisco Township is 3 Nights, adopted by 37.5% of listings. This highlights the market's preference for longer commitments.
- A significant segment (25%) caters to monthly stays (30+ nights) in Marenisco Township, pointing to opportunities in the extended-stay market.
Recommendations
- Align with the market by considering a 3 Nights minimum stay, as 37.5% of Marenisco Township hosts use this setting.
- If feasible, allowing 1-night stays, especially midweek or during low season, could capture last-minute bookings, as only 6.3% currently do.
- Explore offering discounts for stays of 30+ nights to attract the 25% of the market seeking extended stays.
- Adjust minimum nights based on seasonality – potentially shorter during low season and longer during peak demand periods in Marenisco Township.
Marenisco Township Airbnb Cancellation Policy Trends Analysis (2025)
Flexible
2 listings
11.8% of total
Moderate
3 listings
17.6% of total
Firm
4 listings
23.5% of total
Strict
8 listings
47.1% of total
Cancellation Policy Insights for Marenisco Township
- The prevailing Airbnb cancellation policy trend in Marenisco Township is Strict, used by 47.1% of listings.
- A majority (70.6%) of hosts in Marenisco Township utilize Firm or Strict policies, indicating a market where hosts prioritize booking security.
Recommendations for Hosts
- Consider adopting a Strict policy to align with the 47.1% market standard in Marenisco Township.
- With 47.1% using Strict terms, this is a viable option in Marenisco Township, particularly for high-value properties or during peak demand periods.
- Regularly review your cancellation policy against competitors and market demand shifts in Marenisco Township.
Marenisco Township STR Booking Lead Time Analysis (2025)
Average Booking Lead Time by Month
Booking Lead Time Insights for Marenisco Township
- The overall average booking lead time for vacation rentals in Marenisco Township is 84 days.
- Guests book furthest in advance for stays during July (average 133 days), likely coinciding with peak travel demand or local events.
- The shortest booking windows occur for stays in December (average 56 days), indicating more last-minute travel plans during this time.
- Seasonally, Summer (120 days avg.) sees the longest lead times, while Winter (72 days avg.) has the shortest, reflecting typical travel planning cycles.
Recommendations for Hosts
- Use the overall average lead time (84 days) as a baseline for your pricing and availability strategy in Marenisco Township.
- For July stays, consider implementing length-of-stay discounts or slightly higher rates for bookings made less than 133 days out to capitalize on advance planning.
- Target marketing efforts for the Summer season well in advance (at least 120 days) to capture early planners.
- Monitor your own booking lead times against these Marenisco Township averages to identify opportunities for dynamic pricing adjustments.
Popular & Essential Airbnb Amenities in Marenisco Township (2025)
Amenity Prevalence
Amenity Insights for Marenisco Township
- Essential amenities in Marenisco Township that guests expect include: Hot water, Heating, TV, Wifi, Free parking on premises, Carbon monoxide alarm. Lacking these (any) could significantly impact bookings.
- Popular amenities like Lake access, Essentials, Coffee maker are common but not universal. Offering these can provide a competitive edge.
Recommendations for Hosts
- Ensure your listing includes all essential amenities for Marenisco Township: Hot water, Heating, TV, Wifi, Free parking on premises, Carbon monoxide alarm.
- Consider adding popular differentiators like Lake access or Essentials to increase appeal.
- Highlight unique or less common amenities you offer (e.g., hot tub, dedicated workspace, EV charger) in your listing description and photos.
- Regularly check competitor amenities in Marenisco Township to stay competitive.
Marenisco Township Airbnb Guest Demographics & Profile Analysis (2025)
Guest Profile Summary for Marenisco Township
- The typical guest profile for Airbnb in Marenisco Township consists of primarily domestic travelers (98%), often arriving from nearby Minneapolis, typically belonging to the Post-2000s (Gen Z/Alpha) group (50%), primarily speaking English or French.
- Domestic travelers account for 97.9% of guests.
- Key international markets include United States (97.9%) and France (1.1%).
- Top languages spoken are English (81.8%) followed by French (9.1%).
- A significant demographic segment is the Post-2000s (Gen Z/Alpha) group, representing 50% of guests.
Recommendations for Hosts
- Target domestic marketing efforts towards travelers from Minneapolis and Green Bay.
- Tailor amenities and listing descriptions to appeal to the dominant Post-2000s (Gen Z/Alpha) demographic (e.g., highlight fast WiFi, smart home features, local guides).
- Highlight unique local experiences or amenities relevant to the primary guest profile.
- Consider seasonal promotions aligned with peak travel times for key origin markets.
Nearby Short-Term Rental Market Comparison
How does the Marenisco Township Airbnb market stack up against its neighbors? Compare key performance metrics like average monthly revenue, ADR, and occupancy rates in surrounding areas to understand the broader regional STR landscape.
| Market | Active Properties | Monthly Revenue | Daily Rate | Avg. Occupancy |
|---|---|---|---|---|
| Lutsen | 12 | $5,430 | $386.14 | 47% |
| Tofte | 14 | $5,052 | $461.98 | 37% |
| Schroeder | 10 | $5,039 | $404.98 | 51% |
| Lutsen Township | 165 | $4,322 | $387.87 | 39% |
| West Cook | 111 | $4,243 | $335.89 | 47% |
| Tofte Township | 39 | $4,210 | $269.63 | 51% |
| Dollar Bay | 12 | $4,207 | $250.41 | 51% |
| Town of Townsend | 10 | $4,181 | $349.35 | 46% |
| Grand Marais | 56 | $3,881 | $272.95 | 50% |
| Republic Township | 12 | $3,644 | $347.58 | 44% |