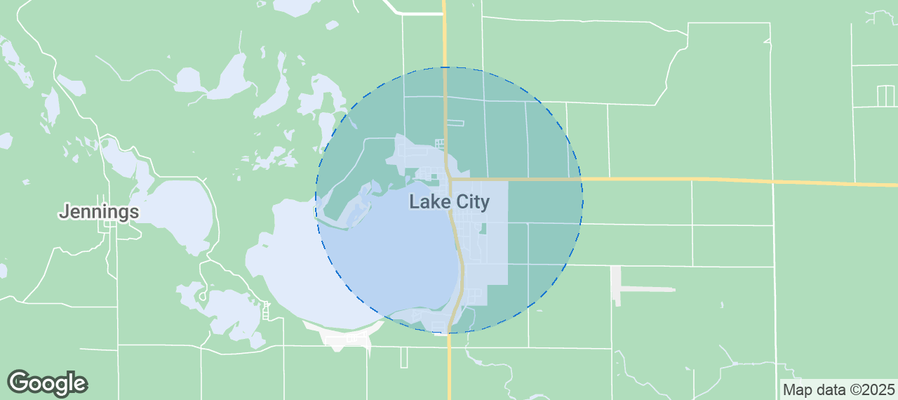
Lake City Airbnb Market Analysis 2025: Short Term Rental Data & Vacation Rental Statistics in Michigan, United States
Is Airbnb profitable in Lake City in 2025? Explore comprehensive Airbnb analytics for Lake City, Michigan, United States to uncover income potential. This 2025 STR market report for Lake City, based on AirROI data from June 2024 to May 2025, reveals key trends in the niche market of 22 active listings.
Whether you're considering an Airbnb investment in Lake City, optimizing your existing vacation rental, or exploring rental arbitrage opportunities, understanding the Lake City Airbnb data is crucial. Understanding the local regulations is key to maximizing your short term rental income potential. Let's dive into the specifics.
Key Lake City Airbnb Performance Metrics Overview
Monthly Airbnb Revenue Variations & Income Potential in Lake City (2025)
Understanding the monthly revenue variations for Airbnb listings in Lake City is key to maximizing your short term rental income potential. Seasonality significantly impacts earnings. Our analysis, based on data from the past 12 months, shows that the peak revenue month for STRs in Lake City is typically June, while March often presents the lowest earnings, highlighting opportunities for strategic pricing adjustments during shoulder and low seasons. Explore the typical Airbnb income in Lake City across different performance tiers:
- Best-in-class properties (Top 10%) achieve $3,596+ monthly, often utilizing dynamic pricing and superior guest experiences.
- Strong performing properties (Top 25%) earn $1,986 or more, indicating effective management and desirable locations/amenities.
- Typical properties (Median) generate around $1,109 per month, representing the average market performance.
- Entry-level properties (Bottom 25%) see earnings around $689, often with potential for optimization.
Average Monthly Airbnb Earnings Trend in Lake City
Lake City Airbnb Occupancy Rate Trends (2025)
Maximize your bookings by understanding the Lake City STR occupancy trends. Seasonal demand shifts significantly influence how often properties are booked. Typically, Junesees the highest demand (peak season occupancy), while March experiences the lowest (low season). Effective strategies, like adjusting minimum stays or offering promotions, can boost occupancy during slower periods. Here's how different property tiers perform in Lake City:
- Best-in-class properties (Top 10%) achieve 50%+ occupancy, indicating high desirability and potentially optimized availability.
- Strong performing properties (Top 25%) maintain 39% or higher occupancy, suggesting good market fit and guest satisfaction.
- Typical properties (Median) have an occupancy rate around 28%.
- Entry-level properties (Bottom 25%) average 17% occupancy, potentially facing higher vacancy.
Average Monthly Occupancy Rate Trend in Lake City
Average Daily Rate (ADR) Airbnb Trends in Lake City (2025)
Effective short term rental pricing strategy in Lake City involves understanding monthly ADR fluctuations. The Average Daily Rate (ADR) for Airbnb in Lake City typically peaks in May and dips lowest during December. Leveraging Airbnb dynamic pricing tools or strategies based on this seasonality can significantly boost revenue. Here's a look at the typical nightly rates achieved:
- Best-in-class properties (Top 10%) command rates of $259+ per night, often due to premium features or locations.
- Strong performing properties (Top 25%) achieve nightly rates of $158 or more.
- Typical properties (Median) charge around $133 per night.
- Entry-level properties (Bottom 25%) earn around $115 per night.
Average Daily Rate (ADR) Trend by Month in Lake City
Get Live Lake City Market Intelligence 👇
Explore Real-time Analytics
Airbnb Seasonality Analysis & Trends in Lake City (2025)
Peak Season (June, July, August)
- Revenue averages $3,353 per month
- Occupancy rates average 54.0%
- Daily rates average $168
Shoulder Season
- Revenue averages $1,163 per month
- Occupancy maintains around 25.7%
- Daily rates hold near $157
Low Season (January, March, December)
- Revenue drops to average $661 per month
- Occupancy decreases to average 14.4%
- Daily rates adjust to average $149
Seasonality Insights for Lake City
- The Airbnb seasonality in Lake City shows highly seasonal trends requiring careful strategy. While the sections above show seasonal averages, it's also insightful to look at the extremes:
- During the high season, the absolute peak month showcases Lake City's highest earning potential, with monthly revenues capable of climbing to $3,836, occupancy reaching a high of 60.0%, and ADRs peaking at $179.
- Conversely, the slowest single month of the year, typically falling within the low season, marks the market's lowest point. In this month, revenue might dip to $483, occupancy could drop to 11.2%, and ADRs may adjust down to $144.
- Understanding both the seasonal averages and these monthly peaks and troughs in revenue, occupancy, and ADR is crucial for maximizing your Airbnb profit potential in Lake City.
Seasonal Strategies for Maximizing Profit
- Peak Season: Maximize revenue through premium pricing and potentially longer minimum stays. Ensure high availability.
- Low Season: Offer competitive pricing, special promotions (e.g., extended stay discounts), and flexible cancellation policies. Target off-season travelers like remote workers or budget-conscious guests.
- Shoulder Seasons: Implement dynamic pricing that balances peak and low rates. Target weekend travelers or specific events. Offer slightly more flexible terms than peak season.
- Regularly analyze your own performance against these Lake City seasonality benchmarks and adjust your pricing and availability strategy accordingly.
Best Areas for Airbnb Investment in Lake City (2025)
Exploring the top neighborhoods for short-term rentals in Lake City? This section highlights key areas, outlining why they are attractive for hosts and guests, along with notable local attractions. Consider these locations based on your target guest profile and investment strategy.
| Neighborhood / Area | Why Host Here? (Target Guests & Appeal) | Key Attractions & Landmarks |
|---|---|---|
| Lake Michigan Shoreline | Beautiful waterfront views and access to numerous beaches, ideal for families and tourists looking for relaxation and recreation during the summer months. | Pere Marquette Park, Lake Michigan, Escape to the Lake, Lake City Marina, Fishing and Boating opportunities |
| Downtown Lake City | The heart of the city with quaint shops, dining, and local culture. Perfect for visitors wanting to be close to local events and amenities. | Lake County Historical Museum, Local Art Galleries, Cafes and Restaurants, Annual Festivals, Farmers Market |
| Big Rapids | Nearby town known for its beautiful parks and rivers, popular for fishing and hiking, wonderful for outdoor enthusiasts and nature lovers. | Ferris State University, Riverside Park, Big Rapids Dam, Big Rapids Riverwalk, Local breweries |
| Cadillac Lake Park | Close to Lake City with access to Cadillac Lake and the surrounding nature, offering various outdoor recreational activities. | Cadillac City Park, Lake Cadillac, Fishing and boating, Parks and trails, Picnic Areas |
| Houghton Lake | Located nearby and known as Michigan's largest lake, attracting a lot of tourism for boating and fishing. | Houghton Lake, Pine Lake, Marina Services, Local Restaurants, Recreational Activities |
| Manistee National Forest | An outdoor paradise with camping, hiking, and nature experiences, ideal for nature-loving guests. | Hiking Trails, Camping Sites, Wildlife Viewing, Waterfalls, Special Events |
| Crystal Lake | A serene and picturesque area great for summer vacations, offering a relaxing atmosphere and various water activities. | Crystal Lake State Park, Beaches, Kayaking and Swimming, Walking Trails, Local Shops |
| Traverse City | A vibrant city known for its wineries and beautiful scenery, perfect for visitors looking for a variety of activities and experiences. | Wine Tours, Sleeping Bear Dunes, Cherry Festival, Art Galleries, Beaches |
Understanding Airbnb License Requirements & STR Laws in Lake City (2025)
With 23% of listings showing registration in 2025, understanding potential Airbnb license requirements is crucial in Lake City. Always verify the latest short term rental regulations and Airbnb license requirements directly with local government authorities for Lake City to ensure full compliance before hosting.
(Source: AirROI data, 2025, based on 23% licensed listings)
Top Performing Airbnb Properties in Lake City (2025)
Benchmark your potential! Explore examples of top-performing Airbnb properties in Lake Citybased on Trailing Twelve Month (TTM) revenue. Analyze their characteristics, revenue, occupancy rate, and ADR to understand what drives success in this market.

Lake City Landings House
Entire Place • 2 bedrooms
Downtown Cottage with Lake Missaukee Frontage!
Entire Place • 4 bedrooms

Lake City Landings Unit 5
Entire Place • 4 bedrooms

4 bedroom 2 bath house a block from Lake Missaukee
Entire Place • 4 bedrooms
Lake City Landings Unit 2
Entire Place • 2 bedrooms

Lake City Landings Unit 1
Entire Place • 2 bedrooms
Note: Performance varies based on location, size, amenities, seasonality, and management quality. Data reflects the past 12 months.
Top Performing Airbnb Hosts in Lake City (2025)
Learn from the best! This table showcases top-performing Airbnb hosts in Lake City based on the number of properties managed and estimated total revenue over the past year. Analyze their scale and performance metrics.
| Host Name | Properties | Grossing Revenue | Stay Reviews | Avg Rating |
|---|---|---|---|---|
| Benjamin | 6 | $126,892 | 605 | 4.96/5.0 |
| Lizzie | 14 | $80,562 | 10 | 4.71/5.0 |
| Julene | 1 | $35,589 | 74 | 4.91/5.0 |
| Jordan | 1 | $23,290 | 7 | 5.00/5.0 |
Analyzing the strategies of top hosts, such as their property selection, pricing, and guest communication, can offer valuable lessons for optimizing your own Airbnb operations in Lake City.
Dive Deeper: Advanced Lake City STR Market Data (2025)
Ready to unlock more insights? AirROI provides access to advanced metrics and comprehensive Airbnb data for Lake City. Explore detailed analytics beyond this report to refine your investment strategy, optimize pricing, and maximize your vacation rental profits.
Explore Advanced MetricsLake City Short-Term Rental Market Composition (2025): Property & Room Types
Room Type Distribution
Property Type Distribution
Market Composition Insights for Lake City
- The Lake City Airbnb market composition is heavily skewed towards Entire Home/Apt listings, which make up 100% of the 22 active rentals. This indicates strong guest preference for privacy and space.
- Looking at the property type distribution in Lake City, Outdoor/Unique properties are the most common (54.5%), reflecting the local real estate landscape.
- Houses represent a significant 22.7% portion, catering likely to families or larger groups.
Lake City Airbnb Room Capacity Analysis (2025): Bedroom Distribution
Distribution of Listings by Number of Bedrooms
Room Capacity Insights for Lake City
- The dominant room capacity in Lake City is 2 bedrooms listings, making up 63.6% of the market. This suggests a strong demand for properties suitable for couples or solo travelers.
- Together, 2 bedrooms and 1 bedroom properties represent 77.2% of the active Airbnb listings in Lake City, indicating a high concentration in these sizes.
- A significant 22.7% of listings offer 3+ bedrooms, catering to larger groups and families seeking more space in Lake City.
Lake City Vacation Rental Guest Capacity Trends (2025)
Distribution of Listings by Guest Capacity
Guest Capacity Insights for Lake City
- The most common guest capacity trend in Lake City vacation rentals is listings accommodating 4 guests (45.5%). This suggests the primary traveler segment is likely small families or groups.
- Properties designed for 4 guests and 8+ guests dominate the Lake City STR market, accounting for 68.2% of listings.
- 36.3% of properties accommodate 6+ guests, serving the market segment for larger families or group travel in Lake City.
- On average, properties in Lake City are equipped to host 5.0 guests.
Lake City Airbnb Booking Patterns (2025): Available vs. Booked Days
Available Days Distribution
Booked Days Distribution
Booking Pattern Insights for Lake City
- The most common availability pattern in Lake City falls within the 271-366 days range, representing 68.2% of listings. This suggests many properties have significant open periods on their calendars.
- Approximately 95.5% of listings show high availability (181+ days open annually), indicating potential for increased bookings or specific owner usage patterns.
- For booked days, the 31-90 days range is most frequent in Lake City (50%), reflecting common guest stay durations or potential owner blocking patterns.
- A notable 4.5% of properties secure long booking periods (181+ days booked per year), highlighting successful long-term rental strategies or significant owner usage.
Lake City Airbnb Minimum Stay Requirements Analysis
Distribution of Listings by Minimum Night Requirement
1 Night
11 listings
50% of total
2 Nights
7 listings
31.8% of total
7-29 Nights
4 listings
18.2% of total
Key Insights
- The most prevalent minimum stay requirement in Lake City is 1 Night, adopted by 50% of listings. This highlights the market's preference for shorter, flexible bookings.
- A strong majority (81.8%) of the Lake City Airbnb data shows acceptance of very short stays (1-2 nights), indicating a dynamic, high-turnover market.
Recommendations
- Align with the market by considering a 1 Night minimum stay, as 50% of Lake City hosts use this setting.
- Adjust minimum nights based on seasonality – potentially shorter during low season and longer during peak demand periods in Lake City.
Lake City Airbnb Cancellation Policy Trends Analysis (2025)
Flexible
7 listings
50% of total
Firm
4 listings
28.6% of total
Strict
3 listings
21.4% of total
Cancellation Policy Insights for Lake City
- The prevailing Airbnb cancellation policy trend in Lake City is Flexible, used by 50% of listings.
- There's a relatively balanced mix between guest-friendly (50.0%) and stricter (50.0%) policies, offering choices for different guest needs.
Recommendations for Hosts
- Consider adopting a Flexible policy to align with the 50% market standard in Lake City.
- Regularly review your cancellation policy against competitors and market demand shifts in Lake City.
Lake City STR Booking Lead Time Analysis (2025)
Average Booking Lead Time by Month
Booking Lead Time Insights for Lake City
- The overall average booking lead time for vacation rentals in Lake City is 33 days.
- Guests book furthest in advance for stays during June (average 84 days), likely coinciding with peak travel demand or local events.
- The shortest booking windows occur for stays in April (average 20 days), indicating more last-minute travel plans during this time.
- Seasonally, Summer (66 days avg.) sees the longest lead times, while Winter (24 days avg.) has the shortest, reflecting typical travel planning cycles.
Recommendations for Hosts
- Use the overall average lead time (33 days) as a baseline for your pricing and availability strategy in Lake City.
- For June stays, consider implementing length-of-stay discounts or slightly higher rates for bookings made less than 84 days out to capitalize on advance planning.
- Target marketing efforts for the Summer season well in advance (at least 66 days) to capture early planners.
- Monitor your own booking lead times against these Lake City averages to identify opportunities for dynamic pricing adjustments.
Popular & Essential Airbnb Amenities in Lake City (2025)
Amenity Prevalence
No amenities with partial availability (less than 100%) were found to display in the chart. All essential amenities might be present in all listings. Check insights below.
Amenity Insights for Lake City
- Essential amenities in Lake City that guests expect include: Coffee maker, Wifi, Hot water, Kitchen, Free parking on premises, Microwave, Dishes and silverware, Fire extinguisher, Fire pit, TV. Lacking these (any) could significantly impact bookings.
Recommendations for Hosts
- Ensure your listing includes all essential amenities for Lake City: Coffee maker, Wifi, Hot water, Kitchen, Free parking on premises, Microwave, Dishes and silverware, Fire extinguisher, Fire pit, TV.
- Highlight unique or less common amenities you offer (e.g., hot tub, dedicated workspace, EV charger) in your listing description and photos.
- Regularly check competitor amenities in Lake City to stay competitive.
Lake City Airbnb Guest Demographics & Profile Analysis (2025)
Guest Profile Summary for Lake City
- The typical guest profile for Airbnb in Lake City consists of primarily domestic travelers (98%), often arriving from nearby Phoenix, typically belonging to the Post-2000s (Gen Z/Alpha) group (50%), primarily speaking English or Spanish.
- Domestic travelers account for 97.7% of guests.
- Key international markets include United States (97.7%) and Canada (1.2%).
- Top languages spoken are English (82.4%) followed by Spanish (5.9%).
- A significant demographic segment is the Post-2000s (Gen Z/Alpha) group, representing 50% of guests.
Recommendations for Hosts
- Target domestic marketing efforts towards travelers from Phoenix and Holland.
- Tailor amenities and listing descriptions to appeal to the dominant Post-2000s (Gen Z/Alpha) demographic (e.g., highlight fast WiFi, smart home features, local guides).
- Highlight unique local experiences or amenities relevant to the primary guest profile.
- Consider seasonal promotions aligned with peak travel times for key origin markets.
Nearby Short-Term Rental Market Comparison
How does the Lake City Airbnb market stack up against its neighbors? Compare key performance metrics like average monthly revenue, ADR, and occupancy rates in surrounding areas to understand the broader regional STR landscape.
| Market | Active Properties | Monthly Revenue | Daily Rate | Avg. Occupancy |
|---|---|---|---|---|
| Friendship Township | 12 | $4,999 | $404.96 | 54% |
| Greilickville | 39 | $4,882 | $481.10 | 45% |
| Bay Township | 10 | $4,484 | $545.88 | 43% |
| Blair Township | 52 | $4,414 | $459.88 | 43% |
| Livingston Township | 11 | $4,176 | $306.59 | 52% |
| Bingham Township | 27 | $4,140 | $521.70 | 45% |
| Walloon Lake | 25 | $4,066 | $413.43 | 41% |
| West Traverse Township | 31 | $3,925 | $461.96 | 42% |
| Grattan Township | 17 | $3,859 | $301.69 | 55% |
| Leelanau Township | 52 | $3,724 | $381.85 | 50% |