Williamstown Airbnb Market Analysis 2026: Short Term Rental Data & Vacation Rental Statistics in Massachusetts, United States
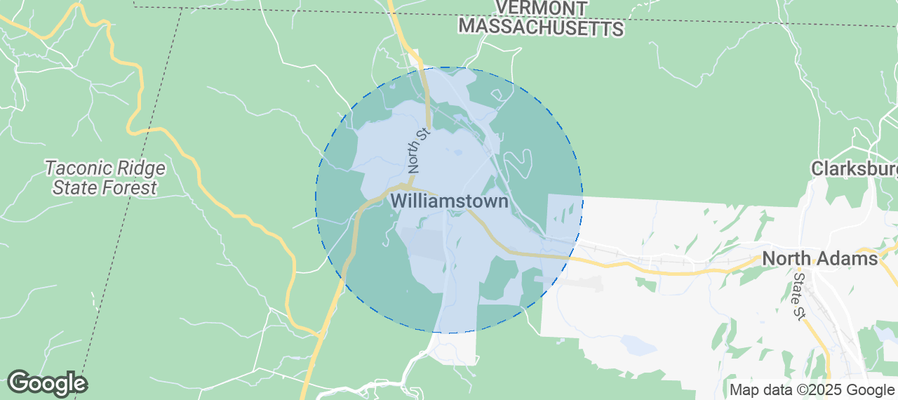
Is Airbnb profitable in Williamstown in 2026? Explore comprehensive Airbnb analytics for Williamstown, Massachusetts, United States to uncover income potential. This 2026 STR market report for Williamstown, based on AirROI data from February 2025 to January 2026, reveals key trends in the niche market of 85 active listings.
Whether you're considering an Airbnb investment in Williamstown, optimizing your existing vacation rental, or exploring rental arbitrage opportunities, understanding the Williamstown Airbnb data is crucial. Leveraging the low regulation environment is key to maximizing your short term rental income potential. Let's dive into the specifics.
Key Williamstown Airbnb Performance Metrics Overview
Monthly Airbnb Revenue Variations & Income Potential in Williamstown (2026)
Understanding the monthly revenue variations for Airbnb listings in Williamstown is key to maximizing your short term rental income potential. Seasonality significantly impacts earnings. Our analysis, based on data from the past 12 months, shows that the peak revenue month for STRs in Williamstown is typically May, while March often presents the lowest earnings, highlighting opportunities for strategic pricing adjustments during shoulder and low seasons. Explore the typical Airbnb income in Williamstown across different performance tiers:
- Best-in-class properties (Top 10%) achieve $10,166+ monthly, often utilizing dynamic pricing and superior guest experiences.
- Strong performing properties (Top 25%) earn $5,978 or more, indicating effective management and desirable locations/amenities.
- Typical properties (Median) generate around $3,336 per month, representing the average market performance.
- Entry-level properties (Bottom 25%) see earnings around $1,796, often with potential for optimization.
Average Monthly Airbnb Earnings Trend in Williamstown
Williamstown Airbnb Occupancy Rate Trends (2026)
Maximize your bookings by understanding the Williamstown STR occupancy trends. Seasonal demand shifts significantly influence how often properties are booked. Typically, Augustsees the highest demand (peak season occupancy), while January experiences the lowest (low season). Effective strategies, like adjusting minimum stays or offering promotions, can boost occupancy during slower periods. Here's how different property tiers perform in Williamstown:
- Best-in-class properties (Top 10%) achieve 73%+ occupancy, indicating high desirability and potentially optimized availability.
- Strong performing properties (Top 25%) maintain 60% or higher occupancy, suggesting good market fit and guest satisfaction.
- Typical properties (Median) have an occupancy rate around 41%.
- Entry-level properties (Bottom 25%) average 24% occupancy, potentially facing higher vacancy.
Average Monthly Occupancy Rate Trend in Williamstown
Average Daily Rate (ADR) Airbnb Trends in Williamstown (2026)
Effective short term rental pricing strategy in Williamstown involves understanding monthly ADR fluctuations. The Average Daily Rate (ADR) for Airbnb in Williamstown typically peaks in September and dips lowest during March. Leveraging Airbnb dynamic pricing tools or strategies based on this seasonality can significantly boost revenue. Here's a look at the typical nightly rates achieved:
- Best-in-class properties (Top 10%) command rates of $893+ per night, often due to premium features or locations.
- Strong performing properties (Top 25%) achieve nightly rates of $454 or more.
- Typical properties (Median) charge around $276 per night.
- Entry-level properties (Bottom 25%) earn around $178 per night.
Average Daily Rate (ADR) Trend by Month in Williamstown
Get Live Williamstown Market Intelligence 👇
Explore Real-time Analytics
Airbnb Seasonality Analysis & Trends in Williamstown (2026)
Peak Season (May, June, July)
- Revenue averages $6,922 per month
- Occupancy rates average 48.7%
- Daily rates average $398
Shoulder Season
- Revenue averages $4,377 per month
- Occupancy maintains around 42.5%
- Daily rates hold near $424
Low Season (February, March, April)
- Revenue drops to average $2,938 per month
- Occupancy decreases to average 36.2%
- Daily rates adjust to average $378
Seasonality Insights for Williamstown
- The Airbnb seasonality in Williamstown shows highly seasonal trends requiring careful strategy. While the sections above show seasonal averages, it's also insightful to look at the extremes:
- During the high season, the absolute peak month showcases Williamstown's highest earning potential, with monthly revenues capable of climbing to $7,727, occupancy reaching a high of 57.9%, and ADRs peaking at $433.
- Conversely, the slowest single month of the year, typically falling within the low season, marks the market's lowest point. In this month, revenue might dip to $2,773, occupancy could drop to 27.9%, and ADRs may adjust down to $376.
- Understanding both the seasonal averages and these monthly peaks and troughs in revenue, occupancy, and ADR is crucial for maximizing your Airbnb profit potential in Williamstown.
Seasonal Strategies for Maximizing Profit
- Peak Season: Maximize revenue through premium pricing and potentially longer minimum stays. Ensure high availability.
- Low Season: Offer competitive pricing, special promotions (e.g., extended stay discounts), and flexible cancellation policies. Target off-season travelers like remote workers or budget-conscious guests.
- Shoulder Seasons: Implement dynamic pricing that balances peak and low rates. Target weekend travelers or specific events. Offer slightly more flexible terms than peak season.
- Regularly analyze your own performance against these Williamstown seasonality benchmarks and adjust your pricing and availability strategy accordingly.
Best Areas for Airbnb Investment in Williamstown (2026)
Exploring the top neighborhoods for short-term rentals in Williamstown? This section highlights key areas, outlining why they are attractive for hosts and guests, along with notable local attractions. Consider these locations based on your target guest profile and investment strategy.
| Neighborhood / Area | Why Host Here? (Target Guests & Appeal) | Key Attractions & Landmarks |
|---|---|---|
| Williams College | Renowned liberal arts college that attracts students, parents, and academics year-round. A great location for visitors involved in college events and visits. | Williams College Museum of Art, Clark Art Institute, Chapin Library, The Sawtell House, Lasell Gymnasium |
| Greylock Mountain | A beautiful natural area that offers hiking, skiing, and stunning views. Perfect for nature lovers and outdoor enthusiasts. | Mount Greylock State Reservation, Greylock Summit, Thompson Memorial Theater, Appalachian Trail, Waterfall on Jones Nose |
| Williamstown Theater Festival | A center for performing arts that attracts theater enthusiasts during summer months. Ideal for visitors seeking cultural arts experiences. | Theater Festival performances, Local dining options, Workshops and classes, Historic sites, Williamstown Museum |
| The Sterling and Francine Clark Art Institute | A significant art museum that attracts art lovers and tourists interested in culture and history. | Impressionist and American paintings, Beautiful park grounds, Art exhibitions, Educational programs, Museum shop |
| Natural Bridge State Park | A unique geological wonder and a great spot for family outings and nature walks, attracting those interested in outdoor activities. | Natural Bridge, Hiking trails, Picnic areas, Scenic views, Historic remnants |
| Taconic Golf Club | An exclusive golf club that attracts golfing enthusiasts and those looking for leisure activities in a scenic setting. | 18-hole golf course, Clubhouse amenities, Golf tournaments, Scenic views, Networking events |
| Local Restaurants and Breweries | Keen for those who enjoy local cuisine and craft beers, making it an attractive spot for foodies and families. | Haven Cafe and Bakery, The Williams Inn, Goodman's Restaurant, The Distillery, Big Elm Brewing |
| Sterling and Francine Clark Art Institute Grounds | The picturesque grounds are perfect for leisurely strolls and community events, attracting those looking for peaceful retreats. | Walking paths, Gardens, Outdoor art installations, Events and workshops, Scenic picnics |
Understanding Airbnb License Requirements & STR Laws in Williamstown (2026)
While Williamstown, Massachusetts, United States currently shows low STR regulations, specific Airbnb license requirements might still exist or change. Always verify the latest short term rental regulations and Airbnb license requirements directly with local government authorities for Williamstown to ensure full compliance before hosting.
(Source: AirROI data, 2026, finding no licensed listings among those analyzed)
Top Performing Airbnb Properties in Williamstown (2026)
Benchmark your potential! Explore examples of top-performing Airbnb properties in Williamstownbased on Trailing Twelve Month (TTM) revenue. Analyze their characteristics, revenue, occupancy rate, and ADR to understand what drives success in this market.

Berkshire Family Home
Entire Place • 4 bedrooms
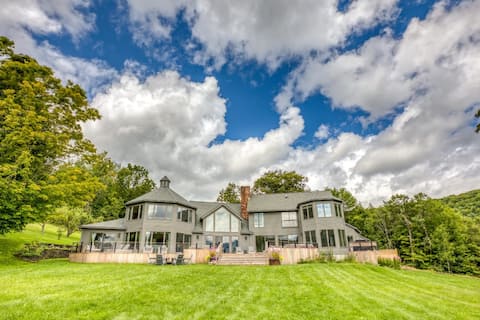
The Brookman: Renovated 6000 SF Estate On 40 Acres
Entire Place • 7 bedrooms
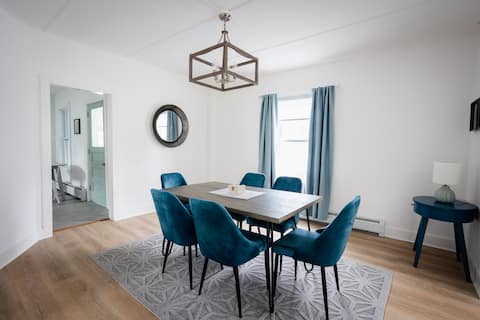
In-Town: A Stylish, Bright & Fully Stocked Retreat
Entire Place • 5 bedrooms
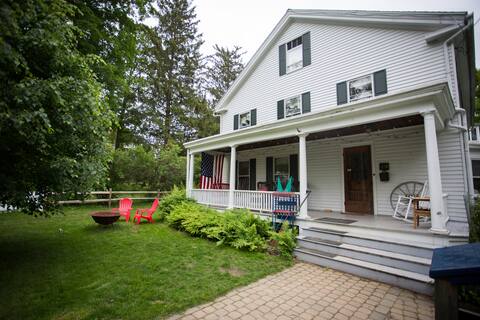
In-Town Family Home - New England Colonial
Entire Place • 4 bedrooms

Unforgettable Winter Gem • w/HotTub • Near Jiminy!
Entire Place • 6 bedrooms

In-Town Victorian with 5 Bedrooms
Entire Place • 5 bedrooms
Note: Performance varies based on location, size, amenities, seasonality, and management quality. Data reflects the past 12 months.
Top Performing Airbnb Hosts in Williamstown (2026)
Learn from the best! This table showcases top-performing Airbnb hosts in Williamstown based on the number of properties managed and estimated total revenue over the past year. Analyze their scale and performance metrics.
| Host Name | Properties | Grossing Revenue | Stay Reviews | Avg Rating |
|---|---|---|---|---|
| Dalit | 4 | $345,272 | 151 | 5.00/5.0 |
| Lucas | 4 | $297,462 | 85 | 4.82/5.0 |
| Noelle | 1 | $142,895 | 5 | 5.00/5.0 |
| William | 3 | $129,602 | 832 | 4.97/5.0 |
| Ashley | 1 | $123,448 | 8 | 5.00/5.0 |
| Doreen | 1 | $119,515 | 17 | 5.00/5.0 |
| Evolve | 3 | $105,948 | 86 | 4.86/5.0 |
| Briee | 2 | $103,854 | 80 | 4.97/5.0 |
| Owen | 1 | $102,734 | 10 | 4.90/5.0 |
| Jane | 1 | $96,342 | 37 | 5.00/5.0 |
Analyzing the strategies of top hosts, such as their property selection, pricing, and guest communication, can offer valuable lessons for optimizing your own Airbnb operations in Williamstown.
Dive Deeper: Advanced Williamstown STR Market Data (2026)
Ready to unlock more insights? AirROI provides access to advanced metrics and comprehensive Airbnb data for Williamstown. Explore detailed analytics beyond this report to refine your investment strategy, optimize pricing, and maximize your vacation rental profits.
Explore Advanced MetricsWilliamstown Short-Term Rental Market Composition (2026): Property & Room Types
Room Type Distribution
Property Type Distribution
Market Composition Insights for Williamstown
- The Williamstown Airbnb market composition is heavily skewed towards Entire Home/Apt listings, which make up 85.9% of the 85 active rentals. This indicates strong guest preference for privacy and space.
- Looking at the property type distribution in Williamstown, House properties are the most common (68.2%), reflecting the local real estate landscape.
- Houses represent a significant 68.2% portion, catering likely to families or larger groups.
- The presence of 5.9% Hotel/Boutique listings indicates integration with traditional hospitality.
- Smaller segments like unique stays, others, outdoor/unique (combined 6.0%) offer potential for unique stay experiences.
Williamstown Airbnb Room Capacity Analysis (2026): Bedroom Distribution
Distribution of Listings by Number of Bedrooms
Room Capacity Insights for Williamstown
- The dominant room capacity in Williamstown is 3 bedrooms listings, making up 29.4% of the market. This suggests a strong demand for properties suitable for families or small groups.
- Together, 3 bedrooms and 1 bedroom properties represent 47.0% of the active Airbnb listings in Williamstown, indicating a high concentration in these sizes.
- A significant 54.1% of listings offer 3+ bedrooms, catering to larger groups and families seeking more space in Williamstown.
Williamstown Vacation Rental Guest Capacity Trends (2026)
Distribution of Listings by Guest Capacity
Guest Capacity Insights for Williamstown
- The most common guest capacity trend in Williamstown vacation rentals is listings accommodating 8+ guests (24.7%). This suggests the primary traveler segment is likely larger groups.
- Properties designed for 8+ guests and 6 guests dominate the Williamstown STR market, accounting for 41.2% of listings.
- 44.7% of properties accommodate 6+ guests, serving the market segment for larger families or group travel in Williamstown.
- On average, properties in Williamstown are equipped to host 4.8 guests.
Williamstown Airbnb Booking Patterns (2026): Available vs. Booked Days
Available Days Distribution
Booked Days Distribution
Booking Pattern Insights for Williamstown
- The most common availability pattern in Williamstown falls within the 181-270 days range, representing 42.4% of listings. This suggests many properties have significant open periods on their calendars.
- Approximately 78.9% of listings show high availability (181+ days open annually), indicating potential for increased bookings or specific owner usage patterns.
- For booked days, the 91-180 days range is most frequent in Williamstown (45.9%), reflecting common guest stay durations or potential owner blocking patterns.
- A notable 21.2% of properties secure long booking periods (181+ days booked per year), highlighting successful long-term rental strategies or significant owner usage.
Williamstown Airbnb Minimum Stay Requirements Analysis
Distribution of Listings by Minimum Night Requirement
1 Night
14 listings
16.5% of total
2 Nights
28 listings
32.9% of total
3 Nights
8 listings
9.4% of total
7-29 Nights
3 listings
3.5% of total
30+ Nights
32 listings
37.6% of total
Key Insights
- The most prevalent minimum stay requirement in Williamstown is 30+ Nights, adopted by 37.6% of listings. This highlights the market's preference for longer commitments.
- A significant segment (37.6%) caters to monthly stays (30+ nights) in Williamstown, pointing to opportunities in the extended-stay market.
Recommendations
- Align with the market by considering a 30+ Nights minimum stay, as 37.6% of Williamstown hosts use this setting.
- If feasible, allowing 1-night stays, especially midweek or during low season, could capture last-minute bookings, as only 16.5% currently do.
- A 2-night minimum appears standard (32.9%). Consider this for weekends or peak periods.
- Explore offering discounts for stays of 30+ nights to attract the 37.6% of the market seeking extended stays.
- Adjust minimum nights based on seasonality – potentially shorter during low season and longer during peak demand periods in Williamstown.
Williamstown Airbnb Cancellation Policy Trends Analysis (2026)
Super Strict 60 Days
1 listings
1.2% of total
Limited
1 listings
1.2% of total
Super Strict 30 Days
1 listings
1.2% of total
Flexible
8 listings
9.4% of total
Moderate
25 listings
29.4% of total
Firm
32 listings
37.6% of total
Strict
17 listings
20% of total
Cancellation Policy Insights for Williamstown
- The prevailing Airbnb cancellation policy trend in Williamstown is Firm, used by 37.6% of listings.
- A majority (57.6%) of hosts in Williamstown utilize Firm or Strict policies, indicating a market where hosts prioritize booking security.
Recommendations for Hosts
- Consider adopting a Firm policy to align with the 37.6% market standard in Williamstown.
- Regularly review your cancellation policy against competitors and market demand shifts in Williamstown.
Williamstown STR Booking Lead Time Analysis (2026)
Average Booking Lead Time by Month
Booking Lead Time Insights for Williamstown
- The overall average booking lead time for vacation rentals in Williamstown is 74 days.
- Guests book furthest in advance for stays during June (average 135 days), likely coinciding with peak travel demand or local events.
- The shortest booking windows occur for stays in March (average 27 days), indicating more last-minute travel plans during this time.
- Seasonally, Summer (88 days avg.) sees the longest lead times, while Winter (46 days avg.) has the shortest, reflecting typical travel planning cycles.
Recommendations for Hosts
- Use the overall average lead time (74 days) as a baseline for your pricing and availability strategy in Williamstown.
- For June stays, consider implementing length-of-stay discounts or slightly higher rates for bookings made less than 135 days out to capitalize on advance planning.
- Target marketing efforts for the Summer season well in advance (at least 88 days) to capture early planners.
- Monitor your own booking lead times against these Williamstown averages to identify opportunities for dynamic pricing adjustments.
Popular & Essential Airbnb Amenities in Williamstown (2026)
Amenity Prevalence
Amenity Insights for Williamstown
- Essential amenities in Williamstown that guests expect include: Wifi, Smoke alarm, Free parking on premises, Carbon monoxide alarm, Heating. Lacking these (any) could significantly impact bookings.
- Popular amenities like Hot water, Essentials, Hair dryer are common but not universal. Offering these can provide a competitive edge.
Recommendations for Hosts
- Ensure your listing includes all essential amenities for Williamstown: Wifi, Smoke alarm, Free parking on premises, Carbon monoxide alarm, Heating.
- Prioritize adding missing essentials: Free parking on premises, Carbon monoxide alarm, Heating.
- Consider adding popular differentiators like Hot water or Essentials to increase appeal.
- Highlight unique or less common amenities you offer (e.g., hot tub, dedicated workspace, EV charger) in your listing description and photos.
- Regularly check competitor amenities in Williamstown to stay competitive.
Williamstown Airbnb Guest Demographics & Profile Analysis (2026)
Guest Profile Summary for Williamstown
- The typical guest profile for Airbnb in Williamstown consists of primarily domestic travelers (95%), often arriving from nearby New York, typically belonging to the Post-2000s (Gen Z/Alpha) group (50%), primarily speaking English or Spanish.
- Domestic travelers account for 95.0% of guests.
- Key international markets include United States (95%) and DC (1.8%).
- Top languages spoken are English (61.1%) followed by Spanish (11.6%).
- A significant demographic segment is the Post-2000s (Gen Z/Alpha) group, representing 50% of guests.
Recommendations for Hosts
- Target domestic marketing efforts towards travelers from New York and Boston.
- Tailor amenities and listing descriptions to appeal to the dominant Post-2000s (Gen Z/Alpha) demographic (e.g., highlight fast WiFi, smart home features, local guides).
- Highlight unique local experiences or amenities relevant to the primary guest profile.
- Consider seasonal promotions aligned with peak travel times for key origin markets.
Nearby Short-Term Rental Market Comparison
How does the Williamstown Airbnb market stack up against its neighbors? Compare key performance metrics like average monthly revenue, ADR, and occupancy rates in surrounding areas to understand the broader regional STR landscape.
| Market | Active Properties | Monthly Revenue | Daily Rate | Avg. Occupancy |
|---|---|---|---|---|
| Middletown Springs | 13 | $6,843 | $507.55 | 32% |
| Pomfret | 15 | $6,549 | $502.74 | 45% |
| Town of Kingston | 10 | $6,470 | $473.76 | 49% |
| Frankford Township | 11 | $6,329 | $505.19 | 41% |
| Fort Ann | 35 | $6,238 | $790.41 | 37% |
| Town of East Hampton | 1,327 | $5,945 | $986.02 | 36% |
| Hanover | 33 | $5,826 | $1189.51 | 41% |
| Town of Monroe | 22 | $5,690 | $720.52 | 37% |
| Town of Ancram | 22 | $5,616 | $512.55 | 38% |
| Town of Schodack | 11 | $5,158 | $555.89 | 29% |