Stockbridge Airbnb Market Analysis 2026: Short Term Rental Data & Vacation Rental Statistics in Massachusetts, United States
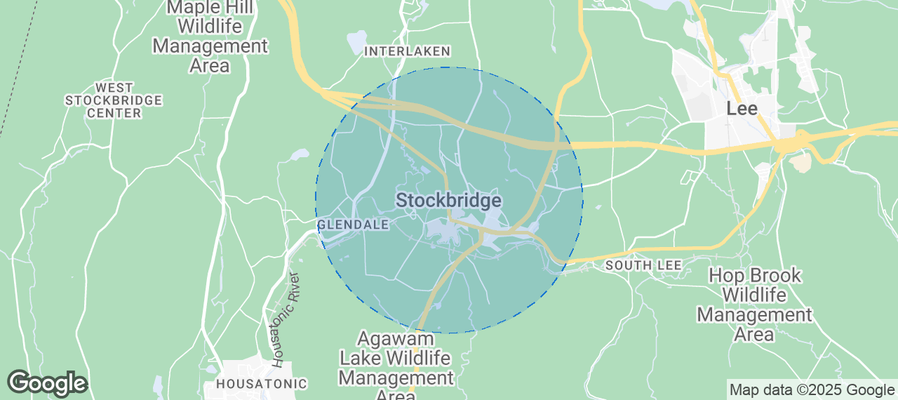
Is Airbnb profitable in Stockbridge in 2026? Explore comprehensive Airbnb analytics for Stockbridge, Massachusetts, United States to uncover income potential. This 2026 STR market report for Stockbridge, based on AirROI data from February 2025 to January 2026, reveals key trends in the niche market of 76 active listings.
Whether you're considering an Airbnb investment in Stockbridge, optimizing your existing vacation rental, or exploring rental arbitrage opportunities, understanding the Stockbridge Airbnb data is crucial. Leveraging the low regulation environment is key to maximizing your short term rental income potential. Let's dive into the specifics.
Key Stockbridge Airbnb Performance Metrics Overview
Monthly Airbnb Revenue Variations & Income Potential in Stockbridge (2026)
Understanding the monthly revenue variations for Airbnb listings in Stockbridge is key to maximizing your short term rental income potential. Seasonality significantly impacts earnings. Our analysis, based on data from the past 12 months, shows that the peak revenue month for STRs in Stockbridge is typically July, while April often presents the lowest earnings, highlighting opportunities for strategic pricing adjustments during shoulder and low seasons. Explore the typical Airbnb income in Stockbridge across different performance tiers:
- Best-in-class properties (Top 10%) achieve $10,812+ monthly, often utilizing dynamic pricing and superior guest experiences.
- Strong performing properties (Top 25%) earn $6,899 or more, indicating effective management and desirable locations/amenities.
- Typical properties (Median) generate around $4,112 per month, representing the average market performance.
- Entry-level properties (Bottom 25%) see earnings around $2,356, often with potential for optimization.
Average Monthly Airbnb Earnings Trend in Stockbridge
Stockbridge Airbnb Occupancy Rate Trends (2026)
Maximize your bookings by understanding the Stockbridge STR occupancy trends. Seasonal demand shifts significantly influence how often properties are booked. Typically, Augustsees the highest demand (peak season occupancy), while April experiences the lowest (low season). Effective strategies, like adjusting minimum stays or offering promotions, can boost occupancy during slower periods. Here's how different property tiers perform in Stockbridge:
- Best-in-class properties (Top 10%) achieve 75%+ occupancy, indicating high desirability and potentially optimized availability.
- Strong performing properties (Top 25%) maintain 55% or higher occupancy, suggesting good market fit and guest satisfaction.
- Typical properties (Median) have an occupancy rate around 35%.
- Entry-level properties (Bottom 25%) average 20% occupancy, potentially facing higher vacancy.
Average Monthly Occupancy Rate Trend in Stockbridge
Average Daily Rate (ADR) Airbnb Trends in Stockbridge (2026)
Effective short term rental pricing strategy in Stockbridge involves understanding monthly ADR fluctuations. The Average Daily Rate (ADR) for Airbnb in Stockbridge typically peaks in July and dips lowest during March. Leveraging Airbnb dynamic pricing tools or strategies based on this seasonality can significantly boost revenue. Here's a look at the typical nightly rates achieved:
- Best-in-class properties (Top 10%) command rates of $747+ per night, often due to premium features or locations.
- Strong performing properties (Top 25%) achieve nightly rates of $515 or more.
- Typical properties (Median) charge around $362 per night.
- Entry-level properties (Bottom 25%) earn around $270 per night.
Average Daily Rate (ADR) Trend by Month in Stockbridge
Get Live Stockbridge Market Intelligence 👇
Explore Real-time Analytics
Airbnb Seasonality Analysis & Trends in Stockbridge (2026)
Peak Season (July, August, October)
- Revenue averages $8,686 per month
- Occupancy rates average 58.3%
- Daily rates average $464
Shoulder Season
- Revenue averages $4,541 per month
- Occupancy maintains around 34.6%
- Daily rates hold near $439
Low Season (January, February, April)
- Revenue drops to average $3,507 per month
- Occupancy decreases to average 30.5%
- Daily rates adjust to average $425
Seasonality Insights for Stockbridge
- The Airbnb seasonality in Stockbridge shows highly seasonal trends requiring careful strategy. While the sections above show seasonal averages, it's also insightful to look at the extremes:
- During the high season, the absolute peak month showcases Stockbridge's highest earning potential, with monthly revenues capable of climbing to $10,242, occupancy reaching a high of 65.9%, and ADRs peaking at $480.
- Conversely, the slowest single month of the year, typically falling within the low season, marks the market's lowest point. In this month, revenue might dip to $3,212, occupancy could drop to 28.2%, and ADRs may adjust down to $419.
- Understanding both the seasonal averages and these monthly peaks and troughs in revenue, occupancy, and ADR is crucial for maximizing your Airbnb profit potential in Stockbridge.
Seasonal Strategies for Maximizing Profit
- Peak Season: Maximize revenue through premium pricing and potentially longer minimum stays. Ensure high availability.
- Low Season: Offer competitive pricing, special promotions (e.g., extended stay discounts), and flexible cancellation policies. Target off-season travelers like remote workers or budget-conscious guests.
- Shoulder Seasons: Implement dynamic pricing that balances peak and low rates. Target weekend travelers or specific events. Offer slightly more flexible terms than peak season.
- Regularly analyze your own performance against these Stockbridge seasonality benchmarks and adjust your pricing and availability strategy accordingly.
Best Areas for Airbnb Investment in Stockbridge (2026)
Exploring the top neighborhoods for short-term rentals in Stockbridge? This section highlights key areas, outlining why they are attractive for hosts and guests, along with notable local attractions. Consider these locations based on your target guest profile and investment strategy.
| Neighborhood / Area | Why Host Here? (Target Guests & Appeal) | Key Attractions & Landmarks |
|---|---|---|
| Main Street | The heart of Stockbridge, featuring charming shops and historic sites, making it attractive for visitors looking for a quintessential New England experience. | Norman Rockwell Museum, Stockbridge Library, Berkshire Botanical Garden, Ice Glen, Stockbridge Town Hall, Main Street shops |
| Contemporary Art Museum District | A burgeoning area with art galleries and cultural institutions, appealing to art enthusiasts and tourists seeking unique experiences. | The Berkshire Museum, Naumkeag, Blantyre, Stockbridge Arts and Crafts, Nearby Tanglewood Festival |
| Stockbridge Bowl | A picturesque lake ideal for outdoor activities and relaxation, great for attracting nature lovers and families. | Swimming and fishing opportunities, Scenic hiking trails, Stockbridge Bowl Beach |
| Lake Road | A beautiful waterfront area with cabins and cozy homes, popular with travelers looking for a serene getaway. | Waterfront views, Sunset watching, Kayaking and paddleboarding |
| Berkshire Mountains | The surrounding mountainous terrain offers incredible views and outdoor activities, highly appealing to adventure seekers year-round. | Hiking trails, Ski resorts in winter, Scenic drives, Nature photography |
| Cultural District | A focus on the rich cultural and theatrical offerings in the region, which attracts those interested in arts and performances. | The Berkshire Theatre Group, The Lenox Library, Cultural festivals, Art galleries |
| Historical District | Stockbridge is known for its vibrant history and beautiful architecture, making it attractive for tourists looking for a historical experience. | Historical homes, The Stockbridge-Munsee Community, Walking tours, Historic buildings |
| Nature Reserve Areas | Surrounding natural reserves and parks offer an appealing escape for nature lovers and those seeking peaceful retreats. | Laurens Pond, Housatonic River, Wildlife watching, Nature trails |
Understanding Airbnb License Requirements & STR Laws in Stockbridge (2026)
While Stockbridge, Massachusetts, United States currently shows low STR regulations, specific Airbnb license requirements might still exist or change. Always verify the latest short term rental regulations and Airbnb license requirements directly with local government authorities for Stockbridge to ensure full compliance before hosting.
(Source: AirROI data, 2026, finding no licensed listings among those analyzed)
Top Performing Airbnb Properties in Stockbridge (2026)
Benchmark your potential! Explore examples of top-performing Airbnb properties in Stockbridgebased on Trailing Twelve Month (TTM) revenue. Analyze their characteristics, revenue, occupancy rate, and ADR to understand what drives success in this market.
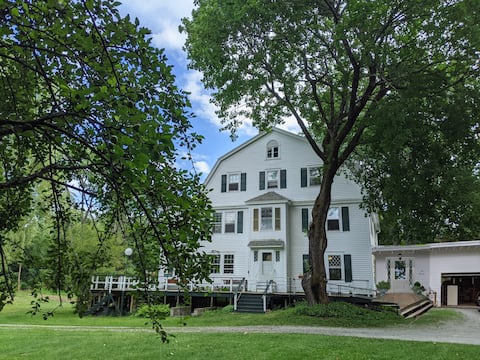
Historic Stockbridge Villa on 25 acres sleeps 16
Entire Place • 11 bedrooms

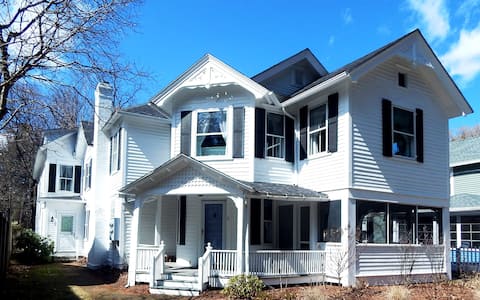
Beautiful And Private Home Centrally Located
Entire Place • 4 bedrooms
Victorian 11 Bedrooms 7 Baths Handicap Sleeps 24
Entire Place • 11 bedrooms

The Taggart House
Entire Place • 6 bedrooms
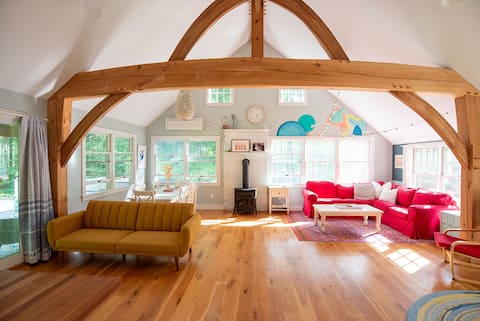
Secluded Family Home in Serene Stockbridge Woods
Entire Place • 3 bedrooms
Stockbridge Retreat w/ Pool & Hot Tub!
Entire Place • 4 bedrooms
Note: Performance varies based on location, size, amenities, seasonality, and management quality. Data reflects the past 12 months.
Top Performing Airbnb Hosts in Stockbridge (2026)
Learn from the best! This table showcases top-performing Airbnb hosts in Stockbridge based on the number of properties managed and estimated total revenue over the past year. Analyze their scale and performance metrics.
| Host Name | Properties | Grossing Revenue | Stay Reviews | Avg Rating |
|---|---|---|---|---|
| Evolve | 5 | $249,725 | 139 | 4.86/5.0 |
| Susan | 3 | $230,962 | 95 | 4.92/5.0 |
| George | 2 | $191,597 | 61 | 4.93/5.0 |
| Dan | 1 | $180,534 | 58 | 4.95/5.0 |
| Jill | 1 | $161,800 | 56 | 4.96/5.0 |
| Elisa | 3 | $127,690 | 47 | 4.93/5.0 |
| Lucas | 2 | $109,917 | 44 | 4.96/5.0 |
| Tom | 1 | $109,621 | 67 | 4.99/5.0 |
| Annie | 1 | $91,207 | 71 | 4.99/5.0 |
| Mary | 2 | $87,503 | 19 | 5.00/5.0 |
Analyzing the strategies of top hosts, such as their property selection, pricing, and guest communication, can offer valuable lessons for optimizing your own Airbnb operations in Stockbridge.
Dive Deeper: Advanced Stockbridge STR Market Data (2026)
Ready to unlock more insights? AirROI provides access to advanced metrics and comprehensive Airbnb data for Stockbridge. Explore detailed analytics beyond this report to refine your investment strategy, optimize pricing, and maximize your vacation rental profits.
Explore Advanced MetricsStockbridge Short-Term Rental Market Composition (2026): Property & Room Types
Room Type Distribution
Property Type Distribution
Market Composition Insights for Stockbridge
- The Stockbridge Airbnb market composition is heavily skewed towards Entire Home/Apt listings, which make up 93.4% of the 76 active rentals. This indicates strong guest preference for privacy and space.
- Looking at the property type distribution in Stockbridge, House properties are the most common (76.3%), reflecting the local real estate landscape.
- Houses represent a significant 76.3% portion, catering likely to families or larger groups.
- The presence of 7.9% Hotel/Boutique listings indicates integration with traditional hospitality.
- Smaller segments like others (combined 1.3%) offer potential for unique stay experiences.
Stockbridge Airbnb Room Capacity Analysis (2026): Bedroom Distribution
Distribution of Listings by Number of Bedrooms
Room Capacity Insights for Stockbridge
- The dominant room capacity in Stockbridge is 3 bedrooms listings, making up 40.8% of the market. This suggests a strong demand for properties suitable for families or small groups.
- Together, 3 bedrooms and 2 bedrooms properties represent 57.9% of the active Airbnb listings in Stockbridge, indicating a high concentration in these sizes.
- A significant 65.8% of listings offer 3+ bedrooms, catering to larger groups and families seeking more space in Stockbridge.
Stockbridge Vacation Rental Guest Capacity Trends (2026)
Distribution of Listings by Guest Capacity
Guest Capacity Insights for Stockbridge
- The most common guest capacity trend in Stockbridge vacation rentals is listings accommodating 6 guests (34.2%). This suggests the primary traveler segment is likely larger groups.
- Properties designed for 6 guests and 8+ guests dominate the Stockbridge STR market, accounting for 60.5% of listings.
- 67.1% of properties accommodate 6+ guests, serving the market segment for larger families or group travel in Stockbridge.
- On average, properties in Stockbridge are equipped to host 5.6 guests.
Stockbridge Airbnb Booking Patterns (2026): Available vs. Booked Days
Available Days Distribution
Booked Days Distribution
Booking Pattern Insights for Stockbridge
- The most common availability pattern in Stockbridge falls within the 271-366 days range, representing 52.6% of listings. This suggests many properties have significant open periods on their calendars.
- Approximately 81.5% of listings show high availability (181+ days open annually), indicating potential for increased bookings or specific owner usage patterns.
- For booked days, the 31-90 days range is most frequent in Stockbridge (40.8%), reflecting common guest stay durations or potential owner blocking patterns.
- A notable 18.4% of properties secure long booking periods (181+ days booked per year), highlighting successful long-term rental strategies or significant owner usage.
Stockbridge Airbnb Minimum Stay Requirements Analysis
Distribution of Listings by Minimum Night Requirement
1 Night
8 listings
10.5% of total
2 Nights
20 listings
26.3% of total
3 Nights
13 listings
17.1% of total
4-6 Nights
4 listings
5.3% of total
7-29 Nights
3 listings
3.9% of total
30+ Nights
28 listings
36.8% of total
Key Insights
- The most prevalent minimum stay requirement in Stockbridge is 30+ Nights, adopted by 36.8% of listings. This highlights the market's preference for longer commitments.
- A significant segment (36.8%) caters to monthly stays (30+ nights) in Stockbridge, pointing to opportunities in the extended-stay market.
Recommendations
- Align with the market by considering a 30+ Nights minimum stay, as 36.8% of Stockbridge hosts use this setting.
- If feasible, allowing 1-night stays, especially midweek or during low season, could capture last-minute bookings, as only 10.5% currently do.
- Explore offering discounts for stays of 30+ nights to attract the 36.8% of the market seeking extended stays.
- Adjust minimum nights based on seasonality – potentially shorter during low season and longer during peak demand periods in Stockbridge.
Stockbridge Airbnb Cancellation Policy Trends Analysis (2026)
Super Strict 60 Days
7 listings
9.2% of total
Flexible
8 listings
10.5% of total
Moderate
15 listings
19.7% of total
Firm
32 listings
42.1% of total
Strict
14 listings
18.4% of total
Cancellation Policy Insights for Stockbridge
- The prevailing Airbnb cancellation policy trend in Stockbridge is Firm, used by 42.1% of listings.
- A majority (60.5%) of hosts in Stockbridge utilize Firm or Strict policies, indicating a market where hosts prioritize booking security.
Recommendations for Hosts
- Consider adopting a Firm policy to align with the 42.1% market standard in Stockbridge.
- Regularly review your cancellation policy against competitors and market demand shifts in Stockbridge.
Stockbridge STR Booking Lead Time Analysis (2026)
Average Booking Lead Time by Month
Booking Lead Time Insights for Stockbridge
- The overall average booking lead time for vacation rentals in Stockbridge is 74 days.
- Guests book furthest in advance for stays during July (average 125 days), likely coinciding with peak travel demand or local events.
- The shortest booking windows occur for stays in January (average 25 days), indicating more last-minute travel plans during this time.
- Seasonally, Summer (101 days avg.) sees the longest lead times, while Winter (40 days avg.) has the shortest, reflecting typical travel planning cycles.
Recommendations for Hosts
- Use the overall average lead time (74 days) as a baseline for your pricing and availability strategy in Stockbridge.
- For July stays, consider implementing length-of-stay discounts or slightly higher rates for bookings made less than 125 days out to capitalize on advance planning.
- Target marketing efforts for the Summer season well in advance (at least 101 days) to capture early planners.
- Monitor your own booking lead times against these Stockbridge averages to identify opportunities for dynamic pricing adjustments.
Popular & Essential Airbnb Amenities in Stockbridge (2026)
Amenity Prevalence
Amenity Insights for Stockbridge
- Essential amenities in Stockbridge that guests expect include: Wifi, Smoke alarm, Free parking on premises, Heating. Lacking these (any) could significantly impact bookings.
- Popular amenities like Carbon monoxide alarm, Coffee maker, TV are common but not universal. Offering these can provide a competitive edge.
Recommendations for Hosts
- Ensure your listing includes all essential amenities for Stockbridge: Wifi, Smoke alarm, Free parking on premises, Heating.
- Prioritize adding missing essentials: Free parking on premises, Heating.
- Consider adding popular differentiators like Carbon monoxide alarm or Coffee maker to increase appeal.
- Highlight unique or less common amenities you offer (e.g., hot tub, dedicated workspace, EV charger) in your listing description and photos.
- Regularly check competitor amenities in Stockbridge to stay competitive.
Stockbridge Airbnb Guest Demographics & Profile Analysis (2026)
Guest Profile Summary for Stockbridge
- The typical guest profile for Airbnb in Stockbridge consists of primarily domestic travelers (96%), often arriving from nearby New York, typically belonging to the Post-2000s (Gen Z/Alpha) group (50%), primarily speaking English or French.
- Domestic travelers account for 96.2% of guests.
- Key international markets include United States (96.2%) and DC (1.5%).
- Top languages spoken are English (62.4%) followed by French (11.9%).
- A significant demographic segment is the Post-2000s (Gen Z/Alpha) group, representing 50% of guests.
Recommendations for Hosts
- Target domestic marketing efforts towards travelers from New York and Boston.
- Tailor amenities and listing descriptions to appeal to the dominant Post-2000s (Gen Z/Alpha) demographic (e.g., highlight fast WiFi, smart home features, local guides).
- Highlight unique local experiences or amenities relevant to the primary guest profile.
- Consider seasonal promotions aligned with peak travel times for key origin markets.
Nearby Short-Term Rental Market Comparison
How does the Stockbridge Airbnb market stack up against its neighbors? Compare key performance metrics like average monthly revenue, ADR, and occupancy rates in surrounding areas to understand the broader regional STR landscape.
| Market | Active Properties | Monthly Revenue | Daily Rate | Avg. Occupancy |
|---|---|---|---|---|
| Middletown Springs | 13 | $6,843 | $507.55 | 32% |
| Pomfret | 15 | $6,549 | $502.74 | 45% |
| Town of Kingston | 10 | $6,470 | $473.76 | 49% |
| Frankford Township | 11 | $6,329 | $505.19 | 41% |
| Fort Ann | 35 | $6,238 | $790.41 | 37% |
| Town of East Hampton | 1,327 | $5,945 | $986.02 | 36% |
| Hanover | 33 | $5,826 | $1189.51 | 41% |
| Town of Monroe | 22 | $5,690 | $720.52 | 37% |
| Town of Ancram | 22 | $5,616 | $512.55 | 38% |
| Town of Schodack | 11 | $5,158 | $555.89 | 29% |