Richmond Airbnb Market Analysis 2026: Short Term Rental Data & Vacation Rental Statistics in Massachusetts, United States
Is Airbnb profitable in Richmond in 2026? Explore comprehensive Airbnb analytics for Richmond, Massachusetts, United States to uncover income potential. This 2026 STR market report for Richmond, based on AirROI data from February 2025 to January 2026, reveals key trends in the niche market of 21 active listings.
Whether you're considering an Airbnb investment in Richmond, optimizing your existing vacation rental, or exploring rental arbitrage opportunities, understanding the Richmond Airbnb data is crucial. Leveraging the low regulation environment is key to maximizing your short term rental income potential. Let's dive into the specifics.
Key Richmond Airbnb Performance Metrics Overview
Monthly Airbnb Revenue Variations & Income Potential in Richmond (2026)
Understanding the monthly revenue variations for Airbnb listings in Richmond is key to maximizing your short term rental income potential. Seasonality significantly impacts earnings. Our analysis, based on data from the past 12 months, shows that the peak revenue month for STRs in Richmond is typically August, while December often presents the lowest earnings, highlighting opportunities for strategic pricing adjustments during shoulder and low seasons. Explore the typical Airbnb income in Richmond across different performance tiers:
- Best-in-class properties (Top 10%) achieve $11,740+ monthly, often utilizing dynamic pricing and superior guest experiences.
- Strong performing properties (Top 25%) earn $6,720 or more, indicating effective management and desirable locations/amenities.
- Typical properties (Median) generate around $3,737 per month, representing the average market performance.
- Entry-level properties (Bottom 25%) see earnings around $1,774, often with potential for optimization.
Average Monthly Airbnb Earnings Trend in Richmond
Richmond Airbnb Occupancy Rate Trends (2026)
Maximize your bookings by understanding the Richmond STR occupancy trends. Seasonal demand shifts significantly influence how often properties are booked. Typically, Julysees the highest demand (peak season occupancy), while November experiences the lowest (low season). Effective strategies, like adjusting minimum stays or offering promotions, can boost occupancy during slower periods. Here's how different property tiers perform in Richmond:
- Best-in-class properties (Top 10%) achieve 63%+ occupancy, indicating high desirability and potentially optimized availability.
- Strong performing properties (Top 25%) maintain 47% or higher occupancy, suggesting good market fit and guest satisfaction.
- Typical properties (Median) have an occupancy rate around 29%.
- Entry-level properties (Bottom 25%) average 16% occupancy, potentially facing higher vacancy.
Average Monthly Occupancy Rate Trend in Richmond
Average Daily Rate (ADR) Airbnb Trends in Richmond (2026)
Effective short term rental pricing strategy in Richmond involves understanding monthly ADR fluctuations. The Average Daily Rate (ADR) for Airbnb in Richmond typically peaks in September and dips lowest during March. Leveraging Airbnb dynamic pricing tools or strategies based on this seasonality can significantly boost revenue. Here's a look at the typical nightly rates achieved:
- Best-in-class properties (Top 10%) command rates of $906+ per night, often due to premium features or locations.
- Strong performing properties (Top 25%) achieve nightly rates of $584 or more.
- Typical properties (Median) charge around $350 per night.
- Entry-level properties (Bottom 25%) earn around $252 per night.
Average Daily Rate (ADR) Trend by Month in Richmond
Get Live Richmond Market Intelligence 👇

Explore Real-time Analytics
Airbnb Seasonality Analysis & Trends in Richmond (2026)
Peak Season (August, July, June)
- Revenue averages $8,260 per month
- Occupancy rates average 47.3%
- Daily rates average $474
Shoulder Season
- Revenue averages $4,514 per month
- Occupancy maintains around 30.9%
- Daily rates hold near $448
Low Season (March, September, December)
- Revenue drops to average $3,690 per month
- Occupancy decreases to average 23.6%
- Daily rates adjust to average $462
Seasonality Insights for Richmond
- The Airbnb seasonality in Richmond shows highly seasonal trends requiring careful strategy. While the sections above show seasonal averages, it's also insightful to look at the extremes:
- During the high season, the absolute peak month showcases Richmond's highest earning potential, with monthly revenues capable of climbing to $9,776, occupancy reaching a high of 54.4%, and ADRs peaking at $492.
- Conversely, the slowest single month of the year, typically falling within the low season, marks the market's lowest point. In this month, revenue might dip to $3,412, occupancy could drop to 19.4%, and ADRs may adjust down to $409.
- Understanding both the seasonal averages and these monthly peaks and troughs in revenue, occupancy, and ADR is crucial for maximizing your Airbnb profit potential in Richmond.
Seasonal Strategies for Maximizing Profit
- Peak Season: Maximize revenue through premium pricing and potentially longer minimum stays. Ensure high availability.
- Low Season: Offer competitive pricing, special promotions (e.g., extended stay discounts), and flexible cancellation policies. Target off-season travelers like remote workers or budget-conscious guests.
- Shoulder Seasons: Implement dynamic pricing that balances peak and low rates. Target weekend travelers or specific events. Offer slightly more flexible terms than peak season.
- Regularly analyze your own performance against these Richmond seasonality benchmarks and adjust your pricing and availability strategy accordingly.
Best Areas for Airbnb Investment in Richmond (2026)
Exploring the top neighborhoods for short-term rentals in Richmond? This section highlights key areas, outlining why they are attractive for hosts and guests, along with notable local attractions. Consider these locations based on your target guest profile and investment strategy.
| Neighborhood / Area | Why Host Here? (Target Guests & Appeal) | Key Attractions & Landmarks |
|---|---|---|
| Downtown Richmond | Richmond's bustling downtown area is known for its rich history, vibrant arts scene, and diverse dining options. It attracts both business travelers and tourists exploring the city's historic sites. | Virginia State Capitol, The National, Canal Walk, Richmond Symphony, Edgar Allan Poe Museum |
| Shockoe Bottom | A historic district with a mix of old architecture and modern amenities, Shockoe Bottom is known for its nightlife, restaurants, and proximity to the James River. | Shockoe Bottom Historic District, Richmond Railroad Museum, The Edison, Austin Alley, James River |
| Church Hill | Famous for its stunning views of the city and historical homes, Church Hill is a desirable neighborhood that combines charm and a strong sense of community, making it great for families and tourists. | Libby Hill Park, St. John's Church, Church Hill Urban Farm, Richmond's Historic Church District |
| The Fan District | A picturesque neighborhood known for its Victorian architecture and vibrant arts and culture scene. Popular with visitors due to proximity to art galleries, theaters, and dining. | Virginia Museum of Fine Arts, Byrd Theatre, The Carver Community Cultural Center, The Fan District walking tours |
| West End | A suburban area with more space, West End is popular for families and those looking for a quieter stay. It offers great parks and shopping opportunities. | Short Pump Town Center, Deep Run Park, Windsor Farms, Henrico County Recreation Center |
| Scott’s Addition | An up-and-coming neighborhood known for its craft breweries and innovative dining options. It's popular with younger crowds and tourists looking for a unique local experience. | Scott's Addition Beer Trail, The HofGarden, The Veil Brewing Co., Historic Scott's Addition |
| Midtown | A growing area that bridges the city's history with modern development. It has a mix of residential and commercial spaces, attracting a diverse crowd. | The Museum District, Virginia Commonwealth University, Greater Richmond Convention Center |
| Southside | This area offers a mix of urban convenience and suburban comfort, making it appealing for families and affordable for travelers on a budget. | South Park Mall, Virginia State Fairgrounds, Local Parks and Recreation Facilities |
Understanding Airbnb License Requirements & STR Laws in Richmond (2026)
While Richmond, Massachusetts, United States currently shows low STR regulations, specific Airbnb license requirements might still exist or change. Always verify the latest short term rental regulations and Airbnb license requirements directly with local government authorities for Richmond to ensure full compliance before hosting.
(Source: AirROI data, 2026, finding no licensed listings among those analyzed)
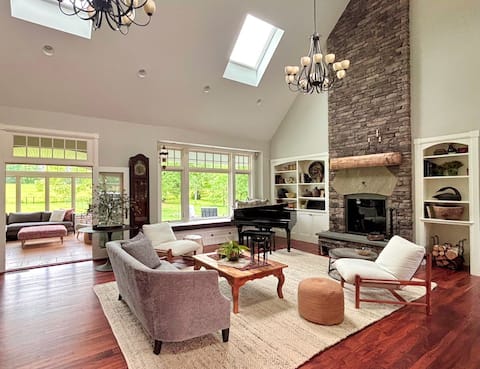
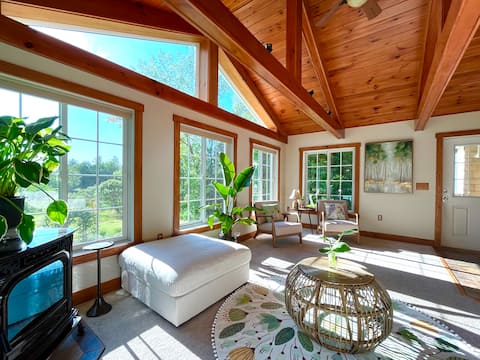
Top Performing Airbnb Properties in Richmond (2026)
Benchmark your potential! Explore examples of top-performing Airbnb properties in Richmondbased on Trailing Twelve Month (TTM) revenue. Analyze their characteristics, revenue, occupancy rate, and ADR to understand what drives success in this market.

"Hemlock Shadow" near Tanglewood on Six Acres
Entire Place • 4 bedrooms
Gated Ski Rental, Pure Luxury, Sleeps 11, Mini Gym
Entire Place • 5 bedrooms

Berkshires Colonial on 2 Acres by Evergreen Home
Entire Place • 4 bedrooms

Escape to The Berkshires w/Pool by Evergreen Home
Entire Place • 4 bedrooms
Minutes to Skiing with Massive Backyard
Entire Place • 5 bedrooms

Ski the Berkshires at Hygge House on Richmond Pond
Entire Place • 3 bedrooms
Note: Performance varies based on location, size, amenities, seasonality, and management quality. Data reflects the past 12 months.
Top Performing Airbnb Hosts in Richmond (2026)
Learn from the best! This table showcases top-performing Airbnb hosts in Richmond based on the number of properties managed and estimated total revenue over the past year. Analyze their scale and performance metrics.
| Host Name | Properties | Grossing Revenue | Stay Reviews | Avg Rating |
|---|---|---|---|---|
| Evergreen Home | 4 | $223,404 | 134 | 4.95/5.0 |
| Brandon | 1 | $154,934 | 19 | 4.95/5.0 |
| Berkshire Rental Properties | 1 | $89,978 | 10 | 5.00/5.0 |
| Elise | 1 | $68,774 | 38 | 4.92/5.0 |
| Jessica | 1 | $65,142 | 71 | 4.96/5.0 |
| Hideaway Hollow Properties | 1 | $52,750 | 22 | 4.95/5.0 |
| Adam | 1 | $31,914 | 16 | 4.94/5.0 |
| Meg | 1 | $30,325 | 46 | 4.78/5.0 |
| Hayley | 1 | $18,864 | 197 | 4.93/5.0 |
| Michael | 1 | $18,257 | 98 | 4.97/5.0 |
Analyzing the strategies of top hosts, such as their property selection, pricing, and guest communication, can offer valuable lessons for optimizing your own Airbnb operations in Richmond.
Dive Deeper: Advanced Richmond STR Market Data (2026)
Ready to unlock more insights? AirROI provides access to advanced metrics and comprehensive Airbnb data for Richmond. Explore detailed analytics beyond this report to refine your investment strategy, optimize pricing, and maximize your vacation rental profits.
Explore Advanced MetricsRichmond Short-Term Rental Market Composition (2026): Property & Room Types
Room Type Distribution
Property Type Distribution
Market Composition Insights for Richmond
- The Richmond Airbnb market composition is heavily skewed towards Entire Home/Apt listings, which make up 95.2% of the 21 active rentals. This indicates strong guest preference for privacy and space.
- Looking at the property type distribution in Richmond, House properties are the most common (81%), reflecting the local real estate landscape.
- Houses represent a significant 81% portion, catering likely to families or larger groups.
Richmond Airbnb Room Capacity Analysis (2026): Bedroom Distribution
Distribution of Listings by Number of Bedrooms
Room Capacity Insights for Richmond
- The dominant room capacity in Richmond is 4 bedrooms listings, making up 33.3% of the market. This suggests a strong demand for properties suitable for families or small groups.
- Together, 4 bedrooms and 3 bedrooms properties represent 61.9% of the active Airbnb listings in Richmond, indicating a high concentration in these sizes.
- A significant 71.4% of listings offer 3+ bedrooms, catering to larger groups and families seeking more space in Richmond.
Richmond Vacation Rental Guest Capacity Trends (2026)
Distribution of Listings by Guest Capacity
Guest Capacity Insights for Richmond
- The most common guest capacity trend in Richmond vacation rentals is listings accommodating 8+ guests (38.1%). This suggests the primary traveler segment is likely larger groups.
- Properties designed for 8+ guests and 6 guests dominate the Richmond STR market, accounting for 61.9% of listings.
- 66.7% of properties accommodate 6+ guests, serving the market segment for larger families or group travel in Richmond.
- On average, properties in Richmond are equipped to host 5.7 guests.
Richmond Airbnb Booking Patterns (2026): Available vs. Booked Days
Available Days Distribution
Booked Days Distribution
Booking Pattern Insights for Richmond
- The most common availability pattern in Richmond falls within the 181-270 days range, representing 52.4% of listings. This suggests many properties have significant open periods on their calendars.
- Approximately 100.0% of listings show high availability (181+ days open annually), indicating potential for increased bookings or specific owner usage patterns.
- For booked days, the 91-180 days range is most frequent in Richmond (52.4%), reflecting common guest stay durations or potential owner blocking patterns.
Richmond Airbnb Minimum Stay Requirements Analysis
Distribution of Listings by Minimum Night Requirement
2 Nights
8 listings
38.1% of total
3 Nights
3 listings
14.3% of total
7-29 Nights
2 listings
9.5% of total
30+ Nights
8 listings
38.1% of total
Key Insights
- The most prevalent minimum stay requirement in Richmond is 2 Nights, adopted by 38.1% of listings. This highlights the market's preference for shorter, flexible bookings.
- A significant segment (38.1%) caters to monthly stays (30+ nights) in Richmond, pointing to opportunities in the extended-stay market.
Recommendations
- Align with the market by considering a 2 Nights minimum stay, as 38.1% of Richmond hosts use this setting.
- A 2-night minimum appears standard (38.1%). Consider this for weekends or peak periods.
- Explore offering discounts for stays of 30+ nights to attract the 38.1% of the market seeking extended stays.
- Adjust minimum nights based on seasonality – potentially shorter during low season and longer during peak demand periods in Richmond.
Richmond Airbnb Cancellation Policy Trends Analysis (2026)
Super Strict 60 Days
1 listings
4.8% of total
Limited
1 listings
4.8% of total
Flexible
5 listings
23.8% of total
Moderate
2 listings
9.5% of total
Firm
12 listings
57.1% of total
Cancellation Policy Insights for Richmond
- The prevailing Airbnb cancellation policy trend in Richmond is Firm, used by 57.1% of listings.
- A majority (57.1%) of hosts in Richmond utilize Firm or Strict policies, indicating a market where hosts prioritize booking security.
Recommendations for Hosts
- Consider adopting a Firm policy to align with the 57.1% market standard in Richmond.
- Regularly review your cancellation policy against competitors and market demand shifts in Richmond.
Richmond STR Booking Lead Time Analysis (2026)
Average Booking Lead Time by Month
Booking Lead Time Insights for Richmond
- The overall average booking lead time for vacation rentals in Richmond is 50 days.
- Guests book furthest in advance for stays during July (average 102 days), likely coinciding with peak travel demand or local events.
- The shortest booking windows occur for stays in December (average 24 days), indicating more last-minute travel plans during this time.
- Seasonally, Summer (78 days avg.) sees the longest lead times, while Winter (26 days avg.) has the shortest, reflecting typical travel planning cycles.
Recommendations for Hosts
- Use the overall average lead time (50 days) as a baseline for your pricing and availability strategy in Richmond.
- For July stays, consider implementing length-of-stay discounts or slightly higher rates for bookings made less than 102 days out to capitalize on advance planning.
- Target marketing efforts for the Summer season well in advance (at least 78 days) to capture early planners.
- Monitor your own booking lead times against these Richmond averages to identify opportunities for dynamic pricing adjustments.
Popular & Essential Airbnb Amenities in Richmond (2026)
Amenity Prevalence
Amenity Insights for Richmond
- Essential amenities in Richmond that guests expect include: Wifi, Carbon monoxide alarm, Smoke alarm, Free parking on premises, Air conditioning, Kitchen, Fire extinguisher, Washer, Heating, Hangers. Lacking these (any) could significantly impact bookings.
Recommendations for Hosts
- Ensure your listing includes all essential amenities for Richmond: Wifi, Carbon monoxide alarm, Smoke alarm, Free parking on premises, Air conditioning, Kitchen, Fire extinguisher, Washer, Heating, Hangers.
- Prioritize adding missing essentials: Air conditioning, Kitchen, Fire extinguisher, Washer, Heating, Hangers.
- Highlight unique or less common amenities you offer (e.g., hot tub, dedicated workspace, EV charger) in your listing description and photos.
- Regularly check competitor amenities in Richmond to stay competitive.
Richmond Airbnb Guest Demographics & Profile Analysis (2026)
Guest Profile Summary for Richmond
- The typical guest profile for Airbnb in Richmond consists of primarily domestic travelers (95%), often arriving from nearby New York, typically belonging to the Post-2000s (Gen Z/Alpha) group (50%), primarily speaking English or Spanish.
- Domestic travelers account for 95.2% of guests.
- Key international markets include United States (95.2%) and Singapore (1%).
- Top languages spoken are English (63.8%) followed by Spanish (12.8%).
- A significant demographic segment is the Post-2000s (Gen Z/Alpha) group, representing 50% of guests.
Recommendations for Hosts
- Target domestic marketing efforts towards travelers from New York and Boston.
- Tailor amenities and listing descriptions to appeal to the dominant Post-2000s (Gen Z/Alpha) demographic (e.g., highlight fast WiFi, smart home features, local guides).
- Highlight unique local experiences or amenities relevant to the primary guest profile.
- Consider seasonal promotions aligned with peak travel times for key origin markets.
Nearby Short-Term Rental Market Comparison
How does the Richmond Airbnb market stack up against its neighbors? Compare key performance metrics like average monthly revenue, ADR, and occupancy rates in surrounding areas to understand the broader regional STR landscape.
| Market | Active Properties | Monthly Revenue | Daily Rate | Avg. Occupancy |
|---|---|---|---|---|
| Middletown Springs | 13 | $6,843 | $507.55 | 32% |
| Pomfret | 15 | $6,549 | $502.74 | 45% |
| Town of Kingston | 10 | $6,470 | $473.76 | 49% |
| Frankford Township | 11 | $6,329 | $505.19 | 41% |
| Fort Ann | 35 | $6,238 | $790.41 | 37% |
| Town of East Hampton | 1,327 | $5,945 | $986.02 | 36% |
| Hanover | 33 | $5,826 | $1189.51 | 41% |
| Town of Monroe | 22 | $5,690 | $720.52 | 37% |
| Town of Ancram | 22 | $5,616 | $512.55 | 38% |
| Town of Schodack | 11 | $5,158 | $555.89 | 29% |