Oak Bluffs Airbnb Market Analysis 2026: Short Term Rental Data & Vacation Rental Statistics in Massachusetts, United States
Is Airbnb profitable in Oak Bluffs in 2026? Explore comprehensive Airbnb analytics for Oak Bluffs, Massachusetts, United States to uncover income potential. This 2026 STR market report for Oak Bluffs, based on AirROI data from February 2025 to January 2026, reveals key trends in the market of 318 active listings.
Whether you're considering an Airbnb investment in Oak Bluffs, optimizing your existing vacation rental, or exploring rental arbitrage opportunities, understanding the Oak Bluffs Airbnb data is crucial. Leveraging the low regulation environment is key to maximizing your short term rental income potential. Let's dive into the specifics.
Key Oak Bluffs Airbnb Performance Metrics Overview
Monthly Airbnb Revenue Variations & Income Potential in Oak Bluffs (2026)
Understanding the monthly revenue variations for Airbnb listings in Oak Bluffs is key to maximizing your short term rental income potential. Seasonality significantly impacts earnings. Our analysis, based on data from the past 12 months, shows that the peak revenue month for STRs in Oak Bluffs is typically August, while February often presents the lowest earnings, highlighting opportunities for strategic pricing adjustments during shoulder and low seasons. Explore the typical Airbnb income in Oak Bluffs across different performance tiers:
- Best-in-class properties (Top 10%) achieve $14,050+ monthly, often utilizing dynamic pricing and superior guest experiences.
- Strong performing properties (Top 25%) earn $8,818 or more, indicating effective management and desirable locations/amenities.
- Typical properties (Median) generate around $5,080 per month, representing the average market performance.
- Entry-level properties (Bottom 25%) see earnings around $2,776, often with potential for optimization.
Average Monthly Airbnb Earnings Trend in Oak Bluffs
Oak Bluffs Airbnb Occupancy Rate Trends (2026)
Maximize your bookings by understanding the Oak Bluffs STR occupancy trends. Seasonal demand shifts significantly influence how often properties are booked. Typically, Augustsees the highest demand (peak season occupancy), while December experiences the lowest (low season). Effective strategies, like adjusting minimum stays or offering promotions, can boost occupancy during slower periods. Here's how different property tiers perform in Oak Bluffs:
- Best-in-class properties (Top 10%) achieve 70%+ occupancy, indicating high desirability and potentially optimized availability.
- Strong performing properties (Top 25%) maintain 53% or higher occupancy, suggesting good market fit and guest satisfaction.
- Typical properties (Median) have an occupancy rate around 34%.
- Entry-level properties (Bottom 25%) average 17% occupancy, potentially facing higher vacancy.
Average Monthly Occupancy Rate Trend in Oak Bluffs
Average Daily Rate (ADR) Airbnb Trends in Oak Bluffs (2026)
Effective short term rental pricing strategy in Oak Bluffs involves understanding monthly ADR fluctuations. The Average Daily Rate (ADR) for Airbnb in Oak Bluffs typically peaks in August and dips lowest during March. Leveraging Airbnb dynamic pricing tools or strategies based on this seasonality can significantly boost revenue. Here's a look at the typical nightly rates achieved:
- Best-in-class properties (Top 10%) command rates of $1,026+ per night, often due to premium features or locations.
- Strong performing properties (Top 25%) achieve nightly rates of $740 or more.
- Typical properties (Median) charge around $498 per night.
- Entry-level properties (Bottom 25%) earn around $356 per night.
Average Daily Rate (ADR) Trend by Month in Oak Bluffs
Get Live Oak Bluffs Market Intelligence 👇

Explore Real-time Analytics
Airbnb Seasonality Analysis & Trends in Oak Bluffs (2026)
Peak Season (August, July, June)
- Revenue averages $13,273 per month
- Occupancy rates average 58.4%
- Daily rates average $664
Shoulder Season
- Revenue averages $5,476 per month
- Occupancy maintains around 33.0%
- Daily rates hold near $596
Low Season (January, February, December)
- Revenue drops to average $3,074 per month
- Occupancy decreases to average 23.6%
- Daily rates adjust to average $597
Seasonality Insights for Oak Bluffs
- The Airbnb seasonality in Oak Bluffs shows highly seasonal trends requiring careful strategy. While the sections above show seasonal averages, it's also insightful to look at the extremes:
- During the high season, the absolute peak month showcases Oak Bluffs's highest earning potential, with monthly revenues capable of climbing to $16,298, occupancy reaching a high of 68.7%, and ADRs peaking at $683.
- Conversely, the slowest single month of the year, typically falling within the low season, marks the market's lowest point. In this month, revenue might dip to $2,898, occupancy could drop to 19.0%, and ADRs may adjust down to $557.
- Understanding both the seasonal averages and these monthly peaks and troughs in revenue, occupancy, and ADR is crucial for maximizing your Airbnb profit potential in Oak Bluffs.
Seasonal Strategies for Maximizing Profit
- Peak Season: Maximize revenue through premium pricing and potentially longer minimum stays. Ensure high availability.
- Low Season: Offer competitive pricing, special promotions (e.g., extended stay discounts), and flexible cancellation policies. Target off-season travelers like remote workers or budget-conscious guests.
- Shoulder Seasons: Implement dynamic pricing that balances peak and low rates. Target weekend travelers or specific events. Offer slightly more flexible terms than peak season.
- Regularly analyze your own performance against these Oak Bluffs seasonality benchmarks and adjust your pricing and availability strategy accordingly.
Best Areas for Airbnb Investment in Oak Bluffs (2026)
Exploring the top neighborhoods for short-term rentals in Oak Bluffs? This section highlights key areas, outlining why they are attractive for hosts and guests, along with notable local attractions. Consider these locations based on your target guest profile and investment strategy.
| Neighborhood / Area | Why Host Here? (Target Guests & Appeal) | Key Attractions & Landmarks |
|---|---|---|
| Oak Bluffs Town Center | The heart of Oak Bluffs with a charming atmosphere, filled with shops, restaurants, and easy access to the ferry terminal. A key spot for tourists exploring Martha's Vineyard. | Oak Bluffs Harbor, Inkwell Beach, Gingerbread Cottages, Ocean Park, Martha's Vineyard Camp Meeting Association |
| East Chop | A picturesque residential area known for its stunning views of the water and proximity to the East Chop Lighthouse. Great for guests seeking tranquility and picturesque scenery. | East Chop Lighthouse, Jaws Bridge, Motchouset Beach, East Chop Beach, Vineyard Haven Ferry Terminal |
| South Beach | A popular beach area offering beautiful sandy shores and clear waters, perfect for tourists looking for a beach getaway in Oak Bluffs. | South Beach, Joseph Silvia State Beach, State Beach, The Flying Horses Carousel, Beachfront dining options |
| North Bluff | A quieter area known for its scenic views and vintage charm. Ideal for families and individuals wanting a peaceful retreat close to activities. | North Bluff Park, Nearby beaches, Biking trails, Historic Oak Bluffs, Local eateries |
| Ochard Beach | A relaxing beach community with scenic views and calm waters, ideal for families and individuals wanting a laid-back beach vacation vibe. | Ochard Beach, Family-friendly parks, Shaded picnic areas, Waterfront dining, Nature trails |
| Martha's Vineyard Camp Meeting Association | Famous for its colorful gingerbread cottages and rich history. A unique place attracting tourists interested in culture and history. | Gingerbread Cottages, Tabernacle, Cultural events, Historical tours, Art galleries |
| The Island Theater | Located in a vibrant part of town, it offers entertainment options including movies and performances, attracting guests looking for cultural experiences. | Island Theater, Local art performances, Shopping, Nearby restaurants, Nightlife venues |
| Waban Park | A lovely area with proximity to the beach and local amenities, appealing to visitors wanting a mix of relaxation and activity. | Waban Park, Beach access, Sporting fields, Walking paths, Local shops and cafes |
Understanding Airbnb License Requirements & STR Laws in Oak Bluffs (2026)
While Oak Bluffs, Massachusetts, United States currently shows low STR regulations, specific Airbnb license requirements might still exist or change. Always verify the latest short term rental regulations and Airbnb license requirements directly with local government authorities for Oak Bluffs to ensure full compliance before hosting.
(Source: AirROI data, 2026, finding no licensed listings among those analyzed)
Top Performing Airbnb Properties in Oak Bluffs (2026)
Benchmark your potential! Explore examples of top-performing Airbnb properties in Oak Bluffsbased on Trailing Twelve Month (TTM) revenue. Analyze their characteristics, revenue, occupancy rate, and ADR to understand what drives success in this market.
9 Bedroom home in Oak Bluffs w/ Ocean Views & A/C
Entire Place • 9 bedrooms
The Island Collection MV: Seascape
Entire Place • 7 bedrooms
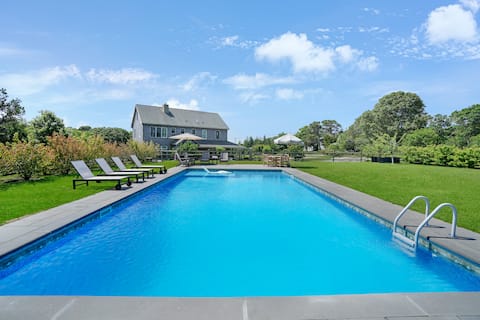
Family Property with Pool, Hot Tub, and Pond
Entire Place • 6 bedrooms

Beautiful 6 Bedroom Home Overlooking Beach
Entire Place • 6 bedrooms
Walk East Chop from Dover House
Entire Place • 5 bedrooms
Modern farmhouse w/Pool and AC
Entire Place • 4 bedrooms
Note: Performance varies based on location, size, amenities, seasonality, and management quality. Data reflects the past 12 months.
Top Performing Airbnb Hosts in Oak Bluffs (2026)
Learn from the best! This table showcases top-performing Airbnb hosts in Oak Bluffs based on the number of properties managed and estimated total revenue over the past year. Analyze their scale and performance metrics.
| Host Name | Properties | Grossing Revenue | Stay Reviews | Avg Rating |
|---|---|---|---|---|
| Brian | 13 | $701,265 | 1704 | 4.94/5.0 |
| Vaughn | 3 | $609,260 | 16 | 4.74/5.0 |
| Jolanta | 3 | $425,985 | 39 | 4.98/5.0 |
| Alex | 5 | $335,957 | 162 | 4.61/5.0 |
| Ted | 2 | $307,151 | 68 | 4.92/5.0 |
| Vacasa | 19 | $276,784 | 291 | 4.44/5.0 |
| Jazzmin | 1 | $245,082 | 18 | 4.94/5.0 |
| Evolve | 7 | $240,943 | 138 | 4.50/5.0 |
| Whitney | 2 | $228,770 | 239 | 4.93/5.0 |
| Courtney | 4 | $223,493 | 126 | 4.83/5.0 |
Analyzing the strategies of top hosts, such as their property selection, pricing, and guest communication, can offer valuable lessons for optimizing your own Airbnb operations in Oak Bluffs.
Dive Deeper: Advanced Oak Bluffs STR Market Data (2026)
Ready to unlock more insights? AirROI provides access to advanced metrics and comprehensive Airbnb data for Oak Bluffs. Explore detailed analytics beyond this report to refine your investment strategy, optimize pricing, and maximize your vacation rental profits.
Explore Advanced MetricsOak Bluffs Short-Term Rental Market Composition (2026): Property & Room Types
Room Type Distribution
Property Type Distribution
Market Composition Insights for Oak Bluffs
- The Oak Bluffs Airbnb market composition is heavily skewed towards Entire Home/Apt listings, which make up 90.6% of the 318 active rentals. This indicates strong guest preference for privacy and space.
- Looking at the property type distribution in Oak Bluffs, House properties are the most common (78.9%), reflecting the local real estate landscape.
- Houses represent a significant 78.9% portion, catering likely to families or larger groups.
- The presence of 5.7% Hotel/Boutique listings indicates integration with traditional hospitality.
- Smaller segments like others, outdoor/unique (combined 4.1%) offer potential for unique stay experiences.
Oak Bluffs Airbnb Room Capacity Analysis (2026): Bedroom Distribution
Distribution of Listings by Number of Bedrooms
Room Capacity Insights for Oak Bluffs
- The dominant room capacity in Oak Bluffs is 3 bedrooms listings, making up 30.5% of the market. This suggests a strong demand for properties suitable for families or small groups.
- Together, 3 bedrooms and 4 bedrooms properties represent 49.7% of the active Airbnb listings in Oak Bluffs, indicating a high concentration in these sizes.
- A significant 61.6% of listings offer 3+ bedrooms, catering to larger groups and families seeking more space in Oak Bluffs.
Oak Bluffs Vacation Rental Guest Capacity Trends (2026)
Distribution of Listings by Guest Capacity
Guest Capacity Insights for Oak Bluffs
- The most common guest capacity trend in Oak Bluffs vacation rentals is listings accommodating 8+ guests (36.8%). This suggests the primary traveler segment is likely larger groups.
- Properties designed for 8+ guests and 6 guests dominate the Oak Bluffs STR market, accounting for 59.1% of listings.
- 64.8% of properties accommodate 6+ guests, serving the market segment for larger families or group travel in Oak Bluffs.
- On average, properties in Oak Bluffs are equipped to host 5.7 guests.
Oak Bluffs Airbnb Booking Patterns (2026): Available vs. Booked Days
Available Days Distribution
Booked Days Distribution
Booking Pattern Insights for Oak Bluffs
- The most common availability pattern in Oak Bluffs falls within the 271-366 days range, representing 62.6% of listings. This suggests many properties have significant open periods on their calendars.
- Approximately 95.3% of listings show high availability (181+ days open annually), indicating potential for increased bookings or specific owner usage patterns.
- For booked days, the 31-90 days range is most frequent in Oak Bluffs (38.7%), reflecting common guest stay durations or potential owner blocking patterns.
- A notable 5.3% of properties secure long booking periods (181+ days booked per year), highlighting successful long-term rental strategies or significant owner usage.
Oak Bluffs Airbnb Minimum Stay Requirements Analysis
Distribution of Listings by Minimum Night Requirement
1 Night
24 listings
7.5% of total
2 Nights
45 listings
14.2% of total
3 Nights
27 listings
8.5% of total
4-6 Nights
51 listings
16% of total
7-29 Nights
15 listings
4.7% of total
30+ Nights
156 listings
49.1% of total
Key Insights
- The most prevalent minimum stay requirement in Oak Bluffs is 30+ Nights, adopted by 49.1% of listings. This highlights the market's preference for longer commitments.
- A significant segment (49.1%) caters to monthly stays (30+ nights) in Oak Bluffs, pointing to opportunities in the extended-stay market.
Recommendations
- Align with the market by considering a 30+ Nights minimum stay, as 49.1% of Oak Bluffs hosts use this setting.
- If feasible, allowing 1-night stays, especially midweek or during low season, could capture last-minute bookings, as only 7.5% currently do.
- Explore offering discounts for stays of 30+ nights to attract the 49.1% of the market seeking extended stays.
- Adjust minimum nights based on seasonality – potentially shorter during low season and longer during peak demand periods in Oak Bluffs.
Oak Bluffs Airbnb Cancellation Policy Trends Analysis (2026)
Limited
2 listings
0.6% of total
Super Strict 60 Days
5 listings
1.6% of total
Super Strict 30 Days
15 listings
4.7% of total
Flexible
12 listings
3.8% of total
Moderate
14 listings
4.4% of total
Firm
135 listings
42.5% of total
Strict
135 listings
42.5% of total
Cancellation Policy Insights for Oak Bluffs
- The prevailing Airbnb cancellation policy trend in Oak Bluffs is Firm, used by 42.5% of listings.
- A majority (85.0%) of hosts in Oak Bluffs utilize Firm or Strict policies, indicating a market where hosts prioritize booking security.
Recommendations for Hosts
- Consider adopting a Firm policy to align with the 42.5% market standard in Oak Bluffs.
- With 42.5% using Strict terms, this is a viable option in Oak Bluffs, particularly for high-value properties or during peak demand periods.
- Regularly review your cancellation policy against competitors and market demand shifts in Oak Bluffs.
Oak Bluffs STR Booking Lead Time Analysis (2026)
Average Booking Lead Time by Month
Booking Lead Time Insights for Oak Bluffs
- The overall average booking lead time for vacation rentals in Oak Bluffs is 91 days.
- Guests book furthest in advance for stays during August (average 141 days), likely coinciding with peak travel demand or local events.
- The shortest booking windows occur for stays in January (average 28 days), indicating more last-minute travel plans during this time.
- Seasonally, Summer (113 days avg.) sees the longest lead times, while Winter (29 days avg.) has the shortest, reflecting typical travel planning cycles.
Recommendations for Hosts
- Use the overall average lead time (91 days) as a baseline for your pricing and availability strategy in Oak Bluffs.
- For August stays, consider implementing length-of-stay discounts or slightly higher rates for bookings made less than 141 days out to capitalize on advance planning.
- Target marketing efforts for the Summer season well in advance (at least 113 days) to capture early planners.
- Monitor your own booking lead times against these Oak Bluffs averages to identify opportunities for dynamic pricing adjustments.
Popular & Essential Airbnb Amenities in Oak Bluffs (2026)
Amenity Prevalence
Amenity Insights for Oak Bluffs
- Essential amenities in Oak Bluffs that guests expect include: Smoke alarm, Wifi, TV. Lacking these (any) could significantly impact bookings.
- Popular amenities like Air conditioning, Carbon monoxide alarm, Hot water are common but not universal. Offering these can provide a competitive edge.
Recommendations for Hosts
- Ensure your listing includes all essential amenities for Oak Bluffs: Smoke alarm, Wifi, TV.
- Prioritize adding missing essentials: Smoke alarm, Wifi, TV.
- Consider adding popular differentiators like Air conditioning or Carbon monoxide alarm to increase appeal.
- Highlight unique or less common amenities you offer (e.g., hot tub, dedicated workspace, EV charger) in your listing description and photos.
- Regularly check competitor amenities in Oak Bluffs to stay competitive.
Oak Bluffs Airbnb Guest Demographics & Profile Analysis (2026)
Guest Profile Summary for Oak Bluffs
- The typical guest profile for Airbnb in Oak Bluffs consists of primarily domestic travelers (94%), often arriving from nearby New York, typically belonging to the Post-2000s (Gen Z/Alpha) group (50%), primarily speaking English or Spanish.
- Domestic travelers account for 94.1% of guests.
- Key international markets include United States (94.1%) and DC (2.6%).
- Top languages spoken are English (75%) followed by Spanish (11.4%).
- A significant demographic segment is the Post-2000s (Gen Z/Alpha) group, representing 50% of guests.
Recommendations for Hosts
- Target domestic marketing efforts towards travelers from New York and Boston.
- Tailor amenities and listing descriptions to appeal to the dominant Post-2000s (Gen Z/Alpha) demographic (e.g., highlight fast WiFi, smart home features, local guides).
- Highlight unique local experiences or amenities relevant to the primary guest profile.
- Consider seasonal promotions aligned with peak travel times for key origin markets.
Nearby Short-Term Rental Market Comparison
How does the Oak Bluffs Airbnb market stack up against its neighbors? Compare key performance metrics like average monthly revenue, ADR, and occupancy rates in surrounding areas to understand the broader regional STR landscape.
| Market | Active Properties | Monthly Revenue | Daily Rate | Avg. Occupancy |
|---|---|---|---|---|
| Nantucket | 539 | $7,748 | $1045.40 | 41% |
| Middletown | 395 | $5,781 | $589.01 | 45% |
| North Andover | 12 | $5,625 | $440.84 | 45% |
| Nahant | 13 | $5,564 | $602.44 | 42% |
| New Shoreham | 120 | $5,359 | $637.79 | 45% |
| Wellesley | 22 | $5,310 | $520.90 | 50% |
| Edgartown | 255 | $5,250 | $818.21 | 40% |
| Mattapoisett | 34 | $5,105 | $476.61 | 52% |
| Amherst | 10 | $5,003 | $366.01 | 44% |
| Chatham | 370 | $4,755 | $532.54 | 43% |