Newton Airbnb Market Analysis 2026: Short Term Rental Data & Vacation Rental Statistics in Massachusetts, United States
Is Airbnb profitable in Newton in 2026? Explore comprehensive Airbnb analytics for Newton, Massachusetts, United States to uncover income potential. This 2026 STR market report for Newton, based on AirROI data from February 2025 to January 2026, reveals key trends in the niche market of 151 active listings.
Whether you're considering an Airbnb investment in Newton, optimizing your existing vacation rental, or exploring rental arbitrage opportunities, understanding the Newton Airbnb data is crucial. Leveraging the low regulation environment is key to maximizing your short term rental income potential. Let's dive into the specifics.
Key Newton Airbnb Performance Metrics Overview
Monthly Airbnb Revenue Variations & Income Potential in Newton (2026)
Understanding the monthly revenue variations for Airbnb listings in Newton is key to maximizing your short term rental income potential. Seasonality significantly impacts earnings. Our analysis, based on data from the past 12 months, shows that the peak revenue month for STRs in Newton is typically May, while January often presents the lowest earnings, highlighting opportunities for strategic pricing adjustments during shoulder and low seasons. Explore the typical Airbnb income in Newton across different performance tiers:
- Best-in-class properties (Top 10%) achieve $8,034+ monthly, often utilizing dynamic pricing and superior guest experiences.
- Strong performing properties (Top 25%) earn $4,748 or more, indicating effective management and desirable locations/amenities.
- Typical properties (Median) generate around $2,397 per month, representing the average market performance.
- Entry-level properties (Bottom 25%) see earnings around $1,195, often with potential for optimization.
Average Monthly Airbnb Earnings Trend in Newton
Newton Airbnb Occupancy Rate Trends (2026)
Maximize your bookings by understanding the Newton STR occupancy trends. Seasonal demand shifts significantly influence how often properties are booked. Typically, Octobersees the highest demand (peak season occupancy), while January experiences the lowest (low season). Effective strategies, like adjusting minimum stays or offering promotions, can boost occupancy during slower periods. Here's how different property tiers perform in Newton:
- Best-in-class properties (Top 10%) achieve 84%+ occupancy, indicating high desirability and potentially optimized availability.
- Strong performing properties (Top 25%) maintain 70% or higher occupancy, suggesting good market fit and guest satisfaction.
- Typical properties (Median) have an occupancy rate around 49%.
- Entry-level properties (Bottom 25%) average 24% occupancy, potentially facing higher vacancy.
Average Monthly Occupancy Rate Trend in Newton
Average Daily Rate (ADR) Airbnb Trends in Newton (2026)
Effective short term rental pricing strategy in Newton involves understanding monthly ADR fluctuations. The Average Daily Rate (ADR) for Airbnb in Newton typically peaks in September and dips lowest during February. Leveraging Airbnb dynamic pricing tools or strategies based on this seasonality can significantly boost revenue. Here's a look at the typical nightly rates achieved:
- Best-in-class properties (Top 10%) command rates of $464+ per night, often due to premium features or locations.
- Strong performing properties (Top 25%) achieve nightly rates of $248 or more.
- Typical properties (Median) charge around $140 per night.
- Entry-level properties (Bottom 25%) earn around $86 per night.
Average Daily Rate (ADR) Trend by Month in Newton
Get Live Newton Market Intelligence 👇

Explore Real-time Analytics
Airbnb Seasonality Analysis & Trends in Newton (2026)
Peak Season (May, July, August)
- Revenue averages $4,761 per month
- Occupancy rates average 55.4%
- Daily rates average $228
Shoulder Season
- Revenue averages $3,804 per month
- Occupancy maintains around 49.8%
- Daily rates hold near $229
Low Season (January, February, December)
- Revenue drops to average $2,287 per month
- Occupancy decreases to average 35.9%
- Daily rates adjust to average $223
Seasonality Insights for Newton
- The Airbnb seasonality in Newton shows highly seasonal trends requiring careful strategy. While the sections above show seasonal averages, it's also insightful to look at the extremes:
- During the high season, the absolute peak month showcases Newton's highest earning potential, with monthly revenues capable of climbing to $4,794, occupancy reaching a high of 58.6%, and ADRs peaking at $247.
- Conversely, the slowest single month of the year, typically falling within the low season, marks the market's lowest point. In this month, revenue might dip to $2,129, occupancy could drop to 30.2%, and ADRs may adjust down to $210.
- Understanding both the seasonal averages and these monthly peaks and troughs in revenue, occupancy, and ADR is crucial for maximizing your Airbnb profit potential in Newton.
Seasonal Strategies for Maximizing Profit
- Peak Season: Maximize revenue through premium pricing and potentially longer minimum stays. Ensure high availability.
- Low Season: Offer competitive pricing, special promotions (e.g., extended stay discounts), and flexible cancellation policies. Target off-season travelers like remote workers or budget-conscious guests.
- Shoulder Seasons: Implement dynamic pricing that balances peak and low rates. Target weekend travelers or specific events. Offer slightly more flexible terms than peak season.
- Regularly analyze your own performance against these Newton seasonality benchmarks and adjust your pricing and availability strategy accordingly.
Best Areas for Airbnb Investment in Newton (2026)
Exploring the top neighborhoods for short-term rentals in Newton? This section highlights key areas, outlining why they are attractive for hosts and guests, along with notable local attractions. Consider these locations based on your target guest profile and investment strategy.
| Neighborhood / Area | Why Host Here? (Target Guests & Appeal) | Key Attractions & Landmarks |
|---|---|---|
| Newton Centre | Charming village center with a mix of shops, restaurants, and access to public transportation. Ideal for families and visitors looking for a community feel while being close to Boston. | Newton Centre Green, Crystal Lake, The Newton Art Gallery, Local shops and cafes, The Newton Farmers Market |
| Nonantum | A quaint neighborhood featuring a blend of cultures and local eateries. Great for guests wanting a unique neighborhood experience with easy access to parks and lakes. | Brae Burn Country Club, Newton's Charles River, Nonantum Village, Parks along the Charles River, Cafes and local restaurants |
| Newton Highlands | An attractive residential neighborhood known for its good schools and family-friendly parks, making it appealing for longer stays and family vacations. | Cold Spring Park, Newton Highlands Playground, Local artisanal shops, Restaurants and cafes, Easy access to public transport |
| Newton Upper Falls | Historical area with a mix of residential homes and local businesses. An excellent choice for budget-conscious travelers who desire a local experience. | Hemlock Gorge Reservation, Upper Falls Greenway, Local diners and cafes, Historic architecture, Parks near the Charles River |
| Waban | A residential area that offers a tranquil environment and beautiful landscapes, perfect for relaxing getaways and family trips. | Waban Village, Dawes Park, Green Edge Gardens, Local shops and cafes, Easy access to the Green Line |
| West Newton | A vibrant area with diverse restaurants, shops, and easy commuter access to Boston. Suitable for business travelers and families. | West Newton Cinema, Restaurants along Washington Street, Parks and open spaces, Newtonville Playground, Historic homes |
| Newton Corner | Located at the intersection of major roads, this area has a good mix of commercial and residential spaces. It provides convenience for visitors and locals alike. | Newton Corner Green, Local shops and services, Historic sites, Cafes and restaurants, Proximity to Boston |
| Newton South | Known for its proximity to schools and parks, offering a peaceful environment suitable for families and visitors seeking a community experience. | Magnetic Springs Park, Mason Rice School, Local dining options, Parks nearby, Community events and activities |
Understanding Airbnb License Requirements & STR Laws in Newton (2026)
While Newton, Massachusetts, United States currently shows low STR regulations, specific Airbnb license requirements might still exist or change. Always verify the latest short term rental regulations and Airbnb license requirements directly with local government authorities for Newton to ensure full compliance before hosting.
(Source: AirROI data, 2026, based on 1% licensed listings)
Top Performing Airbnb Properties in Newton (2026)
Benchmark your potential! Explore examples of top-performing Airbnb properties in Newtonbased on Trailing Twelve Month (TTM) revenue. Analyze their characteristics, revenue, occupancy rate, and ADR to understand what drives success in this market.
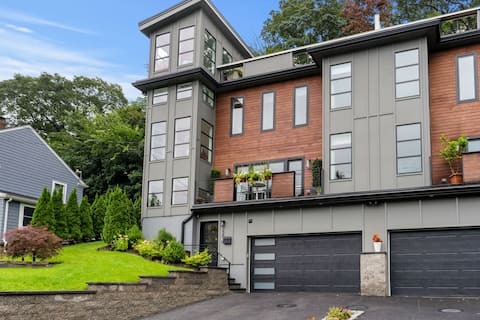
Simply Elegant Townhouse City/Newton STR-24-5
Entire Place • 4 bedrooms
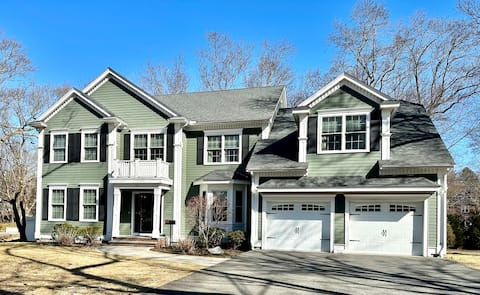
A Peace of Heaven in Newton, MA
Entire Place • 7 bedrooms

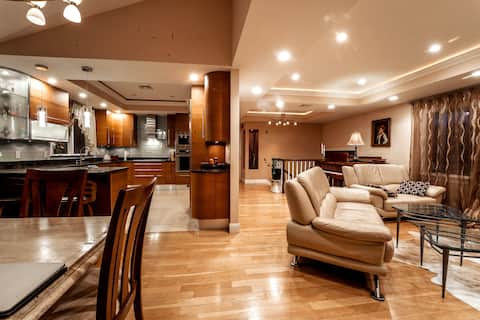
30+ days. New Luxury townhouse, 6 miles to Boston
Entire Place • 4 bedrooms
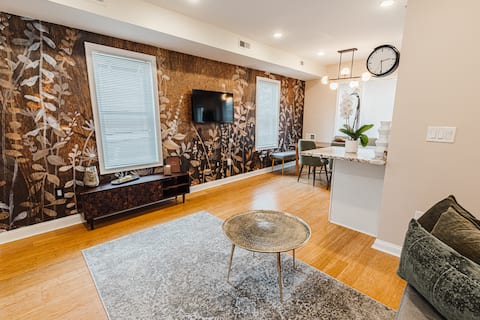
Explore Boston in style! Dream home, pool, sauna.
Entire Place • 4 bedrooms
Inn at Newton Highlands, Suite 2, Apartment-Hotel
Entire Place • 3 bedrooms
Luxury Home in Chestnut Hill MA near Boston
Entire Place • 3 bedrooms
Note: Performance varies based on location, size, amenities, seasonality, and management quality. Data reflects the past 12 months.
Top Performing Airbnb Hosts in Newton (2026)
Learn from the best! This table showcases top-performing Airbnb hosts in Newton based on the number of properties managed and estimated total revenue over the past year. Analyze their scale and performance metrics.
| Host Name | Properties | Grossing Revenue | Stay Reviews | Avg Rating |
|---|---|---|---|---|
| Stas | 3 | $279,846 | 285 | 4.99/5.0 |
| Natalia | 2 | $243,883 | 26 | 4.79/5.0 |
| Sharon | 1 | $190,237 | 18 | 5.00/5.0 |
| Spencer | 1 | $189,274 | 64 | 4.98/5.0 |
| Plushy | 3 | $166,456 | 115 | 4.79/5.0 |
| Tamara | 1 | $125,607 | 83 | 4.94/5.0 |
| Salwa | 2 | $122,594 | 189 | 4.96/5.0 |
| Nina | 1 | $119,842 | 55 | 4.85/5.0 |
| Marc | 1 | $108,870 | 55 | 4.96/5.0 |
| Serge | 1 | $98,176 | 32 | 5.00/5.0 |
Analyzing the strategies of top hosts, such as their property selection, pricing, and guest communication, can offer valuable lessons for optimizing your own Airbnb operations in Newton.
Dive Deeper: Advanced Newton STR Market Data (2026)
Ready to unlock more insights? AirROI provides access to advanced metrics and comprehensive Airbnb data for Newton. Explore detailed analytics beyond this report to refine your investment strategy, optimize pricing, and maximize your vacation rental profits.
Explore Advanced MetricsNewton Short-Term Rental Market Composition (2026): Property & Room Types
Room Type Distribution
Property Type Distribution
Market Composition Insights for Newton
- The Newton Airbnb market composition is heavily skewed towards Entire Home/Apt listings, which make up 51.7% of the 151 active rentals. This indicates strong guest preference for privacy and space.
- However, a notable 48.3% share for Private Rooms suggests opportunities for budget-conscious travelers or hosts renting out spare rooms.
- Looking at the property type distribution in Newton, House properties are the most common (56.3%), reflecting the local real estate landscape.
- Houses represent a significant 56.3% portion, catering likely to families or larger groups.
- The presence of 11.9% Hotel/Boutique listings indicates integration with traditional hospitality.
Newton Airbnb Room Capacity Analysis (2026): Bedroom Distribution
Distribution of Listings by Number of Bedrooms
Room Capacity Insights for Newton
- The dominant room capacity in Newton is 1 bedroom listings, making up 23.2% of the market. This suggests a strong demand for properties suitable for couples or solo travelers.
- Together, 1 bedroom and 2 bedrooms properties represent 39.1% of the active Airbnb listings in Newton, indicating a high concentration in these sizes.
- A significant 21.9% of listings offer 3+ bedrooms, catering to larger groups and families seeking more space in Newton.
Newton Vacation Rental Guest Capacity Trends (2026)
Distribution of Listings by Guest Capacity
Guest Capacity Insights for Newton
- The most common guest capacity trend in Newton vacation rentals is listings accommodating 8+ guests (13.9%). This suggests the primary traveler segment is likely larger groups.
- Properties designed for 8+ guests and 2 guests dominate the Newton STR market, accounting for 23.8% of listings.
- 22.5% of properties accommodate 6+ guests, serving the market segment for larger families or group travel in Newton.
- On average, properties in Newton are equipped to host 2.7 guests.
Newton Airbnb Booking Patterns (2026): Available vs. Booked Days
Available Days Distribution
Booked Days Distribution
Booking Pattern Insights for Newton
- The most common availability pattern in Newton falls within the 271-366 days range, representing 45.7% of listings. This suggests many properties have significant open periods on their calendars.
- Approximately 71.5% of listings show high availability (181+ days open annually), indicating potential for increased bookings or specific owner usage patterns.
- For booked days, the 31-90 days range is most frequent in Newton (27.8%), reflecting common guest stay durations or potential owner blocking patterns.
- A notable 30.4% of properties secure long booking periods (181+ days booked per year), highlighting successful long-term rental strategies or significant owner usage.
Newton Airbnb Minimum Stay Requirements Analysis
Distribution of Listings by Minimum Night Requirement
1 Night
20 listings
13.2% of total
2 Nights
21 listings
13.9% of total
3 Nights
20 listings
13.2% of total
4-6 Nights
14 listings
9.3% of total
7-29 Nights
22 listings
14.6% of total
30+ Nights
54 listings
35.8% of total
Key Insights
- The most prevalent minimum stay requirement in Newton is 30+ Nights, adopted by 35.8% of listings. This highlights the market's preference for longer commitments.
- A significant segment (35.8%) caters to monthly stays (30+ nights) in Newton, pointing to opportunities in the extended-stay market.
Recommendations
- Align with the market by considering a 30+ Nights minimum stay, as 35.8% of Newton hosts use this setting.
- If feasible, allowing 1-night stays, especially midweek or during low season, could capture last-minute bookings, as only 13.2% currently do.
- Explore offering discounts for stays of 30+ nights to attract the 35.8% of the market seeking extended stays.
- Adjust minimum nights based on seasonality – potentially shorter during low season and longer during peak demand periods in Newton.
Newton Airbnb Cancellation Policy Trends Analysis (2026)
Limited
1 listings
0.7% of total
Super Strict 30 Days
1 listings
0.7% of total
Flexible
15 listings
10% of total
Moderate
31 listings
20.7% of total
Firm
69 listings
46% of total
Strict
33 listings
22% of total
Cancellation Policy Insights for Newton
- The prevailing Airbnb cancellation policy trend in Newton is Firm, used by 46% of listings.
- A majority (68.0%) of hosts in Newton utilize Firm or Strict policies, indicating a market where hosts prioritize booking security.
Recommendations for Hosts
- Consider adopting a Firm policy to align with the 46% market standard in Newton.
- Regularly review your cancellation policy against competitors and market demand shifts in Newton.
Newton STR Booking Lead Time Analysis (2026)
Average Booking Lead Time by Month
Booking Lead Time Insights for Newton
- The overall average booking lead time for vacation rentals in Newton is 53 days.
- Guests book furthest in advance for stays during May (average 96 days), likely coinciding with peak travel demand or local events.
- The shortest booking windows occur for stays in February (average 29 days), indicating more last-minute travel plans during this time.
- Seasonally, Spring (69 days avg.) sees the longest lead times, while Winter (34 days avg.) has the shortest, reflecting typical travel planning cycles.
Recommendations for Hosts
- Use the overall average lead time (53 days) as a baseline for your pricing and availability strategy in Newton.
- For May stays, consider implementing length-of-stay discounts or slightly higher rates for bookings made less than 96 days out to capitalize on advance planning.
- Target marketing efforts for the Spring season well in advance (at least 69 days) to capture early planners.
- Monitor your own booking lead times against these Newton averages to identify opportunities for dynamic pricing adjustments.
Popular & Essential Airbnb Amenities in Newton (2026)
Amenity Prevalence
Amenity Insights for Newton
- Essential amenities in Newton that guests expect include: Smoke alarm, Wifi, Heating, Air conditioning. Lacking these (any) could significantly impact bookings.
- Popular amenities like Free parking on premises, Carbon monoxide alarm, Hot water are common but not universal. Offering these can provide a competitive edge.
Recommendations for Hosts
- Ensure your listing includes all essential amenities for Newton: Smoke alarm, Wifi, Heating, Air conditioning.
- Prioritize adding missing essentials: Wifi, Heating, Air conditioning.
- Consider adding popular differentiators like Free parking on premises or Carbon monoxide alarm to increase appeal.
- Highlight unique or less common amenities you offer (e.g., hot tub, dedicated workspace, EV charger) in your listing description and photos.
- Regularly check competitor amenities in Newton to stay competitive.
Newton Airbnb Guest Demographics & Profile Analysis (2026)
Guest Profile Summary for Newton
- The typical guest profile for Airbnb in Newton consists of primarily domestic travelers (86%), often arriving from nearby New York, typically belonging to the Post-2000s (Gen Z/Alpha) group (50%), primarily speaking English or Spanish.
- Domestic travelers account for 86.4% of guests.
- Key international markets include United States (86.4%) and Canada (3.2%).
- Top languages spoken are English (59.1%) followed by Spanish (10.5%).
- A significant demographic segment is the Post-2000s (Gen Z/Alpha) group, representing 50% of guests.
Recommendations for Hosts
- Target domestic marketing efforts towards travelers from New York and Boston.
- Tailor amenities and listing descriptions to appeal to the dominant Post-2000s (Gen Z/Alpha) demographic (e.g., highlight fast WiFi, smart home features, local guides).
- Highlight unique local experiences or amenities relevant to the primary guest profile.
- Consider seasonal promotions aligned with peak travel times for key origin markets.
Nearby Short-Term Rental Market Comparison
How does the Newton Airbnb market stack up against its neighbors? Compare key performance metrics like average monthly revenue, ADR, and occupancy rates in surrounding areas to understand the broader regional STR landscape.
| Market | Active Properties | Monthly Revenue | Daily Rate | Avg. Occupancy |
|---|---|---|---|---|
| Nantucket | 539 | $7,748 | $1045.40 | 41% |
| Pomfret | 15 | $6,549 | $502.74 | 45% |
| Town of East Hampton | 1,327 | $5,945 | $986.02 | 36% |
| Hanover | 33 | $5,826 | $1189.51 | 41% |
| Middletown | 395 | $5,781 | $589.01 | 45% |
| North Andover | 12 | $5,625 | $440.84 | 45% |
| Nahant | 13 | $5,564 | $602.44 | 42% |
| New Shoreham | 120 | $5,359 | $637.79 | 45% |
| South Berwick | 12 | $5,351 | $228.88 | 58% |
| Wellesley | 22 | $5,310 | $520.90 | 50% |