Nantucket Airbnb Market Analysis 2025: Short Term Rental Data & Vacation Rental Statistics in Massachusetts, United States
Is Airbnb profitable in Nantucket in 2025? Explore comprehensive Airbnb analytics for Nantucket, Massachusetts, United States to uncover income potential. This 2025 STR market report for Nantucket, based on AirROI data from September 2024 to August 2025, reveals key trends in the market of 570 active listings.
Whether you're considering an Airbnb investment in Nantucket, optimizing your existing vacation rental, or exploring rental arbitrage opportunities, understanding the Nantucket Airbnb data is crucial. Leveraging the low regulation environment is key to maximizing your short term rental income potential. Let's dive into the specifics.
Key Nantucket Airbnb Performance Metrics Overview
Monthly Airbnb Revenue Variations & Income Potential in Nantucket (2025)
Understanding the monthly revenue variations for Airbnb listings in Nantucket is key to maximizing your short term rental income potential. Seasonality significantly impacts earnings. Our analysis, based on data from the past 12 months, shows that the peak revenue month for STRs in Nantucket is typically July, while January often presents the lowest earnings, highlighting opportunities for strategic pricing adjustments during shoulder and low seasons. Explore the typical Airbnb income in Nantucket across different performance tiers:
- Best-in-class properties (Top 10%) achieve $22,880+ monthly, often utilizing dynamic pricing and superior guest experiences.
- Strong performing properties (Top 25%) earn $13,713 or more, indicating effective management and desirable locations/amenities.
- Typical properties (Median) generate around $7,369 per month, representing the average market performance.
- Entry-level properties (Bottom 25%) see earnings around $3,493, often with potential for optimization.
Average Monthly Airbnb Earnings Trend in Nantucket
Nantucket Airbnb Occupancy Rate Trends (2025)
Maximize your bookings by understanding the Nantucket STR occupancy trends. Seasonal demand shifts significantly influence how often properties are booked. Typically, Julysees the highest demand (peak season occupancy), while January experiences the lowest (low season). Effective strategies, like adjusting minimum stays or offering promotions, can boost occupancy during slower periods. Here's how different property tiers perform in Nantucket:
- Best-in-class properties (Top 10%) achieve 73%+ occupancy, indicating high desirability and potentially optimized availability.
- Strong performing properties (Top 25%) maintain 54% or higher occupancy, suggesting good market fit and guest satisfaction.
- Typical properties (Median) have an occupancy rate around 34%.
- Entry-level properties (Bottom 25%) average 16% occupancy, potentially facing higher vacancy.
Average Monthly Occupancy Rate Trend in Nantucket
Average Daily Rate (ADR) Airbnb Trends in Nantucket (2025)
Effective short term rental pricing strategy in Nantucket involves understanding monthly ADR fluctuations. The Average Daily Rate (ADR) for Airbnb in Nantucket typically peaks in July and dips lowest during November. Leveraging Airbnb dynamic pricing tools or strategies based on this seasonality can significantly boost revenue. Here's a look at the typical nightly rates achieved:
- Best-in-class properties (Top 10%) command rates of $2,095+ per night, often due to premium features or locations.
- Strong performing properties (Top 25%) achieve nightly rates of $1,272 or more.
- Typical properties (Median) charge around $776 per night.
- Entry-level properties (Bottom 25%) earn around $488 per night.
Average Daily Rate (ADR) Trend by Month in Nantucket
Get Live Nantucket Market Intelligence 👇

Explore Real-time Analytics
Airbnb Seasonality Analysis & Trends in Nantucket (2025)
Peak Season (July, August, June)
- Revenue averages $19,645 per month
- Occupancy rates average 53.2%
- Daily rates average $1,205
Shoulder Season
- Revenue averages $8,669 per month
- Occupancy maintains around 35.4%
- Daily rates hold near $956
Low Season (January, February, December)
- Revenue drops to average $5,625 per month
- Occupancy decreases to average 24.4%
- Daily rates adjust to average $914
Seasonality Insights for Nantucket
- The Airbnb seasonality in Nantucket shows highly seasonal trends requiring careful strategy. While the sections above show seasonal averages, it's also insightful to look at the extremes:
- During the high season, the absolute peak month showcases Nantucket's highest earning potential, with monthly revenues capable of climbing to $23,603, occupancy reaching a high of 61.2%, and ADRs peaking at $1,238.
- Conversely, the slowest single month of the year, typically falling within the low season, marks the market's lowest point. In this month, revenue might dip to $5,134, occupancy could drop to 22.6%, and ADRs may adjust down to $902.
- Understanding both the seasonal averages and these monthly peaks and troughs in revenue, occupancy, and ADR is crucial for maximizing your Airbnb profit potential in Nantucket.
Seasonal Strategies for Maximizing Profit
- Peak Season: Maximize revenue through premium pricing and potentially longer minimum stays. Ensure high availability.
- Low Season: Offer competitive pricing, special promotions (e.g., extended stay discounts), and flexible cancellation policies. Target off-season travelers like remote workers or budget-conscious guests.
- Shoulder Seasons: Implement dynamic pricing that balances peak and low rates. Target weekend travelers or specific events. Offer slightly more flexible terms than peak season.
- Regularly analyze your own performance against these Nantucket seasonality benchmarks and adjust your pricing and availability strategy accordingly.
Best Areas for Airbnb Investment in Nantucket (2025)
Exploring the top neighborhoods for short-term rentals in Nantucket? This section highlights key areas, outlining why they are attractive for hosts and guests, along with notable local attractions. Consider these locations based on your target guest profile and investment strategy.
| Neighborhood / Area | Why Host Here? (Target Guests & Appeal) | Key Attractions & Landmarks |
|---|---|---|
| Nantucket Town | The historic heart of Nantucket, known for its charming cobblestone streets, boutique shopping, and waterfront views. A popular destination for tourists seeking a quintessential New England experience. | Whaling Museum, Nantucket Harbor, Main Street shopping, Brant Point Lighthouse, Jetties Beach |
| Siasconset | A picturesque village known for its serene beaches and historic rose-covered cottages. Ideal for visitors seeking a quiet, scenic getaway with stunning ocean views. | Siasconset Beach, Sankaty Head Lighthouse, Cliff Walk, Siasconset Village, Codfish Park |
| Surfside | A family-friendly beach community offering a relaxed atmosphere and close-knit feel. Perfect for families and those looking to enjoy the beach lifestyle. | Surfside Beach, Nantucket Sound, Children's Beach, Jetties Beach |
| Madaket | Famous for its sunsets and beautiful beaches, Madaket is perfect for visitors looking to experience the more laid-back side of the island. | Madaket Beach, Madaket Harbor, Sconset Bluff Walk, Brant Point Lighthouse |
| Cliff Road | Known for its luxurious oceanfront homes and stunning views, this area attracts visitors looking for upscale accommodations and a tranquil escape. | Cliff Road Promenade, Cliff Walk, Nantucket Conservation Foundation, Wauwinet |
| Polpis | A more rural area that offers privacy and quiet, perfect for those seeking peace and nature. Popular with nature lovers and outdoor enthusiasts. | Polpis Harbor, Nantucket Conservation Foundation Trails, Public Beaches, Sanctuary Golf Club |
| Tuckernuck Island | An exclusive and remote island offering pristine beaches and a true escape from the hustle and bustle. Ideal for those seeking a unique vacation experience. | Tuckernuck Beach, Wildlife Preservation, Secluded Dunes, Private Homes |
| Brant Point | A beautiful seaside area known for its iconic lighthouse and proximity to the ferry docks, making it convenient for travelers arriving by boat. | Brant Point Lighthouse, Nantucket Harbor, Ferry Terminal, Children's Beach |
Understanding Airbnb License Requirements & STR Laws in Nantucket (2025)
While Nantucket, Massachusetts, United States currently shows low STR regulations, specific Airbnb license requirements might still exist or change. Always verify the latest short term rental regulations and Airbnb license requirements directly with local government authorities for Nantucket to ensure full compliance before hosting.
(Source: AirROI data, 2025, based on 0% licensed listings)
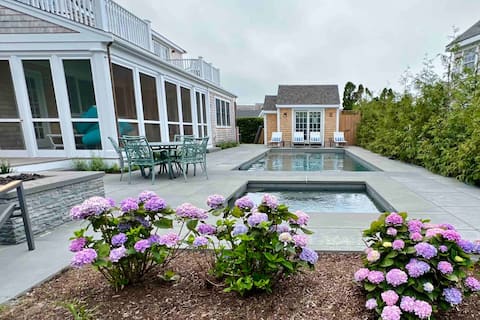
Top Performing Airbnb Properties in Nantucket (2025)
Benchmark your potential! Explore examples of top-performing Airbnb properties in Nantucketbased on Trailing Twelve Month (TTM) revenue. Analyze their characteristics, revenue, occupancy rate, and ADR to understand what drives success in this market.
Relax with Great Pool, Location & Space @CliffNest
Entire Place • 5 bedrooms

The Dunes
Entire Place • 7 bedrooms

Beautiful Brant Point Beach House forSummer’s Last
Entire Place • 4 bedrooms

Serene 5000sf Sanford Farm Estate - Pool & Hot Tub
Entire Place • 6 bedrooms

NEW - Stunning In-Town Home w/ Stone Hot Tub
Entire Place • 7 bedrooms

Dream Vacation Premier Madaket Oceanside Retreat
Entire Place • 9 bedrooms
Note: Performance varies based on location, size, amenities, seasonality, and management quality. Data reflects the past 12 months.
Top Performing Airbnb Hosts in Nantucket (2025)
Learn from the best! This table showcases top-performing Airbnb hosts in Nantucket based on the number of properties managed and estimated total revenue over the past year. Analyze their scale and performance metrics.
| Host Name | Properties | Grossing Revenue | Stay Reviews | Avg Rating |
|---|---|---|---|---|
| Cail | 4 | $1,321,053 | 220 | 4.99/5.0 |
| Kerstin | 7 | $1,266,256 | 458 | 4.95/5.0 |
| Heirloom | 6 | $1,238,200 | 163 | 4.68/5.0 |
| J.P. | 3 | $916,444 | 111 | 4.97/5.0 |
| Liz | 1 | $665,539 | 31 | 4.97/5.0 |
| Genadi | 1 | $540,916 | 10 | 5.00/5.0 |
| Richard | 2 | $503,316 | 17 | 5.00/5.0 |
| Caroline | 1 | $486,586 | 26 | 5.00/5.0 |
| DJV Rentals | 4 | $476,622 | 249 | 4.92/5.0 |
| Karina | 2 | $443,608 | 60 | 5.00/5.0 |
Analyzing the strategies of top hosts, such as their property selection, pricing, and guest communication, can offer valuable lessons for optimizing your own Airbnb operations in Nantucket.
Dive Deeper: Advanced Nantucket STR Market Data (2025)
Ready to unlock more insights? AirROI provides access to advanced metrics and comprehensive Airbnb data for Nantucket. Explore detailed analytics beyond this report to refine your investment strategy, optimize pricing, and maximize your vacation rental profits.
Explore Advanced MetricsNantucket Short-Term Rental Market Composition (2025): Property & Room Types
Room Type Distribution
Property Type Distribution
Market Composition Insights for Nantucket
- The Nantucket Airbnb market composition is heavily skewed towards Entire Home/Apt listings, which make up 80% of the 570 active rentals. This indicates strong guest preference for privacy and space.
- Looking at the property type distribution in Nantucket, House properties are the most common (69.5%), reflecting the local real estate landscape.
- Houses represent a significant 69.5% portion, catering likely to families or larger groups.
- The presence of 14.6% Hotel/Boutique listings indicates integration with traditional hospitality.
- Smaller segments like others, unique stays, outdoor/unique (combined 2.9%) offer potential for unique stay experiences.
Nantucket Airbnb Room Capacity Analysis (2025): Bedroom Distribution
Distribution of Listings by Number of Bedrooms
Room Capacity Insights for Nantucket
- The dominant room capacity in Nantucket is 1 bedroom listings, making up 20.9% of the market. This suggests a strong demand for properties suitable for couples or solo travelers.
- Together, 1 bedroom and 5+ bedrooms properties represent 38.1% of the active Airbnb listings in Nantucket, indicating a high concentration in these sizes.
- A significant 50.9% of listings offer 3+ bedrooms, catering to larger groups and families seeking more space in Nantucket.
Nantucket Vacation Rental Guest Capacity Trends (2025)
Distribution of Listings by Guest Capacity
Guest Capacity Insights for Nantucket
- The most common guest capacity trend in Nantucket vacation rentals is listings accommodating 8+ guests (35.4%). This suggests the primary traveler segment is likely larger groups.
- Properties designed for 8+ guests and 2 guests dominate the Nantucket STR market, accounting for 52.4% of listings.
- 51.7% of properties accommodate 6+ guests, serving the market segment for larger families or group travel in Nantucket.
- On average, properties in Nantucket are equipped to host 5.0 guests.
Nantucket Airbnb Booking Patterns (2025): Available vs. Booked Days
Available Days Distribution
Booked Days Distribution
Booking Pattern Insights for Nantucket
- The most common availability pattern in Nantucket falls within the 271-366 days range, representing 61.9% of listings. This suggests many properties have significant open periods on their calendars.
- Approximately 93.7% of listings show high availability (181+ days open annually), indicating potential for increased bookings or specific owner usage patterns.
- For booked days, the 91-180 days range is most frequent in Nantucket (32.8%), reflecting common guest stay durations or potential owner blocking patterns.
- A notable 6.9% of properties secure long booking periods (181+ days booked per year), highlighting successful long-term rental strategies or significant owner usage.
Nantucket Airbnb Minimum Stay Requirements Analysis
Distribution of Listings by Minimum Night Requirement
1 Night
76 listings
13.5% of total
2 Nights
69 listings
12.2% of total
3 Nights
55 listings
9.8% of total
4-6 Nights
95 listings
16.8% of total
7-29 Nights
71 listings
12.6% of total
30+ Nights
198 listings
35.1% of total
Key Insights
- The most prevalent minimum stay requirement in Nantucket is 30+ Nights, adopted by 35.1% of listings. This highlights the market's preference for longer commitments.
- A significant segment (35.1%) caters to monthly stays (30+ nights) in Nantucket, pointing to opportunities in the extended-stay market.
Recommendations
- Align with the market by considering a 30+ Nights minimum stay, as 35.1% of Nantucket hosts use this setting.
- If feasible, allowing 1-night stays, especially midweek or during low season, could capture last-minute bookings, as only 13.5% currently do.
- Explore offering discounts for stays of 30+ nights to attract the 35.1% of the market seeking extended stays.
- Adjust minimum nights based on seasonality – potentially shorter during low season and longer during peak demand periods in Nantucket.
Nantucket Airbnb Cancellation Policy Trends Analysis (2025)
Super Strict 60 Days
3 listings
0.5% of total
Super Strict 30 Days
56 listings
9.9% of total
Flexible
22 listings
3.9% of total
Moderate
41 listings
7.3% of total
Firm
118 listings
20.9% of total
Strict
324 listings
57.4% of total
Cancellation Policy Insights for Nantucket
- The prevailing Airbnb cancellation policy trend in Nantucket is Strict, used by 57.4% of listings.
- A majority (78.3%) of hosts in Nantucket utilize Firm or Strict policies, indicating a market where hosts prioritize booking security.
Recommendations for Hosts
- Consider adopting a Strict policy to align with the 57.4% market standard in Nantucket.
- With 57.4% using Strict terms, this is a viable option in Nantucket, particularly for high-value properties or during peak demand periods.
- Regularly review your cancellation policy against competitors and market demand shifts in Nantucket.
Nantucket STR Booking Lead Time Analysis (2025)
Average Booking Lead Time by Month
Booking Lead Time Insights for Nantucket
- The overall average booking lead time for vacation rentals in Nantucket is 91 days.
- Guests book furthest in advance for stays during August (average 118 days), likely coinciding with peak travel demand or local events.
- The shortest booking windows occur for stays in January (average 28 days), indicating more last-minute travel plans during this time.
- Seasonally, Summer (112 days avg.) sees the longest lead times, while Winter (48 days avg.) has the shortest, reflecting typical travel planning cycles.
Recommendations for Hosts
- Use the overall average lead time (91 days) as a baseline for your pricing and availability strategy in Nantucket.
- For August stays, consider implementing length-of-stay discounts or slightly higher rates for bookings made less than 118 days out to capitalize on advance planning.
- Target marketing efforts for the Summer season well in advance (at least 112 days) to capture early planners.
- Monitor your own booking lead times against these Nantucket averages to identify opportunities for dynamic pricing adjustments.
Popular & Essential Airbnb Amenities in Nantucket (2025)
Amenity Prevalence
Amenity Insights for Nantucket
- Essential amenities in Nantucket that guests expect include: Wifi, Smoke alarm. Lacking these (any) could significantly impact bookings.
- Popular amenities like TV, Air conditioning, Carbon monoxide alarm are common but not universal. Offering these can provide a competitive edge.
Recommendations for Hosts
- Ensure your listing includes all essential amenities for Nantucket: Wifi, Smoke alarm.
- Prioritize adding missing essentials: Wifi, Smoke alarm.
- Consider adding popular differentiators like TV or Air conditioning to increase appeal.
- Highlight unique or less common amenities you offer (e.g., hot tub, dedicated workspace, EV charger) in your listing description and photos.
- Regularly check competitor amenities in Nantucket to stay competitive.
Nantucket Airbnb Guest Demographics & Profile Analysis (2025)
Guest Profile Summary for Nantucket
- The typical guest profile for Airbnb in Nantucket consists of primarily domestic travelers (96%), often arriving from nearby Boston, typically belonging to the Post-2000s (Gen Z/Alpha) group (50%), primarily speaking English or Spanish.
- Domestic travelers account for 95.6% of guests.
- Key international markets include United States (95.6%) and DC (2%).
- Top languages spoken are English (71.9%) followed by Spanish (12.1%).
- A significant demographic segment is the Post-2000s (Gen Z/Alpha) group, representing 50% of guests.
Recommendations for Hosts
- Target domestic marketing efforts towards travelers from Boston and New York.
- Tailor amenities and listing descriptions to appeal to the dominant Post-2000s (Gen Z/Alpha) demographic (e.g., highlight fast WiFi, smart home features, local guides).
- Highlight unique local experiences or amenities relevant to the primary guest profile.
- Consider seasonal promotions aligned with peak travel times for key origin markets.
Nearby Short-Term Rental Market Comparison
How does the Nantucket Airbnb market stack up against its neighbors? Compare key performance metrics like average monthly revenue, ADR, and occupancy rates in surrounding areas to understand the broader regional STR landscape.
| Market | Active Properties | Monthly Revenue | Daily Rate | Avg. Occupancy |
|---|---|---|---|---|
| Nahant | 12 | $6,440 | $620.28 | 45% |
| North Andover | 12 | $5,711 | $436.05 | 49% |
| North Hampton | 10 | $5,604 | $542.10 | 38% |
| Middletown | 402 | $5,042 | $546.49 | 43% |
| New Shoreham | 113 | $4,810 | $641.26 | 42% |
| Westminster | 10 | $4,736 | $445.48 | 55% |
| Wellesley | 21 | $4,493 | $514.59 | 50% |
| Duxbury | 19 | $4,432 | $504.82 | 42% |
| Swampscott | 44 | $4,399 | $448.48 | 47% |
| Scituate | 106 | $4,387 | $493.99 | 44% |